AUDUSD Daily Chart Analysis -Q3 W35 D1 Y25📊 AUDUSD Daily Chart Analysis
📅 Q3 W35 D1 Y25
Good day, Traders 👋
AUDUSD is currently showing potential for both 🔼 long and 🔽 short positions, with a clearly defined trading range visible on the higher time frames 🕰️.
While the overall bias remains bullish 📈, a break in structure from the highs ⛔—paired with strong confirmation—could open the door to a short position 📉.
I trade and teach using SMC (Smart Money Concepts) 🧠💰, applying a top-down analysis 🔍 to identify high-probability areas. These zones are refined on the lower time frames ⏳, where I wait for a break of structure 🧱 that meets my entry criteria ✅ before executing any trades.
Wishing you the best on your trading journey 🚀📈
— FRGNT 🔐
FX:AUDUSD
Trade ideas

USDCHF — Watch the Floor at 0.81714Summary
Price is standing on a floor at 0.81714. If that floor breaks, price could fall down to the “basement” at 0.78722. This is only my idea, not advice.
Description
I like to think of price like a person in a house.
Right now, they are standing on the floor at 0.81714.
If that floor breaks, they can fall down to the lower levels: 0.8050, then 0.7950, and maybe all the way to the basement at 0.78722.
If the floor holds, price might instead climb the stairs up toward 0.8220.
What I’m watching: I want to see a strong red candle close under 0.81714 before thinking the floor is broken. If price jumps back above 0.8220, then my idea is wrong.
Disclaimer
This is just my personal view for learning. It is not financial advice or a trade signal.

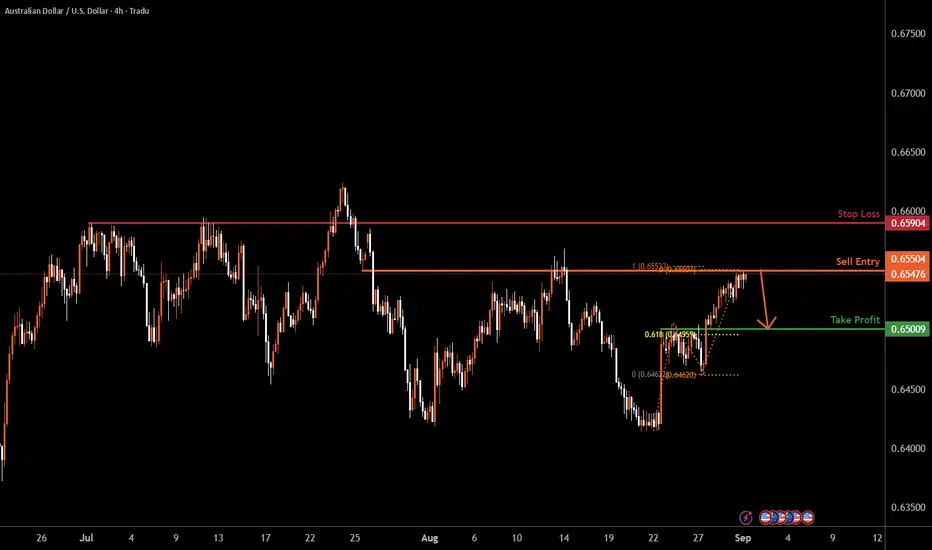
AUDUSD H4 | Could the Aussie Be Setting Up for a Reversal?Based on the H4 chart analysis, we can see that the price is reacting off the sell entry, which is a pullback resistance that aligns with the 100% Fibonacci projection and could reverse from this level to the take profit.
Sell entry is at 0.6550, which is a pullback resistance that aligns with the 100% Fibonacci projection.
Stop loss is at 0.6590, which is a pullback resistance.
Take profit is at 0.6500, which is a pullback support that aligns with the 61.8% Fibonacci retracement.
High Risk Investment Warning
Trading Forex/CFDs on margin carries a high level of risk and may not be suitable for all investors. Leverage can work against you.
Stratos Markets Limited (tradu.com ):
CFDs are complex instruments and come with a high risk of losing money rapidly due to leverage. 65% of retail investor accounts lose money when trading CFDs with this provider. You should consider whether you understand how CFDs work and whether you can afford to take the high risk of losing your money.
Stratos Europe Ltd (tradu.com ):
CFDs are complex instruments and come with a high risk of losing money rapidly due to leverage. 66% of retail investor accounts lose money when trading CFDs with this provider. You should consider whether you understand how CFDs work and whether you can afford to take the high risk of losing your money.
Stratos Global LLC (tradu.com ):
Losses can exceed deposits.
Please be advised that the information presented on TradingView is provided to Tradu (‘Company’, ‘we’) by a third-party provider (‘TFA Global Pte Ltd’). Please be reminded that you are solely responsible for the trading decisions on your account. There is a very high degree of risk involved in trading. Any information and/or content is intended entirely for research, educational and informational purposes only and does not constitute investment or consultation advice or investment strategy. The information is not tailored to the investment needs of any specific person and therefore does not involve a consideration of any of the investment objectives, financial situation or needs of any viewer that may receive it. Kindly also note that past performance is not a reliable indicator of future results. Actual results may differ materially from those anticipated in forward-looking or past performance statements. We assume no liability as to the accuracy or completeness of any of the information and/or content provided herein and the Company cannot be held responsible for any omission, mistake nor for any loss or damage including without limitation to any loss of profit which may arise from reliance on any information supplied by TFA Global Pte Ltd.
The speaker(s) is neither an employee, agent nor representative of Tradu and is therefore acting independently. The opinions given are their own, constitute general market commentary, and do not constitute the opinion or advice of Tradu or any form of personal or investment advice. Tradu neither endorses nor guarantees offerings of third-party speakers, nor is Tradu responsible for the content, veracity or opinions of third-party speakers, presenters or participants.
AUD/USD Supply Rejection Setup + DXY HTF alignment AUD/USD is trading into a significant unmitigated supply POI that overlaps with an imbalance (IMB), creating a strong confluence zone for potential rejection.
Unmitigated POI + IMB:
Price has rallied directly into the shaded supply area around 0.6550–0.6570, which remains untested from previous distribution. This zone combines both a supply POI and an imbalance, making it a high-probability reversal region.
FVGs Below:
Two large Fair Value Gaps (FVGs) remain unmitigated on the downside, highlighted in green. These gaps act as magnets for price, suggesting that if sellers engage at the supply zone, price could retrace deeply to fill them.
Context:
The prior bearish leg created displacement and inefficiency, and this current rally can be viewed as corrective orderflow returning into premium pricing. A rejection here aligns with a continuation of the broader bearish narrative.
Outlook:
As long as price respects the 0.6550–0.6570 supply/imbalance region, sellers have the upper hand, targeting the FVGs below at 0.6490–0.6470 and potentially deeper toward 0.6420–0.6400.

AUD-USD Bullish Bias! Buy!
Hello,Traders!
AUD-USD made a bullish
Breakout of the key
Horizontal level of 0.6624
Which is now a support
Then made a retest and
A rebound so we are
Bullish biased and we
Will be expecting a
Further bullish move up
Buy!
Comment and subscribe to help us grow!
Check out other forecasts below too!
Disclosure: I am part of Trade Nation's Influencer program and receive a monthly fee for using their TradingView charts in my analysis.

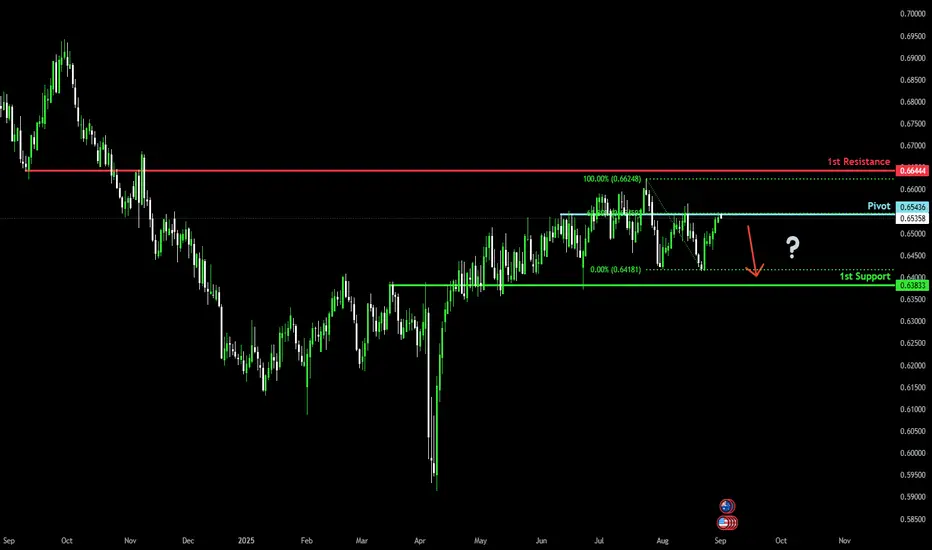
Bearish Reversal Forming off Key Resistance?The Aussie (AUD/USD) is reacting off the pivot and could reverse to the 1st support.
Pivot: 0.6543
1st Support: 0.6383
1st Resistance: 0.6644
Risk Warning:
Trading Forex and CFDs carries a high level of risk to your capital and you should only trade with money you can afford to lose. Trading Forex and CFDs may not be suitable for all investors, so please ensure that you fully understand the risks involved and seek independent advice if necessary.
Disclaimer:
The above opinions given constitute general market commentary, and do not constitute the opinion or advice of IC Markets or any form of personal or investment advice.
Any opinions, news, research, analyses, prices, other information, or links to third-party sites contained on this website are provided on an "as-is" basis, are intended only to be informative, is not an advice nor a recommendation, nor research, or a record of our trading prices, or an offer of, or solicitation for a transaction in any financial instrument and thus should not be treated as such. The information provided does not involve any specific investment objectives, financial situation and needs of any specific person who may receive it. Please be aware, that past performance is not a reliable indicator of future performance and/or results. Past Performance or Forward-looking scenarios based upon the reasonable beliefs of the third-party provider are not a guarantee of future performance. Actual results may differ materially from those anticipated in forward-looking or past performance statements. IC Markets makes no representation or warranty and assumes no liability as to the accuracy or completeness of the information provided, nor any loss arising from any investment based on a recommendation, forecast or any information supplied by any third-party.
AUDUSD (Forcast)Already on a monthly offer area. we are waiting for a confirmation (change of structure) 1 hour before selling our area 4h. but in the meantime in 15m, we are looking for a long position in the last direction BOS 1h

AUDUSD| Bullish Bias - Momentum Holding Strong🔹 HTF (4H): Structure shows clear bullish intent with strong momentum to the upside. Large bullish candles confirm continuation potential.
🔹 MTF (30M): Price cleared liquidity, mitigated the OB, and refined structure for continuation longs.
🔹 LTF (5M): A CHoCH confirmed directional shift, leading to bullish runs toward the highs.
🔹 Execution Plan: Waiting for price to mitigate my marked OB before reloading longs to target major highs. Until then, patience — let smart money defend the level before we step back in.
🔹 Mindset Note: The market is delivering. Our role is to wait for the OB to be tapped and then execute with precision.

AUDUSD Q3 W36 Y25 ForecastHigher Time Frame Overview (Weekly/Da🔎 AUDUSD Q3 W36 Y25 Forecast
🧠 Higher Time Frame Overview (Weekly/Daily)
There hasn’t been much aggressive movement on the higher timeframes, particularly the weekly and daily charts. That said:
The 50 EMA is sitting comfortably in the middle of price action for August, suggesting consolidation or a clear range-bound market.
This kind of environment offers defined trading ranges, making lower timeframe setups more actionable for both swing and intraday traders.
✅ Plan of Action
🔹 Bullish Bias on Higher Time Frames
Week 35 closed with strong bullish price action, pushing the daily candle above the 50EMA.
This provides confirmation for a higher-probability long setup from range lows.
The weekly candle also supports bullish continuation, forming a solid base and momentum structure.
🔔 Bias: Bullish on higher time frames — prefer buying from support levels or imbalance zones.
🔍 Lower Time Frame Strategy (4H / 15M)
🔸 4H Analysis
A clear 4H order block led to the creation of a lower low, identifying a potential point of interest (POI) for a pullback and intraday short.
Target for the short idea includes:
Weekly imbalance zone
Daily 50EMA
Weekly 50EMA
⚠️ Short positions should be considered countertrend, so:
Stop-losses should be moved to breakeven quickly once structural levels are broken.
Use tight risk management and watch for early signs of rejection from key zones.
🔸 15-Minute Confirmation
Looking for a break of structure (BOS) on the 15M chart to confirm bearish intent.
After BOS, wait for a pullback into a 15M POI before entering a continuation short.
FRGNT
FX:AUDUSD

AUDUSD Potential LONgConfirmation.
✔ Fits SMC structure shift (HH + HL).
✔ Entry inside demand zone + FVG.
✔ ICT OTE alignment (discount retracement).
✔ Liquidity sweep below 0.6460 strengthens bullish case.
Beware:
⚠ Market may still be consolidating.
⚠ No confirmed BOS yet (aggressive entry = risk).
⚠ ICT warns about deeper liquidity sweeps → possible stop-hunt below 0.6460 before rally.
⚠ Higher timeframe may still favor bearish order flow.

AUDUSDRising Wedge with Bearish Divergence found AUDSUD chart which looks like bearish, expected entry point and stop loss mention with TP.

AUDUSD: Anticipate ShortAUDUSD is surfacing near a resitance level at 0.6547 the pair have been respecting the support and resistance zone within this recent days.
A partial breakout above this resistance zone will active a slight upward move, meanwhile in regard of this structure the pair is on a expected short..
Possible outline: A comfirmed reversal below 0.6539 will trigger downward move targeting 0.6347 as the next support.
At this point we keep a close eye on this resistance zone to see if the long will continue or would respect the zone and short as expected.
like and share your thoughts on this pair thanks

AUDUSD: Buy-the-Dip Above KumoWhy:
Ichimoku: Price above Kumo, Tenkan > Kijun, future cloud turning up, Chikou above price & cloud → bullish stack.
27–28th printed a Break of Structure with a wide bullish impulse, then a Rally-Base-Rally. The prior ceiling ~0.6500–0.6510 is now support (classic pullback after breakout zone).
After the impulse, we have small-bodied consolidation / bull flag near highs; no clear bearish reversal (no evening star / bearish engulfing at the top).
Earlier range breaks failed inside the cloud; the last break closed above the range & Kumo and held on the retest → favors a true breakout.
Key levels
Support (buy-the-dip): 0.6510–0.6525 (Tenkan/Kijun cluster), 0.6500 (former ceiling), 0.6475 (Kumo top).
Resistance/targets: 0.6555–0.6565 (recent swing high), 0.6590–0.6600, extension 0.6620.
If H1–H4 closes below 0.6475, bullish case fails → risk a drop to 0.6450 → 0.6425 (cloud backfill / demand).

AUD/USD Swing Sell SetupOANDA:AUDUSD
AUD/USD Swing Sell Setup
- Current Price: 0.6550
- Invalidation Level: 0.66255
- Take Profit Targets:
- TP1: 0.6504
- TP2: 0.6450
- TP3: 0.6430
- TP4: 0.63556
Technical Analysis:
The AUD/USD pair is currently performing an ABC correction, suggesting a high probability of rejection at the current price level. The price action indicates a classic rising wedge pattern, which typically represents a decrease in buying volume, evidenced by the declining strength of buying interest indicated by the volume profile on the chart.
The invalidation level for this trade setup is set at 0.66255. Traders should consider entering the sell position if the price remains below this level.
Risk Management:
Be patient and manage your risk effectively while entering this trade. Monitor the situation closely and ensure to adjust your stop-loss levels accordingly to protect your capital.
Good luck, traders! 💰📉

AUD USD KEY LEVELS Hello traders, this is the AUD-USD 15m pivot support zone.
Based on market trend and previous day movement.
Intraday pivot support zone represented by the green line. (0.65250)
Key levels;
Entry: 0.65250
Target: 0.65400
Stop loss: 0.65100
Risk Reward Ratio 1:1
Your likes and boosts motivate us to keep learning and sharing ideas!

powell newsavoid powell news.. all my perfect sell entries were taken out the very second this fed chair pwell news broke out

AUDUSDNon-commercial (speculators) net positions in AUD are decreasing, signaling declining bullish sentiment.
Commercial hedgers are increasing long positions in USD, supporting a stronger U.S. dollar.
Open interest in AUD futures is rising, but with more short contracts – a classic sign of bearish pressure building.
This suggests institutions are shifting away from AUD and seeking refuge in the USD, reflecting risk-off sentiment and potential upcoming downside in the AUD/USD pair.
Bias: Bearish
Strategy: Look for short opportunities on pullbacks, especially near resistance levels or key fib retracements.

AUD_USD WILL GO UP|LONG|
✅AUD_USD is going up
Now and the pair made a bullish
Breakout of the key horizontal
Level of 0.6525 and the breakout
Is confirmed so we are bullish
Biased and we will be expecting
A further bullish move up
LONG🚀
✅Like and subscribe to never miss a new idea!✅

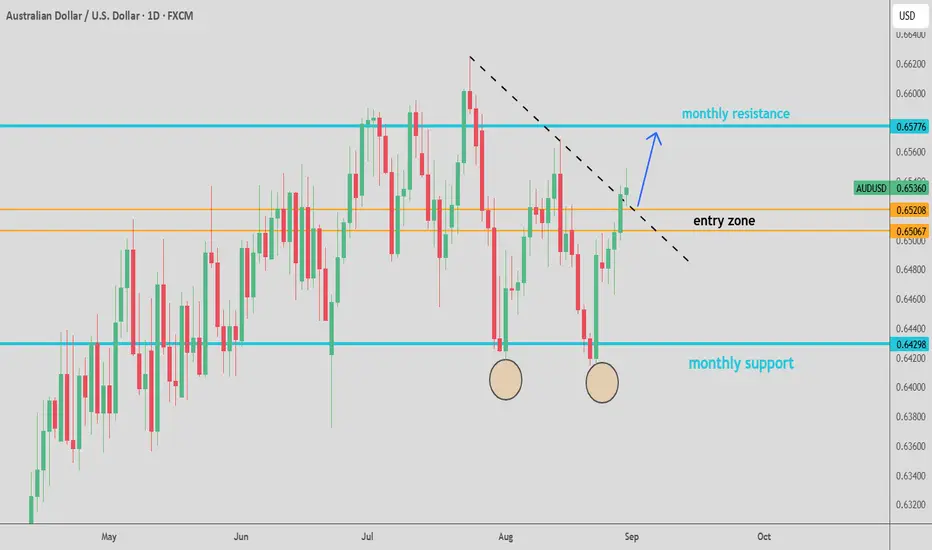
AUDUSD – Plan Ready for Both ScenariosWe're patiently waiting for price to reach our key zone. If we get a valid sell signal, we’ll take the short.
But if the market breaks above this level with strength and gives us a clean pullback, we’re ready to go long.
No guessing. No hoping. Just reacting to what the market shows us.
📌 Discipline over prediction.

SELL AUDUSD We are almost on our order block which will be our entry on the market.
Seeing the entire structure of the market, i see a double top and the market went up to test its neck. So now we are expecting the sellers after the neck has been retested

29.08.25 Morning ForecastPairs on Watch -
FX:AUDUSD
FX:EURUSD
FX:GBPUSD
FX:EURNZD
A short overview of the instruments I am looking at for today, multi-timeframe analysis down to what I will be looking at for an entry. Enjoy!

Lingrid | AUDUSD Shorting Opportunity After Fake BreakoutFX:AUDUSD is facing rejection near resistance after a recent upward push, signaling weakening momentum. The structure shows price moving within an upward channel but failing to hold above the short-term resistance. A further decline is likely if the pair sustains below 0.6550, targeting the next support zone. Broader price action points to a corrective move within the channel as momentum fades.
📉 Key Levels
Sell trigger: Rejection of 0.6552 resistance
Sell zone: 0.6550 – 0.6530 region
Target: 0.6503
Invalidation: Break above 0.6555
💡 Risks
Strong USD weakness from unexpected macro data could flip the setup.
Breakout above the resistance zone would invalidate the bearish scenario.
Shifts in risk sentiment from global markets could drive renewed AUD strength.
If this idea resonates with you or you have your own opinion, traders, hit the comments. I’m excited to read your thoughts!
