AUSSIE H4 | Bullish reversalBased on the H4 chart analysis, we can see that the price has bounced off the buy entry, identified as an overlap support, and could continue rising to the upside.
Buy entry is at 0.6481, which is an overlap support.
Stop loss is at 0.64450, which is a pullback support.
Take profit is at 0.6551, which is a swing high resistance.
High Risk Investment Warning
Trading Forex/CFDs on margin carries a high level of risk and may not be suitable for all investors. Leverage can work against you.
Stratos Markets Limited (tradu.com ):
CFDs are complex instruments and come with a high risk of losing money rapidly due to leverage. 65% of retail investor accounts lose money when trading CFDs with this provider. You should consider whether you understand how CFDs work and whether you can afford to take the high risk of losing your money.
Stratos Europe Ltd (tradu.com ):
CFDs are complex instruments and come with a high risk of losing money rapidly due to leverage. 66% of retail investor accounts lose money when trading CFDs with this provider. You should consider whether you understand how CFDs work and whether you can afford to take the high risk of losing your money.
Stratos Global LLC (tradu.com ):
Losses can exceed deposits.
Please be advised that the information presented on TradingView is provided to Tradu (‘Company’, ‘we’) by a third-party provider (‘TFA Global Pte Ltd’). Please be reminded that you are solely responsible for the trading decisions on your account. There is a very high degree of risk involved in trading. Any information and/or content is intended entirely for research, educational and informational purposes only and does not constitute investment or consultation advice or investment strategy. The information is not tailored to the investment needs of any specific person and therefore does not involve a consideration of any of the investment objectives, financial situation or needs of any viewer that may receive it. Kindly also note that past performance is not a reliable indicator of future results. Actual results may differ materially from those anticipated in forward-looking or past performance statements. We assume no liability as to the accuracy or completeness of any of the information and/or content provided herein and the Company cannot be held responsible for any omission, mistake nor for any loss or damage including without limitation to any loss of profit which may arise from reliance on any information supplied by TFA Global Pte Ltd.
The speaker(s) is neither an employee, agent nor representative of Tradu and is therefore acting independently. The opinions given are their own, constitute general market commentary, and do not constitute the opinion or advice of Tradu or any form of personal or investment advice. Tradu neither endorses nor guarantees offerings of third
Trade ideas

Heading into pullback resitance?The Aussie (AUD/USD) is rising towards the pivot, which has been identified as a pullback resistance and could reverse to the 1st support, which is a swing low support.
Pivot: 0.6546
1st Support: 0.6414
1st Resistance: 0.6604
Risk Warning:
Trading Forex and CFDs carries a high level of risk to your capital and you should only trade with money you can afford to lose. Trading Forex and CFDs may not be suitable for all investors, so please ensure that you fully understand the risks involved and seek independent advice if necessary.
Disclaimer:
The above opinions given constitute general market commentary, and do not constitute the opinion or advice of IC Markets or any form of personal or investment advice.
Any opinions, news, research, analyses, prices, other information, or links to third-party sites contained on this website are provided on an "as-is" basis, are intended only to be informative, is not an advice nor a recommendation, nor research, or a record of our trading prices, or an offer of, or solicitation for a transaction in any financial instrument and thus should not be treated as such. The information provided does not involve any specific investment objectives, financial situation and needs of any specific person who may receive it. Please be aware, that past performance is not a reliable indicator of future performance and/or results. Past Performance or Forward-looking scenarios based upon the reasonable beliefs of the third-party provider are not a guarantee of future performance. Actual results may differ materially from those anticipated in forward-looking or past performance statements. IC Markets makes no representation or warranty and assumes no liability as to the accuracy or completeness of the information provided, nor any loss arising from any investment based on a recommendation, forecast or any information supplied by any third-party.

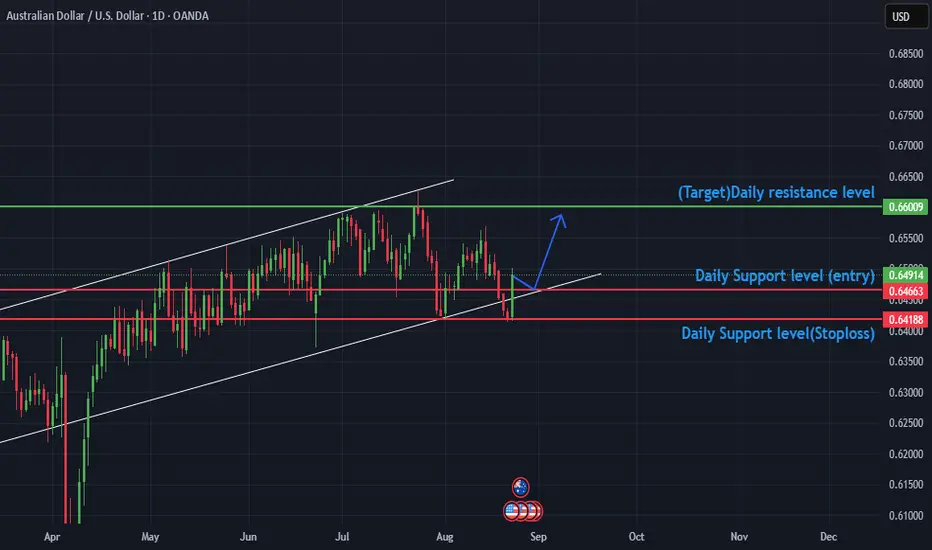
AUDUSD Daily analysis for 25-08-2025 to 29-08-2025Trade Plan Inferred from Chart
This setup is based on a potential bounce from a retest of trendline support, aiming for a move toward resistance:
Long Position Idea:
Entry near: 0.64663
Stop Loss: Below trendline at 0.64188
Target: Upper resistance level at 0.66009
🔢 Risk-to-Reward Calculation:
Metric Value
Entry 0.64663
Stop Loss 0.64188 (47.5 pips)
Target 0.66009 (134.6 pips)
AUDUSD| Bullish Structure RefinementPair: AUDUSD (AU)
Bias: Bullish
HTF Overview (4H): Bullish structure remains intact. Price has yet to mitigate the refined 4H OB, leaving room for continuation.
MTF Confirmation (30M): Price swept sell-side liquidity and mitigated the OB. A lower high has now broken, signaling intent. Waiting for a pullback sweep to refine long entries.
Entry Zone (5M): Entry will be executed after the sweep + pullback confirms direction on the lower timeframe.
Targets:
• TP1 = 5M highs
• TP2 = 30M highs (depending on market delivery)
Mindset Note: Confirmation first, execution second — let the sweep provide the edge.

AUDUSD 4HIn this series of analyses, we have reviewed trading perspectives and short-term outlooks.
As can be seen, in each analysis there is a key support/resistance zone close to the current asset price, and the market’s reaction or breakout at this level will determine the next price trend toward the specified targets.
Important note: The purpose of these trading perspectives is to highlight significant levels ahead of the price and potential market reactions to these levels. The provided analyses are by no means trading signals!

AUDUSD H8 | Market OutlookPotential for a bearish pullback on the AUDUSD H8 which could lead to a price movement towards the support level at 0.63300. SELL levels from 0.65320

AUDUSD TRADE SETUPWait for retest the entry level and bearish momentum then take a trade for Sell otherwise skip this setup

AUDUSD: Strong Uptrend Driven by Positive Economic DataTechnical Analysis:
AUDUSD is currently showing a strong uptrend, with resistance at 0.65500 and support at 0.64200. If the price stays above the support level, the uptrend will continue, with a potential target of 0.64860. However, if the price breaks below the support, a downtrend could be triggered. For now, with strong momentum from technical indicators, the uptrend remains favored.
Market Context:
Recent positive economic data from the US dollar zone has boosted the AUD, providing strong support for AUDUSD. Along with favorable macroeconomic factors, the AUD continues to strengthen against the USD, driving the pair into a stable uptrend.
Trading Strategy:
With technical signals and a favorable market backdrop, traders can consider buying AUDUSD when the price adjusts to the 0.64200 support, with a potential target at 0.64860. However, close monitoring of the support level is crucial, and a stop-loss should be placed below 0.64200 to protect capital if the market reverses.


AUD/USD – Possible Bullish Reversal with Volume Profile
The Australian Dollar (AUD/USD) has been consolidating after a strong bearish move. Looking at the Volume Profile (VPVR) , we can see:
🔹 High-Volume Node near 0.6480 – this acts as a strong magnet for price.
🔹 Price Base Formation – market has been ranging, showing signs of accumulation.
🔹 If buyers step in, we could see a move towards 0.6480–0.6500 zone , where liquidity is clustered.
My Bias:
➡️ Short-term bullish outlook as long as price holds above the recent range bottom.
➡️ Potential upside targets: 0.6480 → 0.6520.
➡️ If the breakdown below the box, this outlook is invalid.
✍️ This is not financial advice, just my personal trading analysis based on Volume Profile and structure.

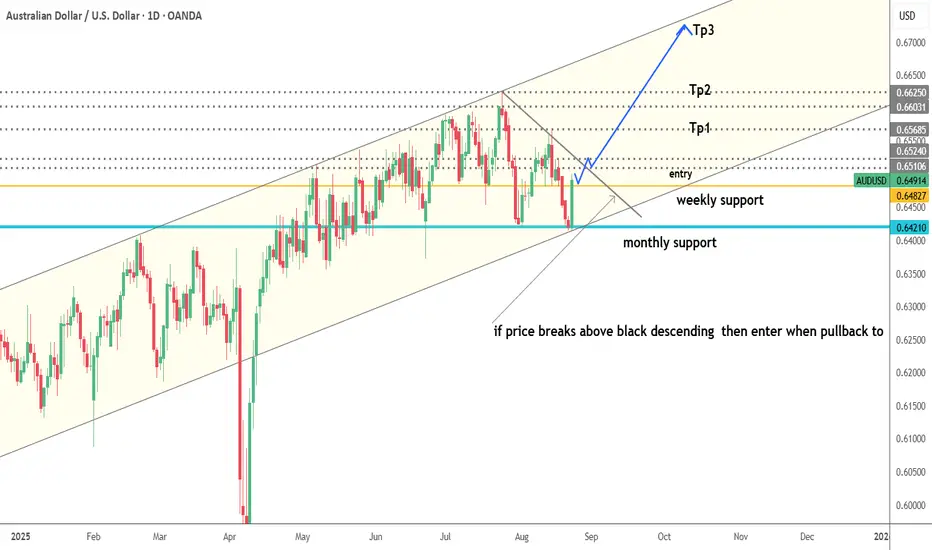
AUDUSD--BUY--all details are given in chart
--if price breaks above descending trend line then after pullback enter the trade
Aussie: Range-bound 'til further noticeAs expected, TVC:DXY revisited last week's lows after the Jackson Hole meeting where Powell hinted at rate cuts and re-assured us that the jobs numbers are less important than inflation data.
We now understand that 2% inflation could be long gone and that the loss of jobs, doesn't mean the loss of money, because of the early adoption of AI. I know of a local US tech shop that laid off 3 engineers in an attempt to replace their function with GPTs. It's not off to a great start, but hey they're saving $400k a year for now. The job data has long-term implications that I believe have yet to fully unfold, so let's ignore for now.
OANDA:AUDUSD should be bullish until at least September 17. I believe the cut has already been priced in, explaining the dip sub 97 for TVC:DXY to find a bottom.
My plan for the next few weeks is to trade the ranges you see in the chart. I'm buying dips above .6460 and bearish below that point.

AUDUSD Short - Liquidity sweep from a good Resistance area.The price has reached a "good Resistance area," which is a strong historical price level where selling pressure is expected to be high.
A "Liquidity sweep" has occurred, which is a key technical signal indicating that the price has temporarily moved above the resistance to trigger stop-loss orders and trap breakout traders before reversing sharply.

AUD/USD – Testing Support at 0.6420Trend: Long-term uptrend, short-term correction.
Current price: 0.6420.
⸻
Bullish scenario
• Entry: BUY LIMIT 0.6420
• Target: 0.6562
• Stop: 0.6370
Bearish scenario
• Entry: SELL STOP 0.6370
• Target: 0.6200
• Stop: 0.6430
⸻
Key levels
Support: 0.6420, 0.6370, 0.6200
Resistance: 0.6562, 0.6622, 0.6703
Indicators
• EMA(21) below price → short-term bearish.
• EMA(190) holds trend → long-term bullish.
• RSI(14) → near oversold zone, possible rebound.
⸻
📌 Holding 0.6420 keeps bullish chances alive with targets 0.6562–0.6622. Break below 0.6370 → shift to bearish trend toward 0.6200.

AUDUSD SELLLooking for a potential sell on audusd. USD positive for the news and stronger that the aussie. Im thinking a rebound back up before the drop but im taking this sell now

Could the Aussie bounce from here?The price is reacting off the pivot which is a swing low support, and could bounce to the 1st resistance.
Pivot: 1.6420
1st Support: 0.6387
1st Resistance: 0.6482
Risk Warning:
Trading Forex and CFDs carries a high level of risk to your capital and you should only trade with money you can afford to lose. Trading Forex and CFDs may not be suitable for all investors, so please ensure that you fully understand the risks involved and seek independent advice if necessary.
Disclaimer:
The above opinions given constitute general market commentary, and do not constitute the opinion or advice of IC Markets or any form of personal or investment advice.
Any opinions, news, research, analyses, prices, other information, or links to third-party sites contained on this website are provided on an "as-is" basis, are intended only to be informative, is not an advice nor a recommendation, nor research, or a record of our trading prices, or an offer of, or solicitation for a transaction in any financial instrument and thus should not be treated as such. The information provided does not involve any specific investment objectives, financial situation and needs of any specific person who may receive it. Please be aware, that past performance is not a reliable indicator of future performance and/or results. Past Performance or Forward-looking scenarios based upon the reasonable beliefs of the third-party provider are not a guarantee of future performance. Actual results may differ materially from those anticipated in forward-looking or past performance statements. IC Markets makes no representation or warranty and assumes no liability as to the accuracy or completeness of the information provided, nor any loss arising from any investment based on a recommendation, forecast or any information supplied by any third-party.

AUDUSD Tests 0.64400 as DXY Strengthens on Fed BetsHey Traders, in today's trading session we are monitoring AUDUSD for a selling opportunity around 0.64400 zone, AUDUSD is correcting higher within its broader downtrend, with price approaching the 0.64400 resistance area. This zone aligns with prior supply and could be pivotal in determining whether bearish momentum resumes or a deeper retracement unfolds.
The U.S. Dollar Index (DXY) recently broke above the 98.700 key resistance, reinforcing its bullish bias. With U.S. inflation still elevated, markets are focused on potential hawkish commentary from the Federal Reserve at the Jackson Hole symposium — a factor that could further strengthen the dollar and weigh on AUDUSD.
Price action around 0.64400 will be critical in assessing whether sellers reassert control or the correction continues.

Bullish bounce off?AUD/USD is reacting off the support level, which is a swing low support and could bounce from this level to our take profit.
Entry: 0.6420
Why we like it:
There is a swing low support.
Stop loss: 0.6388
Why we like it:
There is a swing low support that is slightly above the 127.2% Fibonacci extension.
Take profit: 0.6481
Why we like it:
There is an overlap resistance that is slightly below the 50% Fibonacci retracement.
Enjoying your TradingView experience? Review us!
Please be advised that the information presented on TradingView is provided to Vantage (‘Vantage Global Limited’, ‘we’) by a third-party provider (‘Everest Fortune Group’). Please be reminded that you are solely responsible for the trading decisions on your account. There is a very high degree of risk involved in trading. Any information and/or content is intended entirely for research, educational and informational purposes only and does not constitute investment or consultation advice or investment strategy. The information is not tailored to the investment needs of any specific person and therefore does not involve a consideration of any of the investment objectives, financial situation or needs of any viewer that may receive it. Kindly also note that past performance is not a reliable indicator of future results. Actual results may differ materially from those anticipated in forward-looking or past performance statements. We assume no liability as to the accuracy or completeness of any of the information and/or content provided herein and the Company cannot be held responsible for any omission, mistake nor for any loss or damage including without limitation to any loss of profit which may arise from reliance on any information supplied by Everest Fortune Group.

Aussie on the RiseOn the 15-minute chart, AUD/USD is getting rejected at a key support zone. Early signs suggest buyers may step in soon, with potential for a bullish push if momentum builds. Watching closely for confirmation.

AUDSUD BearishStrongly bearish albeit very slow today . We have news later but hopefully wouldnt affect outcome too much . My stop loss 20 pips

Second Chance Setup – AUDUSD Bears Ready to Smash Supports
Last time, AUDUSD didn’t push lower as expected, instead making a false breakout / FVG sweep that trapped early sellers. But now, price action has given us a much stronger bearish confirmation.
On the 1H chart:
- A Head and Shoulders pattern has formed, signaling distribution.
- Price rejected from the FVG zone and failed to hold above the 200 EMA.
- The neckline has been retested , showing commitment from sellers.
This second chance setup looks more convincing than the first because momentum is clearly shifting toward the downside. My expectation is now for AUDUSD to extend lower toward 0.6456 , with further downside targets at 0.6422 and potentially deeper if sellers remain strong.
📉 Bias – Strong Bearish
📍 Key Resistance – FVG zone & neckline area
🎯 Target Levels – 0.6456 → 0.6422 → 0.6400

AUDUSD - Short opportunity this weekWe cannot put indicators as a reference in the publications (not even the free ones, don't know the reasons of this policy), but the play here would be the following.
First condition: We wait for a 1hr cross in the red on the macd;
Second: if condition #1 is confirmed, then we switch to the 5 minute timeframe and we wait for the macd to cross back in the green on this smaller timeframe. Once that happens, we put a pending sell at the low before the small pullback. The stop loss would be above the 1 hr correction (currently around 0.653).
Needless to say that if both conditions do not occur, there is no setup.
Stay tuned

AUDUSD H4 | Bullish reversalThe Aussie (AUD/USD) is falling towards the buy entry, which is a pullback support and could bounce from this level to the upside.
Buy entry is at 0.6423, which is a pullback support.
Stop loss is at 0.6361, which acts as a swing low support that lines up with the 138.2% Fibonacci extension.
Take profit is at 0.6481, which is an overlap resistance.
High Risk Investment Warning
Trading Forex/CFDs on margin carries a high level of risk and may not be suitable for all investors. Leverage can work against you.
Stratos Markets Limited (tradu.com ):
CFDs are complex instruments and come with a high risk of losing money rapidly due to leverage. 65% of retail investor accounts lose money when trading CFDs with this provider. You should consider whether you understand how CFDs work and whether you can afford to take the high risk of losing your money.
Stratos Europe Ltd (tradu.com ):
CFDs are complex instruments and come with a high risk of losing money rapidly due to leverage. 66% of retail investor accounts lose money when trading CFDs with this provider. You should consider whether you understand how CFDs work and whether you can afford to take the high risk of losing your money.
Stratos Global LLC (tradu.com ):
Losses can exceed deposits.
Please be advised that the information presented on TradingView is provided to Tradu (‘Company’, ‘we’) by a third-party provider (‘TFA Global Pte Ltd’). Please be reminded that you are solely responsible for the trading decisions on your account. There is a very high degree of risk involved in trading. Any information and/or content is intended entirely for research, educational and informational purposes only and does not constitute investment or consultation advice or investment strategy. The information is not tailored to the investment needs of any specific person and therefore does not involve a consideration of any of the investment objectives, financial situation or needs of any viewer that may receive it. Kindly also note that past performance is not a reliable indicator of future results. Actual results may differ materially from those anticipated in forward-looking or past performance statements. We assume no liability as to the accuracy or completeness of any of the information and/or content provided herein and the Company cannot be held responsible for any omission, mistake nor for any loss or damage including without limitation to any loss of profit which may arise from reliance on any information supplied by TFA Global Pte Ltd.
The speaker(s) is neither an employee, agent nor representative of Tradu and is therefore acting independently. The opinions given are their own, constitute general market commentary, and do not constitute the opinion or advice of Tradu or any form of personal or investment advice. Tradu neither endorses nor guarantees offerings of third-party speakers, nor is Tradu responsible for the content, veracity or opinions of third-party speakers, presenters or participants.
