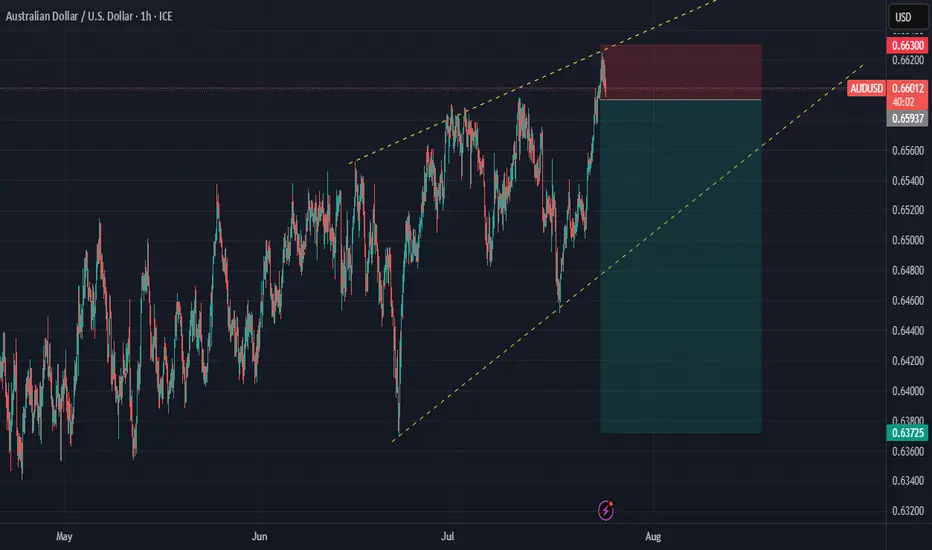
Trade ideas
AUDUSD Engineered to Drop?🧠MJTrading:
📸 Viewing Tip:
🛠️ Some layout elements may shift depending on your screen size.
🔗 View the fixed high-resolution chart here:
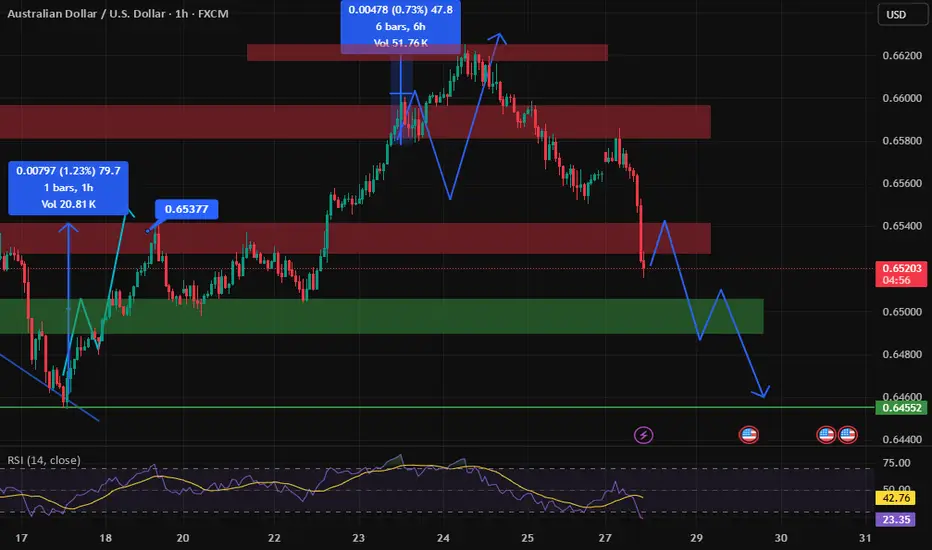
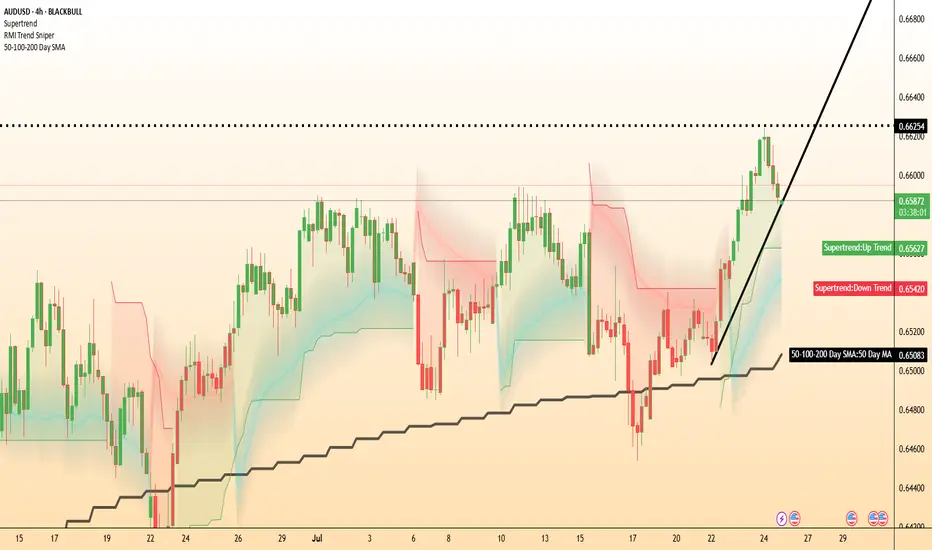
🔻 OANDA:AUDUSD – Tagged the Top | Smart Money Eyes Lower Levels??
📍 Perfect Respect of Channel Structure
AUDUSD has just kissed the upper boundary of a long-standing ascending channel, showing sharp rejection — a sign that premium pricing might now shift toward discount levels.
📈 The aggressive push into the highs likely aimed to clear buy stops — fulfilling smart money objectives before a potential reversal.
📉 And here’s the subtle clue:
Just below the last bullish candle lies a thin slide — a structural weakness.
If price breaks and closes below that full body bearish candle (Below 0.66000), the market could slip fast, unleashing a momentum-driven drop into the first liquidity zone (0.6520s).
🧠 For smart money lovers, this is the classic:
Sweep → Trap → Slide
📏 And for fans of parallelism, the chart’s geometry offers a rare beauty — lines in harmony, structure in rhythm, and opportunity in alignment.
🔍 What to Watch For:
Break below 0.66000 (last candle body) = entry signal
0.6520–0.6540: first liquidity zone
0.6400–0.6300: deeper cleanout, if bearish pressure sustains
Inset: DXY bouncing from long-term demand supports bearish thesis
Manage your risk wisely...
For Lower time frame traders:
Psychology Always Matters:
(Click on the pictures for caption and concepts)
#AUDUSD #SmartMoney #LiquiditySweep #ChannelTrading #ChartDesigner #MJTrading #PriceAction #Forex

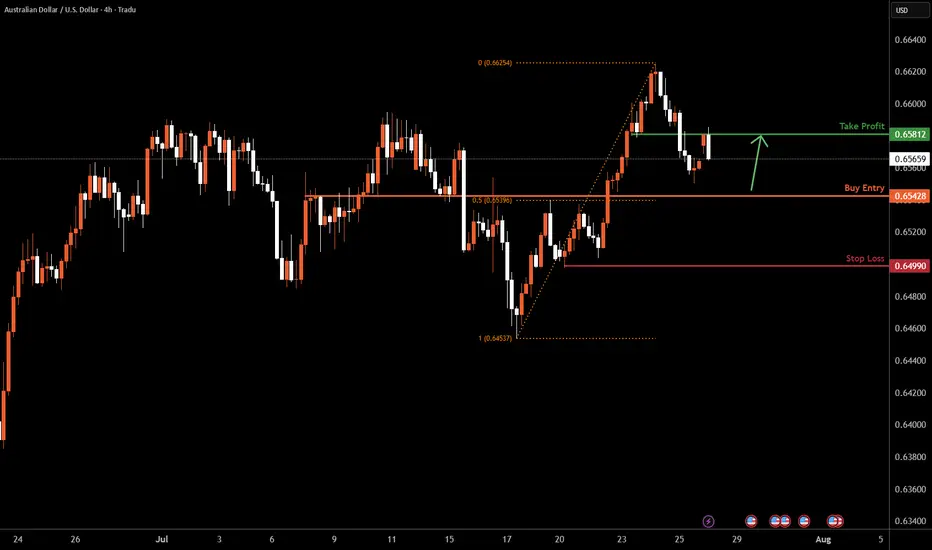
AUDUSD H4 I Bullish Bounce Off the 50% Fib Based on the H4 chart analysis, we can see that the price is falling toward our buy entry at 0.6542, which is a pullback support that aligns with the 50% Fib retracement.
Our take profit will be at 0.6581, an overlap resistance.
The stop loss will be placed at 0.6499, a swing low support.
High Risk Investment Warning
Trading Forex/CFDs on margin carries a high level of risk and may not be suitable for all investors. Leverage can work against you.
Stratos Markets Limited (tradu.com ):
CFDs are complex instruments and come with a high risk of losing money rapidly due to leverage. 66% of retail investor accounts lose money when trading CFDs with this provider. You should consider whether you understand how CFDs work and whether you can afford to take the high risk of losing your money.
Stratos Europe Ltd (tradu.com ):
CFDs are complex instruments and come with a high risk of losing money rapidly due to leverage. 66% of retail investor accounts lose money when trading CFDs with this provider. You should consider whether you understand how CFDs work and whether you can afford to take the high risk of losing your money.
Stratos Global LLC (tradu.com ):
Losses can exceed deposits.
Please be advised that the information presented on TradingView is provided to Tradu (‘Company’, ‘we’) by a third-party provider (‘TFA Global Pte Ltd’). Please be reminded that you are solely responsible for the trading decisions on your account. There is a very high degree of risk involved in trading. Any information and/or content is intended entirely for research, educational and informational purposes only and does not constitute investment or consultation advice or investment strategy. The information is not tailored to the investment needs of any specific person and therefore does not involve a consideration of any of the investment objectives, financial situation or needs of any viewer that may receive it. Kindly also note that past performance is not a reliable indicator of future results. Actual results may differ materially from those anticipated in forward-looking or past performance statements. We assume no liability as to the accuracy or completeness of any of the information and/or content provided herein and the Company cannot be held responsible for any omission, mistake nor for any loss or damage including without limitation to any loss of profit which may arise from reliance on any information supplied by TFA Global Pte Ltd.
The speaker(s) is neither an employee, agent nor representative of Tradu and is therefore acting independently. The opinions given are their own, constitute general market commentary, and do not constitute the opinion or advice of Tradu or any form of personal or investment advice. Tradu neither endorses nor guarantees offerings of third-party speakers, nor is Tradu responsible for the content, veracity or opinions of third-party speakers, presenters or participants.

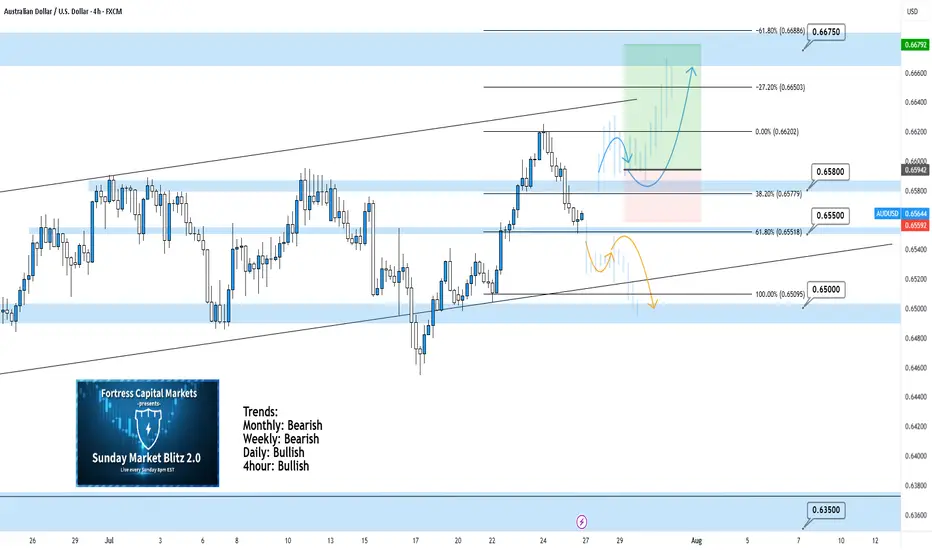
AUDUSD 4Hour TF - July 27th, 2025AUDUSD 7/27/2025
AUDUSD 4hour Bullish idea
Monthly - Bearish
Weekly - Bearish
Dailly - Bullish
4hour - Bullish
AUDUSD is holding steady in this weekly channel but has been showing signs of high volume ranging over the last month. Going into this week we’re looking mostly bullish but we have some minor zones that could slow price action down.
Here are two scenarios we are looking out for, for the week ahead:
Bullish Continuation - This is our ideal scenario as we want the trend to continue so we can have the best quality trade. For us to get comfortable going long AU we need to see structure above our 0.65800 zone. We want to see price action use this zone as support and establish structure (the next higher low).
If this happens we can look to target higher toward major resistance levels and key fib levels.
Bearish Reversal into range - If we fail to see bullish conviction at the current zone it’s possible price action will fall back into the range. This is a likely scenario as we have seen price action bounce between 0.65800 and 0.65000 multiple times over the last month.
I wouldn’t recommend trading this scenario as I don’t like trading ranges but we could see price action head lower to 0.65000.

AUDUSD TRADE SETUPWait for retest the entry level and Bullish momentum candle then take a trade for Buy otherwise skip this setup

AUDUSD looks promising for a continuationThis pair presents a potential trade opportunity in the form of a short continuation. The price did reach a significant Area of Interest (AoI) in form of an expanding 3-touch structure before turning around. Price did close outside the structure on the H4 with a candlestick reversal pattern and printed a bearish high-test candle on the daily timeframe. This clearly shows a shift in momentum and I am now waiting for a lower time frame (LTF) continuation pattern to confirm the direction and a valid candlestick pattern for entry.
📈 Simplified Trading Rules:
> Follow a Valid Sequence
> Wait for Continuation
> Confirm Entry (valid candlestick pattern)
> Know When to Exit (SL placement)
Remember, technical analysis is subjective; develop your own approach. I use this format primarily to hold myself accountable and to share my personal market views.
⚠ Ensure you have your own risk management in place and always stick to your trading plan.

AUDUSD Will Go Higher From Support! Buy!
Please, check our technical outlook for AUDUSD.
Time Frame: 12h
Current Trend: Bullish
Sentiment: Oversold (based on 7-period RSI)
Forecast: Bullish
The market is trading around a solid horizontal structure 0.656.
The above observations make me that the market will inevitably achieve 0.662 level.
P.S
We determine oversold/overbought condition with RSI indicator.
When it drops below 30 - the market is considered to be oversold.
When it bounces above 70 - the market is considered to be overbought.
Disclosure: I am part of Trade Nation's Influencer program and receive a monthly fee for using their TradingView charts in my analysis.
Like and subscribe and comment my ideas if you enjoy them!

demand and supply strategymost traders will be taking an aggressive entry from the supply down to the demand zone but for me being a patient trader, i want to see a new trend, price forming a LL before considering any sell opportunity...
if it doesnt pullback for me to enter then its fine i will sit on my hands and wait for the next opportunity...
please drop a comment...

AUD/USD Sell SetupOANDA:AUDUSD
Timeframe: m30
Entry: 0.66151
SL: 0.66266
TP1: 0.66033
TP2: 0.65914
TP4: 0.65681
📊 Setup Rationale
🔺 Channel Top Rejection (8H Overlay) Price has touched the upper boundary of a descending channel visible on the 8-hour chart. This zone has historically acted as a strong resistance, increasing the probability of a reversal.
🧱 Local Structure (30min) Entry aligns with a minor double top (in lower TFs) and bearish momentum. The tight SL allows for a high R:R profile.
🔄 Momentum Shift Watch for bearish engulfing or rejection wick on lower timeframes to confirm entry.
#MJTrading #Forex #AUDUSD #Sell
Psychology always matters:

AUDUSD.JULY 29TH
Bureau of Labor Statistics will publish will JOLTS which measures the Number of job openings during the reported month, excluding the farming industry;
JOLTS Job Openings CB Consumer Confidence forecast 95.9 previous 93.0 .market will watch for data report for clear directional bias .
wednesday 30th
Australian Bureau of Statistics will publish the Consumer price index which Measures Change in the price of goods and services purchased by consumers
'Actual' greater than 'Forecast or below will be watched for clear directional bias .
this data are Frequency Released quarterly, about 25 days after the quarter ends;
and the next report will be on Oct 30, 2025
Consumer prices account for a majority of overall inflation. Inflation is important to currency valuation because rising prices lead the central bank to raise interest rates out of respect for their inflation containment mandate of 2%
Aud CPI q/q forecast 0.8% previous 0.9%
AUD CPI y/y forecast 2.1% previous 2.1%
AUD Trimmed Mean CPI q/q forecast 0.7% previous 0.7%
USD 1:15pm
1:15pm USD ADP Non-Farm Employment Change forecast 82K previous -33K
Advance GDP q/q forecast 2.4% previous -0.5%
Advance GDP Price Index q/q forecst 2.3% previous 3.8%
Pending Home Sales m/m forecast 0.3% previous 1.8%
USD Crude Oil Inventories-3.2M
by 7pm USD Federal Funds Rate previous 4.50% 4.50%
FOMC Statement
7:30pm FOMC Press Conference.
watchout for federal fund rate data report and FOMC (federal open market committee)
NOTE;TRADING ANAY INSTRUMENT IS 100% PROBABILTY ,ANY KEY LEVEL CAN FAIL YOU,DONT EVER TRADE WITH ALL YOUR CAPITAL BECAUSE YOU MENTOR SAY BUY OR SELL.
TRADING IS 100% PROBABILTY AND NO STRATEGY IS PERFECT.
TRADE WITH CAUTION.
WISH A HAPPY NEW WEEK.
BYE.

AUD/USD - Breakout (25.07.2025)The AUD/USD Pair on the M30 timeframe presents a Potential Selling Opportunity due to a recent Formation of a Trendline Pattern. This suggests a shift in momentum towards the downside in the coming hours.
Possible Short Trade:
Entry: Consider Entering A Short Position around Trendline Of The Pattern.
Target Levels:
1st Support – 0.6551
2nd Support – 0.6513
🎁 Please hit the like button and
🎁 Leave a comment to support for My Post !
Your likes and comments are incredibly motivating and will encourage me to share more analysis with you.
Best Regards, KABHI_TA_TRADING
Thank you.
Disclosure: I am part of Trade Nation's Influencer program and receive a monthly fee for using their TradingView charts in my analysis.

AUDUSD 60/15 Pullback ShortSeeing the market shifted from bull to bear. Looking for a pullback and short.
There is strong sell above, possible to quick probe that then drop.
Monitor.

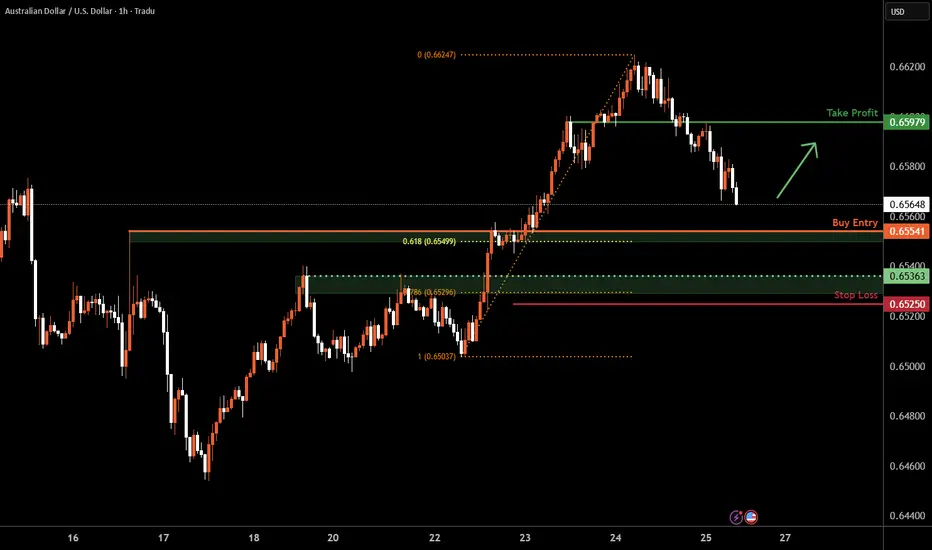
Aussie H4 | Falling toward a pullback supportThe Aussie (AUD/USD) is falling towards a pullback support and could potentially bounce off this level to climb higher.
Buy entry is at 0.6554 which is a pullback support that aligns with the 61.8% Fibonacci retracement.
Stop loss is at 0.6525 which is a level that lies underneath a pullback support and the 78.6% Fibonacci retracement.
Take profit is at 0.6597 which is a pullback resistance.
High Risk Investment Warning
Trading Forex/CFDs on margin carries a high level of risk and may not be suitable for all investors. Leverage can work against you.
Stratos Markets Limited (tradu.com ):
CFDs are complex instruments and come with a high risk of losing money rapidly due to leverage. 66% of retail investor accounts lose money when trading CFDs with this provider. You should consider whether you understand how CFDs work and whether you can afford to take the high risk of losing your money.
Stratos Europe Ltd (tradu.com ):
CFDs are complex instruments and come with a high risk of losing money rapidly due to leverage. 66% of retail investor accounts lose money when trading CFDs with this provider. You should consider whether you understand how CFDs work and whether you can afford to take the high risk of losing your money.
Stratos Global LLC (tradu.com ):
Losses can exceed deposits.
Please be advised that the information presented on TradingView is provided to Tradu (‘Company’, ‘we’) by a third-party provider (‘TFA Global Pte Ltd’). Please be reminded that you are solely responsible for the trading decisions on your account. There is a very high degree of risk involved in trading. Any information and/or content is intended entirely for research, educational and informational purposes only and does not constitute investment or consultation advice or investment strategy. The information is not tailored to the investment needs of any specific person and therefore does not involve a consideration of any of the investment objectives, financial situation or needs of any viewer that may receive it. Kindly also note that past performance is not a reliable indicator of future results. Actual results may differ materially from those anticipated in forward-looking or past performance statements. We assume no liability as to the accuracy or completeness of any of the information and/or content provided herein and the Company cannot be held responsible for any omission, mistake nor for any loss or damage including without limitation to any loss of profit which may arise from reliance on any information supplied by TFA Global Pte Ltd.
The speaker(s) is neither an employee, agent nor representative of Tradu and is therefore acting independently. The opinions given are their own, constitute general market commentary, and do not constitute the opinion or advice of Tradu or any form of personal or investment advice. Tradu neither endorses nor guarantees offerings of third-party speakers, nor is Tradu responsible for the content, veracity or opinions of third-party speakers, presenters or participants.
AUDUSD(20250725)Today's AnalysisMarket news:
The European Central Bank announced that it would maintain the three key interest rates unchanged, reiterated data dependence, warned that the external environment is highly uncertain, and President Lagarde did not rule out the possibility of future rate hikes. Traders reduced their bets on ECB rate cuts.
Technical analysis:
Today's buying and selling boundaries:
0.6598
Support and resistance levels:
0.6638
0.6623
0.6613
0.6583
0.6573
0.6559
Trading strategy:
If the price breaks through 0.6598, consider buying in, with the first target price of 0.6613
If the price breaks through 0.6583, consider selling in, with the first target price of 0.6573

AUD/USD tests uptrend as Trump targets Powell at Fed siteThe US dollar is trading mixed after President Trump made a rare appearance at the Federal Reserve’s renovation site, in an attempt to distract from you know what.
While the visit had no formal policy announcements, Trump did try to further undermine Chair Jerome Powell by erroneously claiming the renovation cost had blown out to 3.1 billion by adding the cost of a building finished 5 years ago.
Meanwhile, AUD/USD could be of the most interest. Traders might like to watch to see if it can hold its uptrend after its downside breakout from yesterday. AUD/USD remains potentially supported above its 50-DMA, with momentum pointing to potential further upside beyond 0.6625.
7.24 AUD/USD ADDED TO WATCHLIST👀 AUD/USD – Watchlist Setup (VMS Strategy)
Monitoring AUD/USD for a confirmed pullback into the marked S/R zone.
What we need to see next:
✅ A clean engulfing candle trigger
✅ Volume and momentum aligned in the trade direction
✅ Entry near the 50EMA, following full VMS criteria
📌 No predictions—just preparation. The setup either fits or it doesn’t.
Keep watching.

AUDUSD Bullish Breakout!
HI,Traders !
#AUDUSD is trading in a strong
Uptrend and the price made a
Bullish breakout of the key
Horizontal level of 0.65829
So we are bullish biased
And we will be expecting a
Further bullish move up !
Comment and subscribe to help us grow !

AUD/USD Bulls Eye BreakoutThe Australian Dollar surged more than 1.8% this week with AUD/USD now testing multi-month uptrend resistance at fresh yearly highs. A four-day rally takes price into confluent resistance at the September low / upper parallel at 6622- The focus is on today’s close with the immediate advance vulnerable while below this key slope. Subsequent resistance objectives eyed at the 2019 low at 6671 and the 78.6% retracement of the broader 2024 decline at 6723.
Initial support rests with the July open at 6581 and is backed by the May high-day close (HDC) / weekly open at 6486-6506. Losses would need to be limited to this region for the late-June advance to remain viable (near-term bullish invalidation). Subsequent support seen at the June low-day close (LDC) at 6458 with a break below 6350 ultimately needed to suggest a more significant high is in place / larger reversal is underway.
Bottom line: A breakout of the July opening-range takes AUD/USD into confluent uptrend resistance- risk for topside exhaustion / price inflection here. From a trading standpoint, a good zone to reduce portions of long-exposure / raise protective stops – losses shudl be limited to 6486 IF price is heading higher on this stretch with a close above this slope needed to fuel the next leg of the advance.
Keep in mind the FOMC interest rate decision is on tap next week with Core Personal Consumption Expenditures (PCE) and Non-Farm Payrolls (NFPs) slated into the monthly cross. Stay nimble into the releases and watch the weekly closes here.
-MB

SELL AUDUSD IF DAILY CANDLE ENDS AS BEARISH ON IDC(THIS CHART)sell AUDUSD and buy USDCAD as the dollar is gaining strength
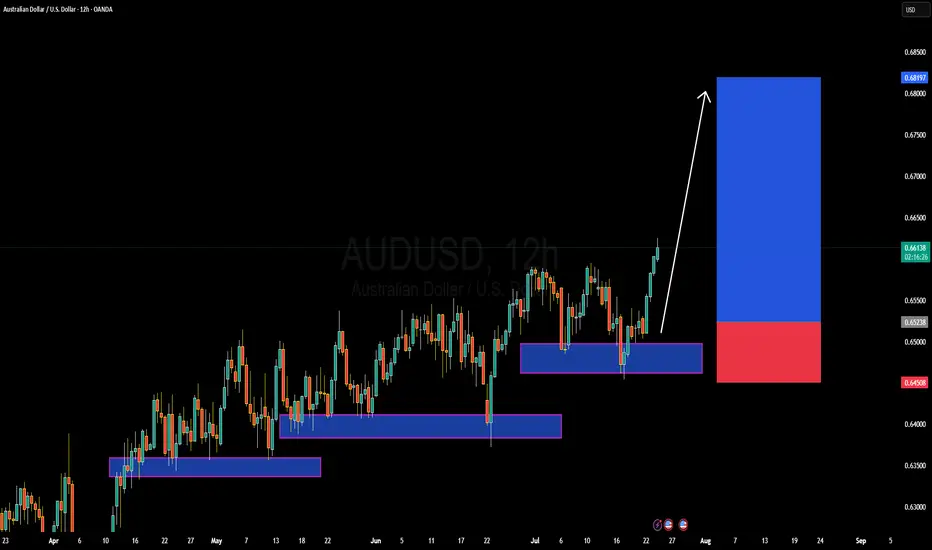
AUDUSD Forming Strong Bullish MomentumAUDUSD is currently showing strong bullish momentum, confirming a key breakout from recent consolidation. After multiple rejections at support zones, price action has now surged through previous resistance levels around 0.6600, signaling a bullish trend continuation. As seen on the 12H chart, the pair is respecting a series of higher lows and forming a clean ascending structure, with a fresh impulse wave now aiming toward the 0.6800–0.6820 target zone.
On the fundamental front, the Australian dollar is gaining strength as recent macro data supports a more optimistic economic outlook. Australia’s labor market remains tight, and inflation prints have come in hotter than expected, increasing speculation that the RBA may maintain a hawkish tone. Meanwhile, the US dollar is under pressure as markets continue to price in a potential Fed rate cut in the coming months, especially amid signs of slowing economic momentum and easing CPI. This divergence is helping AUDUSD push higher.
Technically, buyers are clearly in control. Each dip into demand zones has been aggressively bought, and the current price action confirms continuation. The recent break above 0.6600 is a significant technical development, and as long as price holds above the 0.6520–0.6500 support zone, I expect the pair to grind higher toward 0.6819 and beyond. Risk-reward remains favorable for buyers with a clear bullish structure intact.
With strong bullish confluence both fundamentally and technically, AUDUSD offers a high-probability long opportunity. I’ll be looking for continuation setups on lower timeframes while managing risk below key support. The trend is your friend here—stay with the bulls as the market positions ahead of upcoming US economic releases.
AUDUSDafter trap sellers came in range again on mtf. it show bull strength and a liquidity sweep on seller side. we can see a good movemntum on the upside.
make your own analysis before taking trade.
