AUDUSD POSSIBLE SELL SETUP🧭 Market Structure Overview
Current price: around 0.6547
The chart shows a bearish structure shift — after price reached a high near 0.6560–0.6565, it created:
A Break of Structure (BOS) to the downside.
A Change of Character (CHoCH) confirming a transition from bullish to bearish momentum.
🧱 Key Supply and Demand Zones
Supply zone (short entry area):
Marked in red around 0.6550–0.6560
This is where sellers previously entered and broke structure — potential retest zone for short entry.
Demand zones (targets):
Minor demand: around 0.6530–0.6535
Major demand / final target: near 0.6515–0.6510
📉 Trade Plan (Sell Setup)
Bias: Bearish
Entry zone (sell):
Wait for a retracement into 0.6550–0.6555 (supply zone retest)
Confirmation:
Look for lower time frame rejection (e.g. bearish engulfing, BOS down on 1–5m chart) at that zone.
Stop loss:
Above 0.6565 (just beyond the BOS high / supply zone)
Take profit targets:
TP1: 0.6535 (first demand / liquidity pocket)
TP2: 0.6515 (main target, strong demand zone)
Risk-to-reward (approx):
1:3 to 1:4, depending on entry precision
🔍 Market Logic
Price made a lower high and broke structure to the downside.
The CHoCH confirms momentum has shifted.
The liquidity above 0.6560 has been swept — institutions likely distributed there.
Expect a retracement into supply before the next impulsive leg down.
⚠️ Trade Management Tips
If price fails to reach 0.6550 and instead breaks below 0.6535 decisively, consider waiting for a pullback to 0.6540 for re-entry.
Move SL to breakeven after TP1 is hit.
Trade ideas

AUDUSD reaching important resistance at 0.6560The AUDUSD remains in a neutral trend, with recent price action indicating a potential resistance retest within the broader uptrend.
Resistance Zone: 0.6560 – a key level from previous consolidation. Price is currently testing or approaching this level.
A bearish rebound from 0.6560 would confirm ongoing downside momentum, with potential targets at:
0.6500 – initial support
0.6490 – psychological and structural level
0.64800 – extended support on the longer-term chart
Bullish Scenario:
A confirmed break and daily close above 0.6560 would weaken the bullish outlook and suggest deeper downside risk toward:
0.6576 – minor resistance
0.6590 – stronger resistance and potential supply zone
Outlook:
Neutral bias remains intact while the AUDUSD trades around the pivotal 0.6560 level. A sustained break below or above this level could shift momentum.
This communication is for informational purposes only and should not be viewed as any form of recommendation as to a particular course of action or as investment advice. It is not intended as an offer or solicitation for the purchase or sale of any financial instrument or as an official confirmation of any transaction. Opinions, estimates and assumptions expressed herein are made as of the date of this communication and are subject to change without notice. This communication has been prepared based upon information, including market prices, data and other information, believed to be reliable; however, Trade Nation does not warrant its completeness or accuracy. All market prices and market data contained in or attached to this communication are indicative and subject to change without notice.

QUICK BUY TRADE OPPORTUNITY FOR AUDUSDAUDUSD has broken a very powerful resistance level (red trendline).. and is very likely to test the next powerful resistance zone which is all the way up at 0.66600. great time to buy now (low risk high reward)

AUDUSD potential move in short term Had test of OB and trend shift on LTF, ptentially move to take buyside liqudity

AUDUSD bullish trendAUDUSD showing bullish trend. It's the breakout of a box. So, let's wait upto the retracement of 0.38. Put SL just below the bottom support line. Risk Reward ratio (1:1 and 1:2).

AUD/USD BEST PLACE TO BUY FROM|LONG
AUD/USD SIGNAL
Trade Direction: long
Entry Level: 0.649
Target Level: 0.651
Stop Loss: 0.648
RISK PROFILE
Risk level: medium
Suggested risk: 1%
Timeframe: 1h
Disclosure: I am part of Trade Nation's Influencer program and receive a monthly fee for using their TradingView charts in my analysis.
✅LIKE AND COMMENT MY IDEAS✅

AUDUSD – Monday Gap Fill Setup (Institutional Play)This week opened with a Gap Up relative to last Friday’s close (~0.65122).
A Gap Up typically suggests that price may retrace downward to fill the imbalance left behind over the weekend — as long as structure confirms the continuation move.
How the Setup Developed
1. Friday Close was marked as the Gap Fill Target.
2. At Monday open, AUDUSD opened above this level → SELL bias.
3. Early session showed a liquidity sweep (stop-hunt wick) above previous swing highs — a common institutional liquidity grab.
4. After the sweep, price broke structure to the downside (BOS).
5. The market pulled back into the BOS zone, offering a sell entry with stop loss placed above the sweep high.
6. Management rule: SL moves to break-even only after a 5-minute candle closes below the BOS trigger line (not just a wick).
Target
→ Friday Close Gap Fill (0.65122 region)
This target reflects the principle that weekend gaps tend to close due to price seeking efficiency after an imbalance.
Disclaimer:
This content is intended for educational and informational purposes only. It does not constitute investment advice, financial advice, trading advice, or any form of recommendation. Trading involves risk, and you are responsible for your own decisions.

Aussie H1 | Bearish Momentum To ExtendBased on the H1 chart analysis, we could see the price rise to the sell entry, whichis a pullback resitance that aligns with the 61.8% Fibonacci retracement and could drop from this level to the downside.
Sell entry is at 0.6502, which is a pullback resistance.
Stop loss is at 0.6532, which is a pullback resistance that is slightly below the 50% Fibonacci retracemnt.
Take profit is at 0.6446, which is a pullback support that aligns with the 78.6% Fibonacci projection.
SStratos Markets Limited (tradu.com ):
CFDs are complex instruments and come with a high risk of losing money rapidly due to leverage. 68% of retail investor accounts lose money when trading CFDs with this provider. You should consider whether you understand how CFDs work and whether you can afford to take the high risk of losing your money.
Stratos Europe Ltd (tradu.com ):
CFDs are complex instruments and come with a high risk of losing money rapidly due to leverage. 70% of retail investor accounts lose money when trading CFDs with this provider. You should consider whether you understand how CFDs work and whether you can afford to take the high risk of losing your money.


0.6600 RETEST?The 1st of August saw price break below the 0.6600 - 0.6660 zone in an impulsive move to the downside. Since then, the Aussie has traded lower proceeded by a period of choppy price action. As a trend-trader I am out of the markets once we get into sideways movement and one of the rules I follow is "Patience Is A Position". It is at the beginning of November we have started to see a shift in trend and for the first time since August, price is now back at the 0.6600 - 0.6660 zone and is currently trading just below. What I am looking for, is a swing trade and a reason to short the market from this point. To do so, I would need to see a shift in market structure on lower timeframes such as M5; M15, M30 or H1. Once the market structure on the lower timeframe comes into alignment with a higher timeframe; I execute. The set-up becomes void if price breaches the identified zone of interest by closing beyond the zone and there is no shift in market structure. This means going back to the drawing board; looking at how the market is behaving, and generating a fresh idea...or staying in the sidelines until a familiar pattern re-emerges.

AUDUSD at prior support1h close below = continuation lower. Reclaim and hold above = fakeout and bounce.
Invalidation: clean 1h close back above the zone. Not financial advice.


Risks and Limitations of ETF and Index Trading1. Market Risk: The Core Challenge
ETFs and index funds are designed to track the performance of a specific index, such as the Nifty 50, S&P 500, or NASDAQ-100. This means that if the underlying market declines, the ETF or index fund will also lose value.
Example:
During the 2020 pandemic crash, the Nifty 50 ETF lost over 35% of its value in a matter of weeks. Investors holding the ETF had no protection against this decline because ETFs are market-linked instruments.
Key takeaway:
ETFs are not immune to market downturns. While diversification helps reduce company-specific risks, systemic or market-wide risks cannot be avoided.
2. Tracking Error Risk
One of the most important limitations of ETFs and index funds is tracking error—the difference between the ETF’s performance and its benchmark index.
Causes of tracking error include:
Management fees: Even a 0.2% expense ratio can add up over time.
Dividends and cash holdings: If the ETF manager holds cash instead of being fully invested, returns will lag.
Rebalancing frequency: Delays or inefficiencies in adjusting to index changes can cause mismatches.
Transaction costs: Buying and selling underlying assets incur brokerage and spread costs.
Impact:
For instance, if the Nifty 50 gives a 10% return in a year but the ETF delivers only 9.6%, the 0.4% difference represents a tracking error.
Investor note:
While small tracking errors are normal, persistent or large deviations indicate poor fund management or structural inefficiencies.
3. Liquidity Risk
Liquidity plays a vital role in ETF and index trading. It refers to how easily you can buy or sell an ETF without significantly affecting its price.
Types of liquidity:
Primary liquidity: Based on the liquidity of the underlying securities.
Secondary liquidity: Based on the trading volume of the ETF itself.
The risk:
Some ETFs, especially thematic or sectoral ones, have low trading volumes. This means:
Wider bid-ask spreads.
Price gaps between the ETF and its net asset value (NAV).
Difficulty exiting positions during market stress.
Example:
During volatile market conditions, ETFs linked to small-cap indices or niche sectors may see spreads widen sharply, leading to losses even when the underlying index hasn’t fallen as much.
4. Counterparty Risk in Synthetic ETFs
Certain ETFs—known as synthetic ETFs—do not hold the actual securities of the index. Instead, they use derivatives (like swaps) to replicate performance. This introduces counterparty risk, meaning if the derivative provider defaults, investors may face losses.
Example:
If a European bank issues a swap-based ETF on the NASDAQ-100 and later faces financial distress, the ETF might fail to deliver accurate returns, even if the U.S. index performs well.
Lesson:
Always check whether an ETF is physical (holds real securities) or synthetic (uses swaps). Physical ETFs are generally safer for long-term investors.
5. Over-Concentration in Certain Sectors or Stocks
While ETFs offer diversification, index concentration remains a key limitation. Many indices are market-cap weighted, meaning larger companies dominate performance.
Example:
In the Nifty 50, the top five companies—Reliance Industries, HDFC Bank, ICICI Bank, Infosys, and TCS—often account for over 50% of the index weight.
So, if these few companies underperform, the entire index (and related ETFs) suffers, regardless of how other constituents perform.
Implication:
Investors mistakenly believe ETFs provide balanced diversification, but in practice, they may be overexposed to a handful of large-cap stocks or sectors, such as technology or banking.
6. Limited Upside Potential
ETFs and index funds are passive investment vehicles. They mirror the index and do not attempt to outperform it. Therefore, investors miss out on potential alpha generation that skilled active fund managers might deliver.
Scenario:
If a fund manager identifies high-growth small-cap stocks before they are included in an index, active portfolios may outperform. Meanwhile, index ETFs will only benefit once the stock becomes large enough to enter the index—by which time much of the growth may already be priced in.
Key understanding:
ETFs are ideal for steady, market-level returns, not for those seeking high, alpha-driven profits.
7. Volatility and Short-Term Fluctuations
ETFs are traded intraday, just like stocks. While this provides flexibility, it also introduces short-term volatility risk.
Risks include:
Sudden price swings during high volatility periods.
Emotional trading decisions due to frequent price visibility.
Potential divergence between ETF price and actual NAV.
Example:
During sharp market corrections, ETFs can trade temporarily below their NAV as panic selling sets in—known as price dislocation. Investors who sell at such times may lock in unnecessary losses.
8. Management and Operational Risk
Despite being “passive,” ETFs are not fully automated. They require management oversight, creation and redemption processes, and operational execution.
Any failure in these processes can harm investors.
Risks include:
Error in replication: Wrong index tracking or delayed rebalancing.
System failures: Trading halts or delayed settlements.
Custodian issues: Safekeeping errors in underlying assets.
Example:
If a fund fails to rebalance after an index change (say, replacing a stock in the Nifty 50), the ETF may not accurately reflect index performance, leading to return mismatches.
9. Currency Risk in International ETFs
When investors buy international or global ETFs (such as U.S. ETFs listed in India), currency fluctuations can significantly affect returns.
Example:
If an Indian investor buys an S&P 500 ETF and the U.S. dollar weakens against the Indian rupee, the investor’s return in INR terms will decline—even if the S&P 500 index itself rises.
Key takeaway:
Investors must consider currency hedging strategies or accept that forex volatility can amplify or reduce total returns.
10. Taxation Complexity
ETF taxation depends on the asset class—equity or debt—and the jurisdiction of the fund.
Investors often underestimate how tax treatment can affect net returns.
Example (India):
Equity ETFs: Short-term capital gains (STCG) taxed at 15%, long-term at 10% (beyond ₹1 lakh).
Debt ETFs: Taxed at slab rates, with no indexation benefit after 2023 tax law changes.
This can make debt-based ETFs less tax-efficient, particularly for short-term investors.
Lesson:
Taxation is not always straightforward, especially with international ETFs that may also face withholding taxes on dividends.
11. The Illusion of Safety and Simplicity
Many investors treat ETFs as inherently “safe” because they represent diversified indices. However, ETFs can carry hidden risks, such as:
Exposure to overheated sectors.
Dependence on market sentiment.
Herd behavior leading to bubbles.
Example:
During 2021–2022, heavy inflows into technology ETFs led to inflated valuations in the NASDAQ. When tech stocks corrected, investors faced double-digit losses despite believing ETFs were low-risk instruments.
12. Structural Risks in Leveraged and Inverse ETFs
Some ETFs use leverage (2x, 3x) or inverse strategies (profit from declines). These products are meant for short-term trading, not long-term investment.
Risks include:
Compounding effect: Over time, leveraged ETFs can diverge significantly from expected returns.
Decay in value: Rebalancing daily magnifies losses in volatile markets.
Example:
A 2x leveraged ETF on the NASDAQ might gain 20% if the index rises 10% in a day. But if the index falls 10% the next day, the ETF’s loss will exceed 20%, leading to long-term erosion even if the index later recovers.
13. Systemic and Contagion Risks
ETFs have grown to represent a large portion of total market capitalization globally. Some analysts worry that ETFs could amplify systemic risks during market stress.
How it happens:
Heavy ETF redemptions can trigger mass selling of underlying assets.
Algorithmic rebalancing can worsen volatility.
Liquidity mismatches between ETFs and underlying securities can lead to market distortions.
Example:
During the March 2020 market panic, corporate bond ETFs traded at steep discounts to their NAVs, highlighting liquidity mismatches and systemic vulnerabilities.
14. Behavioral Risks: Investor Misuse
One of the less-discussed limitations of ETFs is not structural—but behavioral. Many retail investors use ETFs incorrectly:
Overtrading due to intraday availability.
Chasing momentum during bull runs.
Ignoring long-term compounding benefits by switching ETFs frequently.
Example:
An investor repeatedly switching between sectoral ETFs (banking, IT, pharma) based on short-term news may end up losing more to timing errors than they gain from diversification.
15. Regulatory and Structural Limitations
ETFs operate under specific market regulations. Sudden rule changes or restrictions can impact trading or returns.
Examples include:
Restrictions on foreign ETFs or limits on overseas investment by Indian investors.
Changes in capital gain taxation.
Trading halts due to market circuit breakers.
Such regulatory interventions, while rare, can disrupt ETF trading or temporarily distort pricing.
16. Over-Diversification and Diluted Returns
While diversification reduces risk, too much diversification can dilute returns. Index ETFs often hold hundreds of stocks, many of which contribute little to performance.
Example:
In a broad global ETF tracking 1,000+ companies, top performers’ impact gets diluted by hundreds of underperforming or stagnant ones—resulting in “average” returns.
Conclusion:
Diversification helps stability, but excessive breadth can limit meaningful gains.
Conclusion: Balancing Opportunity with Awareness
ETFs and index trading have democratized investing, providing easy access to global markets, diversified exposure, and transparent pricing. Yet, investors must remember that “simple does not mean risk-free.”
From market and tracking errors to liquidity, counterparty, and behavioral risks, each factor can impact returns differently depending on market conditions and investor behavior.
The key to success in ETF and index investing lies in understanding these risks and managing them wisely:
Choose ETFs with high liquidity and low tracking error.
Diversify across asset classes and regions—not just within one index.
Avoid leveraged or complex ETFs unless you understand their mechanics.
Stay disciplined—ETFs reward long-term consistency, not short-term speculation.
In short, ETFs and index trading are powerful tools—but like any tool, they require knowledge, caution, and strategy to use effectively.
Investors who respect these limitations and plan accordingly can enjoy stable, sustainable returns while minimizing unnecessary risks.
Stop!Loss|Market View: AUDUSD🙌 Stop!Loss team welcomes you❗️
In this post, we're going to talk about the near-term outlook for the AUDUSD currency pair☝️
Potential trade setup:
🔔Entry level: 0.65191
💰TP: 0.64101
⛔️SL: 0.65706
"Market View" - a brief analysis of trading instruments, covering the most important aspects of the FOREX market.
👇 In the comments 👇 you can type the trading instrument you'd like to analyze, and we'll talk about it in our next posts.
💬 Description: Sell pressure remains particularly strong on the Austrian and New Zealand dollars, with these two pairs expected to see the most significant strengthening of the USD. Currently, there is an open gap near this year's POC level, and a breakout of this level (near short-term support at 0.65230) will likely trigger a downward impulse amid liquidation by buyers (their stop-loss levels).
Thanks for your support 🚀
Profits for all ✅
❗️ Updates on this idea can be found below 👇

AUDUSD ShortsAussie Dollar is currently in a strong supply area. I will not be entering now. Waiting for lower time frame confirmations to enter short term sells. Watch for change of character before getting in as price is still generally bullish. Best of luck. Manage Risk!

AUDUSD FRGNT Daily Forecast -Q4 | W44 | D30| Y25 |📅 Q4 | W44 | D30| Y25 |
📊 AUDUSD FRGNT Daily Forecast
🔍 Analysis Approach:
I’m applying Smart Money Concepts, focusing on:
Identifying Points of Interest on the Higher Time Frames (HTFs) 🕰️
Using those POIs to define a clear trading range 📐
Refining those zones on Lower Time Frames (LTFs) 🔎
Waiting for a Break of Structure (BoS) for confirmation ✅
This method allows me to stay precise, disciplined, and aligned with the market narrative, rather than chasing price.
💡 My Motto:
"Capital management, discipline, and consistency in your trading edge."
A positive risk-to-reward ratio, paired with a high win rate, is the backbone of any solid trading plan 📈🔐
⚠️ Losses?
They’re part of the mathematical game of trading 🎲
They don’t define you — they’re necessary, they happen, and we move forward 📊➡️
🙏 I appreciate you taking the time to review my Daily Forecast.
Stay sharp, stay consistent, and protect your capital
— FRNGT 🚀
OANDA:AUDUSD

AUDUSD FRGNT Daily Forecast - Q4 | W44 | D29| Y25 |📅 Q4 | W44 | D29| Y25 |
📊 AUDUSD FRGNT Daily Forecast
🔍 Analysis Approach:
I’m applying Smart Money Concepts, focusing on:
Identifying Points of Interest on the Higher Time Frames (HTFs) 🕰️
Using those POIs to define a clear trading range 📐
Refining those zones on Lower Time Frames (LTFs) 🔎
Waiting for a Break of Structure (BoS) for confirmation ✅
This method allows me to stay precise, disciplined, and aligned with the market narrative, rather than chasing price.
💡 My Motto:
"Capital management, discipline, and consistency in your trading edge."
A positive risk-to-reward ratio, paired with a high win rate, is the backbone of any solid trading plan 📈🔐
⚠️ Losses?
They’re part of the mathematical game of trading 🎲
They don’t define you — they’re necessary, they happen, and we move forward 📊➡️
🙏 I appreciate you taking the time to review my Daily Forecast.
Stay sharp, stay consistent, and protect your capital
— FRNGT 🚀
OANDA:AUDUSD

Digital Assets and Central Bank Digital Currencies (CBDCs)Introduction
The digital revolution has transformed nearly every aspect of modern life — from communication to commerce — and finance is no exception. One of the most profound shifts underway in the global financial landscape is the emergence of digital assets and Central Bank Digital Currencies (CBDCs). These innovations represent the next phase of money’s evolution, where technology and monetary policy converge to redefine how value is stored, transferred, and governed.
While digital assets like cryptocurrencies have emerged from the private sector and decentralized communities, CBDCs represent the formal entry of sovereign governments into the digital money ecosystem. Together, they are reshaping the foundations of the global financial system. This essay explores the nature, development, benefits, risks, and future implications of digital assets and CBDCs, highlighting their distinct roles and their potential to coexist in the financial architecture of the 21st century.
Understanding Digital Assets
Digital assets are electronic representations of value, ownership, or rights that are stored and transacted using digital systems, often based on blockchain or distributed ledger technology (DLT). These assets can represent various forms of value — including cryptocurrencies, security tokens, non-fungible tokens (NFTs), and stablecoins.
The key characteristics of digital assets include:
Digitization: Unlike traditional assets that require physical representation (such as cash or gold), digital assets exist purely in digital form.
Blockchain Technology: Many digital assets operate on decentralized blockchain networks, ensuring transparency, security, and immutability.
Programmability: Digital assets can include smart contracts, allowing automated execution of financial agreements without intermediaries.
Decentralization: Most cryptocurrencies operate without central authorities, relying instead on peer-to-peer verification mechanisms.
Among digital assets, Bitcoin — launched in 2009 — remains the most prominent. It introduced the idea of a decentralized currency not controlled by any government or institution. Following Bitcoin’s success, thousands of other cryptocurrencies emerged, each with unique features and purposes.
Types of Digital Assets
Digital assets can be broadly classified into several categories:
Cryptocurrencies:
Cryptocurrencies like Bitcoin (BTC) and Ethereum (ETH) function as decentralized digital money. They rely on blockchain networks to verify transactions and maintain transparency. Their value is typically determined by market supply and demand rather than by central banks.
Stablecoins:
Stablecoins are designed to minimize price volatility by being pegged to traditional assets like the U.S. dollar, gold, or a basket of currencies. Examples include Tether (USDT) and USD Coin (USDC). They bridge the gap between fiat currency stability and blockchain efficiency.
Security Tokens:
These represent ownership in real-world assets such as stocks, real estate, or bonds, but are traded digitally. Security tokens bring traditional financial instruments into the blockchain ecosystem, offering greater liquidity and accessibility.
Utility Tokens:
These grant access to specific blockchain-based platforms or services. For example, using BNB to pay for transaction fees on Binance.
Non-Fungible Tokens (NFTs):
NFTs represent unique digital items — such as art, collectibles, or intellectual property — that cannot be exchanged on a one-to-one basis like regular tokens.
Central Bank Digital Currencies (CBDCs): Concept and Design
While cryptocurrencies are decentralized and privately created, Central Bank Digital Currencies (CBDCs) are government-issued digital currencies representing a nation’s official currency in electronic form. A CBDC is essentially a digital version of fiat money — issued, regulated, and backed by a country’s central bank.
CBDCs aim to combine the efficiency and innovation of digital payment systems with the stability and trust of traditional central banking. Unlike private cryptocurrencies, CBDCs are legal tender, meaning they must be accepted for all debts, public and private, within the issuing country.
Types of CBDCs
CBDCs can be categorized into two primary forms:
Retail CBDCs:
Intended for use by the general public for everyday transactions — such as payments, savings, and remittances. They function much like digital cash.
Wholesale CBDCs:
Designed for financial institutions and interbank settlements, enhancing efficiency in large-scale payments and cross-border transfers.
Technological Architecture
CBDCs can adopt either a centralized ledger system or a distributed ledger (blockchain).
Centralized systems allow the central bank to maintain complete control over issuance and transactions.
Distributed ledger systems increase transparency and resilience but require sophisticated cybersecurity measures.
Some countries may adopt hybrid models, combining the advantages of both systems to ensure security, privacy, and efficiency.
The Rise of CBDCs: Global Landscape
CBDC development has accelerated rapidly. According to the Bank for International Settlements (BIS), over 130 countries, representing more than 95% of global GDP, are exploring or developing CBDCs.
Leading CBDC Projects
China: The Digital Yuan (e-CNY) is one of the most advanced CBDCs, currently in large-scale pilot testing across major cities.
Europe: The European Central Bank (ECB) is progressing toward launching the Digital Euro to enhance payment efficiency and sovereignty.
India: The Reserve Bank of India (RBI) introduced the e₹ (Digital Rupee) pilot program for wholesale and retail use, focusing on reducing cash dependency.
Bahamas: The Sand Dollar became the world’s first fully operational CBDC in 2020, designed to improve financial inclusion.
Nigeria: The eNaira aims to facilitate faster payments and expand access to digital financial services.
This global momentum reflects the recognition that CBDCs could transform not only domestic payments but also international trade and monetary policy transmission.
Benefits of Digital Assets and CBDCs
1. Financial Inclusion
Digital assets and CBDCs can extend financial services to the unbanked population, particularly in developing countries. With just a smartphone, individuals can access a digital wallet, enabling participation in the economy without needing a traditional bank account.
2. Efficiency and Cost Reduction
Digital currencies streamline payment systems by eliminating intermediaries, reducing transaction times, and lowering costs for both domestic and cross-border payments.
3. Transparency and Security
Blockchain technology provides immutable and traceable records of transactions, reducing fraud and enhancing trust. Governments can track illicit financial activities more effectively.
4. Monetary Policy Innovation
CBDCs offer central banks greater control over monetary policy. They can enable direct stimulus payments, programmable money for targeted spending, and more efficient interest rate transmission.
5. Enhanced Cross-Border Transactions
CBDCs and stablecoins could revolutionize global trade settlements by making cross-border payments faster, cheaper, and more transparent than traditional systems like SWIFT.
6. Reduction in Cash Handling
The digitization of money reduces the costs and logistical challenges of printing, transporting, and securing physical currency.
Challenges and Risks
Despite their potential, digital assets and CBDCs face significant hurdles:
1. Privacy Concerns
CBDCs could give governments access to vast amounts of personal financial data. Balancing transparency and individual privacy is a critical challenge.
2. Cybersecurity Risks
Digital currencies are susceptible to hacking, data breaches, and technical failures. Ensuring robust cybersecurity infrastructure is essential.
3. Financial Stability Risks
The widespread adoption of digital currencies could disrupt traditional banking systems by reducing deposits, affecting banks’ ability to lend.
4. Technological Infrastructure
Developing and maintaining secure digital ecosystems requires significant investment, especially in developing countries with limited digital infrastructure.
5. Interoperability
Without global standards, different CBDCs may not easily interact with one another, limiting their effectiveness in international trade.
6. Regulatory Uncertainty
The evolving regulatory environment for digital assets creates uncertainty for investors and institutions. Clear and consistent regulations are necessary to foster confidence.
CBDCs vs. Cryptocurrencies
While both CBDCs and cryptocurrencies exist digitally, their core philosophies diverge sharply.
Feature Cryptocurrencies CBDCs
Issuer Private or decentralized networks Central banks
Control Decentralized Centralized
Legal Tender No Yes
Volatility High Stable
Transparency Public blockchain Permissioned or restricted access
Purpose Alternative to traditional money Digital evolution of existing money
CBDCs may eventually coexist with cryptocurrencies, serving different purposes — CBDCs for stable, regulated payments and crypto assets for investment, innovation, or decentralized finance (DeFi).
Digital Assets and CBDCs: Impact on the Global Economy
The integration of digital currencies is expected to reshape global finance in several ways:
Redefining the Role of Banks:
Commercial banks might face reduced deposit bases if individuals hold CBDCs directly with central banks. This could alter the structure of credit markets and financial intermediation.
Enhancing Cross-Border Trade:
CBDCs can simplify foreign exchange and international remittances, potentially bypassing traditional intermediaries and reducing transaction times from days to seconds.
Geopolitical Influence:
Countries pioneering CBDC technology could gain strategic advantages in global finance. For example, China’s Digital Yuan could challenge the dominance of the U.S. dollar in international trade.
Acceleration of De-dollarization:
CBDCs could support the trend of de-dollarization by promoting local currency usage in international settlements, reducing dependence on the U.S. dollar.
Innovation in Financial Services:
The programmable nature of digital currencies can foster innovation in areas like automated taxation, welfare distribution, and smart contracts.
The Road Ahead: The Future of Digital Finance
The evolution toward a fully digital monetary ecosystem appears inevitable. However, achieving a balanced system that combines innovation, inclusion, and stability will require global cooperation.
Central banks, regulators, and private innovators must collaborate to establish interoperability frameworks, cybersecurity standards, and data privacy protections. Moreover, education and digital literacy will be critical to ensure equitable access to these new financial tools.
In the long run, the coexistence of digital assets, CBDCs, and traditional money will likely define a hybrid financial ecosystem — one that blends decentralization and regulation, efficiency and security, innovation and oversight.
Conclusion
Digital assets and Central Bank Digital Currencies (CBDCs) are more than technological innovations; they represent a paradigm shift in how value circulates across the globe. Digital assets, driven by decentralization and market innovation, have democratized finance and expanded access to wealth creation. Meanwhile, CBDCs offer the potential to modernize monetary systems, improve payment efficiency, and strengthen financial sovereignty.
As we move further into the digital era, the challenge lies not in choosing between these forms of money but in integrating them responsibly. The future of global finance will depend on striking the right balance between innovation and regulation, ensuring that digital currencies enhance — rather than disrupt — global financial stability. The next decade will likely witness a harmonized system where both private digital assets and public CBDCs coexist, shaping the foundation of a more inclusive, transparent, and efficient financial world.

Thoughts on the current narrative: Tuesday 28 October The overall positivity has continued, the AUD is currently the standout strong currency, thanks to US / CHINA de-escalation hopes and possibly anticipation of a high CPI print (due during the upcoming ASIAN session).
Barring a bout of JPY strength (possibly profit taking following positive rhetoric as Mr Trump visits Japan?).
The USD and JPY have remained weak following the weekly 'opening gap'.
Regarding 'opening gaps', I personally look at the chart as if it was a single candle, which generally leads to an inclination that a pullback is due sooner rather than later.
The GBP is in the douldrums thanks to fresh fiscal concerns. Combined with last week's 'soft CPI data' there is a very strong case for short GBP, particularly AUD GBP short. Although, I hasten to add that I would still 'long the GBP' as part of a 'risk on trade', if it had the most momentum at the time, such as GBP JPY long.
Currently, my view is to continue looking for 'risk on trades'. Ideally with 'at least' a cluster of 15 min swings (ideally 1hr swing), following a pullback. JPY or USD (arguably CHF) short. Vs AUD or whichever currency you favour in the moment.
Of course, there are a plethora of events to potentially change the narrative at any moment. Earnings season, FOMC, AUD CPI, BOJ. Along with the ongoing US / CHINA narrative. Thursday's European session in particular could be interesting following the FOMC, BOJ and tech earnings all reported within a few hours of each other.
Currently, considering the shutdown, I'm content with two trades per week. It's pleasingly surprising that although I've only placed one trade so far, I am thinking that I could have placed three. (2x risk on, 1x GBP)
AUDUSD rising wedge short AUDUSD is making a rising wedge which is going to move downward and give us good reward.
Short scenario

#AUDUSDDate: 28-10-2025
#AUDUSD
Current Price: $0.65530
Pivot Point: $0.65421 Support: $0.64396 Resistance: $0.66453
Upside Targets:
--------------------------------
| Target | Price |
---------------------------------
| 🎯 Target 1 | $0.67339 |
| 🎯 Target 2 | $0.68225 |
| 🎯 Target 3 | $0.69277 |
| 🎯 Target 4 | $0.70328 |
Downside Targets:
| 🎯 Target 1 | $0.63507 |
| 🎯 Target 2 | $0.62617 |
| 🎯 Target 3 | $0.61566 |
| 🎯 Target 4 | $0.60514 |
#Tradingview

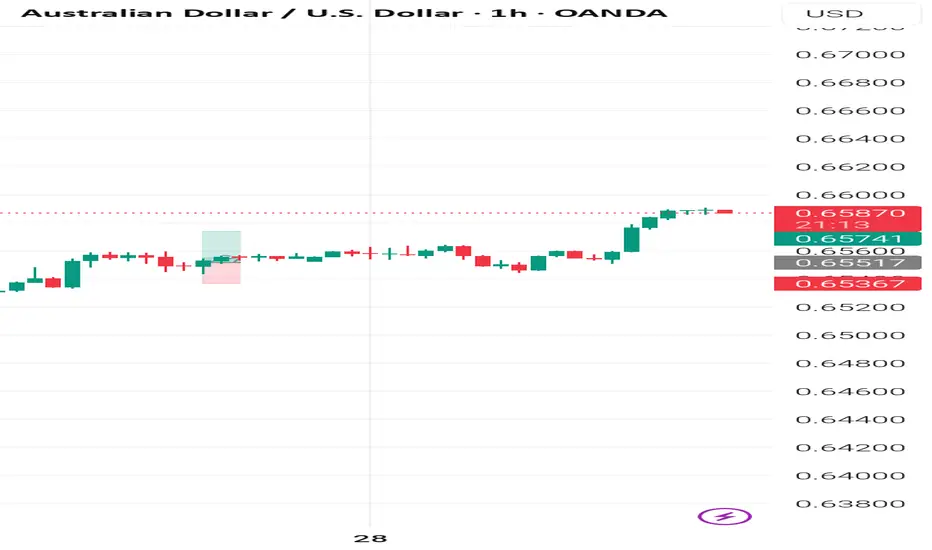
AUD/USD Analysis: Upward Momentum Amid USD Weakness?The AUD/USD pair has shown upward momentum today, trading at around 0.6522 after opening at 0.6487, marking a gain of about 0.54%. This follows a rebound from recent lows near 0.6440, supported by a dovish tone from the Federal Reserve that has pressured the US dollar, alongside resilient commodity prices boosting the Australian dollar.
Key technical levels include support around 0.6480-0.6500, where the pair has found buying interest, and resistance near 0.6535-0.6600, which could cap further advances if tested.
Fundamental drivers include ongoing US-China trade tensions, which introduce downside risks for the AUD due to Australia's economic ties to China, though softer US data and potential rate cut expectations have offset some pressure. No major high-impact economic releases are flagged for today, leaving market focus on broader sentiment and upcoming Australian employment figures later in the week.
From a technical perspective, indicators like RSI point to buy signals with the pair recovering from oversold conditions, and a bullish hammer pattern suggests potential for continued gains if it holds above the 200-day SMA. However, some views highlight bearish risks if it breaks below 0.6439, targeting lower supports.
Market sentiment leans positive for the session, with recovery noted in real-time discussions and a grind higher amid USD weakness. Expect the direction to remain upward unless fresh negative catalysts emerge, with a bias toward testing higher levels like 0.6535.
