AUDUSD My Opinion! SELL!
My dear followers,
This is my opinion on the AUDUSD next move:
The asset is approaching an important pivot point 0.6538
Bias - Bearish
Technical Indicators: Supper Trend generates a clear short signal while Pivot Point HL is currently determining the overall Bearish trend of the market.
Goal - 0.6510
About Used Indicators:
For more efficient signals, super-trend is used in combination with other indicators like Pivot Points.
Disclosure: I am part of Trade Nation's Influencer program and receive a monthly fee for using their TradingView charts in my analysis.
———————————
WISH YOU ALL LUCK
Trade ideas

AUDUSD FRGNT Daily Forecast -Q4 | W44 | D27| Y25 | GAP FILL !📅 Q4 | W44 | D27| Y25 |
📊 AUDUSD FRGNT Daily Forecast
🔍 Analysis Approach:
I’m applying Smart Money Concepts, focusing on:
Identifying Points of Interest on the Higher Time Frames (HTFs) 🕰️
Using those POIs to define a clear trading range 📐
Refining those zones on Lower Time Frames (LTFs) 🔎
Waiting for a Break of Structure (BoS) for confirmation ✅
This method allows me to stay precise, disciplined, and aligned with the market narrative, rather than chasing price.
💡 My Motto:
"Capital management, discipline, and consistency in your trading edge."
A positive risk-to-reward ratio, paired with a high win rate, is the backbone of any solid trading plan 📈🔐
⚠️ Losses?
They’re part of the mathematical game of trading 🎲
They don’t define you — they’re necessary, they happen, and we move forward 📊➡️
🙏 I appreciate you taking the time to review my Daily Forecast.
Stay sharp, stay consistent, and protect your capital
— FRNGT 🚀
OANDA:AUDUSD

Bearish reversal off major resistance?The Aussie (AUD/USD) is rising towards the pivot, which has been identified as an overlap resistance that aligns with the 38.2% Fibonacci retracement and oculd reverse to the 1st support, which acts as a multi swing low support.
Pivot: 0.6545
1st Support: 0.6422
1st Resistance: 0.6628
Disclaimer:
The above opinions given constitute general market commentary, and do not constitute the opinion or advice of IC Markets or any form of personal or investment advice.
Any opinions, news, research, analyses, prices, other information, or links to third-party sites contained on this website are provided on an "as-is" basis, are intended only to be informative, is not an advice nor a recommendation, nor research, or a record of our trading prices, or an offer of, or solicitation for a transaction in any financial instrument and thus should not be treated as such. The information provided does not involve any specific investment objectives, financial situation and needs of any specific person who may receive it. Please be aware, that past performance is not a reliable indicator of future performance and/or results. Past Performance or Forward-looking scenarios based upon the reasonable beliefs of the third-party provider are not a guarantee of future performance. Actual results may differ materially from those anticipated in forward-looking or past performance statements. IC Markets makes no representation or warranty and assumes no liability as to the accuracy or completeness of the information provided, nor any loss arising from any investment based on a recommendation, forecast or any information supplied by any third-party.

Potential bullish bounce?AUD/USD has bounced off the support level, which serves as a pullback support and could rise from this level to our take-profit target.
Entry: 0.6500
Why we like it:
There is a pullback support level.
Stop loss: 0.6481
Why we like it:
There is a pullback support level.
Take profit: 0.6542
Why we like it:
There is a pullback resistance level.
Enjoying your TradingView experience? Review us!
Please be advised that the information presented on TradingView is provided to Vantage (‘Vantage Global Limited’, ‘we’) by a third-party provider (‘Everest Fortune Group’). Please be reminded that you are solely responsible for the trading decisions on your account. There is a very high degree of risk involved in trading. Any information and/or content is intended entirely for research, educational and informational purposes only and does not constitute investment or consultation advice or investment strategy. The information is not tailored to the investment needs of any specific person and therefore does not involve a consideration of any of the investment objectives, financial situation or needs of any viewer that may receive it. Kindly also note that past performance is not a reliable indicator of future results. Actual results may differ materially from those anticipated in forward-looking or past performance statements. We assume no liability as to the accuracy or completeness of any of the information and/or content provided herein and the Company cannot be held responsible for any omission, mistake nor for any loss or damage including without limitation to any loss of profit which may arise from reliance on any information supplied by Everest Fortune Group.

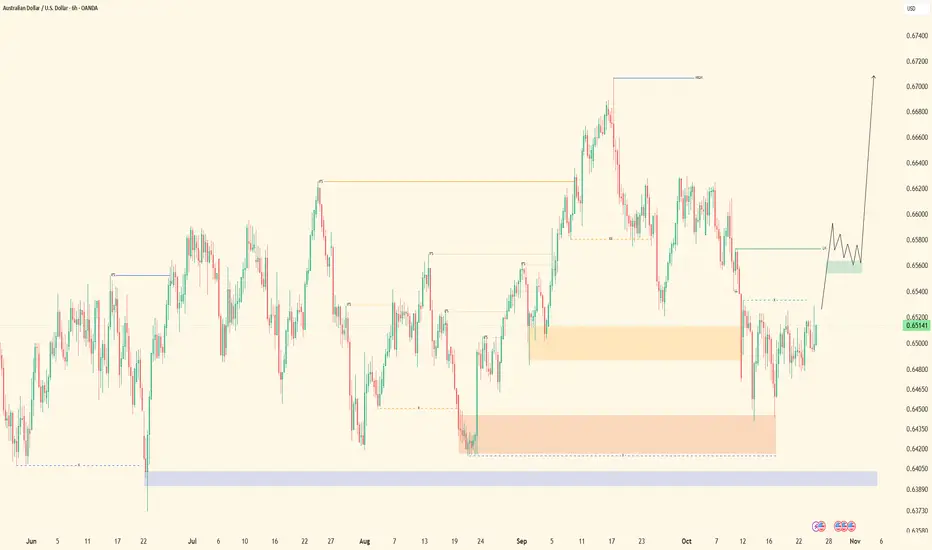
AUDUSD| Bullish Range Intact-Refining Structure for Continuation
Price remains in a bullish uptrend, continuing to respect higher timeframe structure from previous weeks. The market is still operating within its higher timeframe range, and current momentum shows intent for continuation to the upside.
Dropping into mid and lower timeframes, we’ve refined structure and identified order blocks within discounted areas. Both the lighter and darker orange zones represent key mitigation areas where price has already shown reaction and respect.
From those zones, we’re now seeking lower timeframe confirmations to align with bullish continuation. On the chart, price is currently climbing toward a lower high, which serves as our next short-term target.
Once that lower high is taken, we’ll anticipate a pullback into the discounted range for deeper mitigation opportunities — that’s where we’ll be looking for our next long entries within the bullish leg.
Until then, it’s all about alignment and patience — following price, following smart money, and letting the structure unfold. Execution will come once delivery confirms it.
Let’s go. 🔥
AUDUSD Technical & Order Flow AnalysisOur analysis is based on a multi-timeframe top-down approach and fundamental analysis.
Based on our assessment, the price is expected to return to the monthly level.
DISCLAIMER: This analysis may change at any time without notice and is solely intended to assist traders in making independent investment decisions. Please note that this is a prediction, and I have no obligation to act on it, nor should you.
Please support our analysis with a boost or comment!

MASTERCLASS: INTRADAY & SWING TRADE AUDUSD 🦘 AUDUSD (0.66112) - COMPREHENSIVE TECHNICAL MASTERCLASS: INTRADAY & SWING TRADE BLUEPRINT 🦘
October 27-31, 2025 | Advanced Multi-Timeframe Trading Forecast
🎯 MARKET OVERVIEW & ANALYSIS SCOPE 🎯
Current Spot Price: 0.66112 | Analysis Date: Oct 25, 2025 | Timeframes: 5M-1D Complete Spectrum | Trading Style: Intraday Scalp + Swing Trade | Conviction: Medium-High
━━━━━━━━━━━━━━━━━━━━━━━━━━━━━━━━━
📊 1. MULTI-TIMEFRAME TREND STRUCTURE & DOW THEORY VALIDATION 📊
🔍 Daily (1D) Timeframe - Primary Market Direction
The 1D chart exhibits mixed consolidation with bearish undertone . Dow Theory framework shows LOWER HIGHS pattern emerging (0.6640 → 0.6620 → 0.6615), signaling potential downtrend initiation. Elliott Wave structure suggests completion of 5-wave impulse (up) targeting reversal near 0.6580-0.6600 levels. RSI reading 48-52 (neutral zone, showing weakness as bearish bias forms). VWAP at 0.6605 acting as temporary support with breach implications downward.
⏰ 4H Timeframe - Swing Trade Risk Structure
Four-hourly demonstrates bearish flag formation with downside target potential . Price consolidating below 0.6625 resistance after failed breakout attempts. Bollinger Bands tightening (squeeze pattern)—volatility expansion imminent. RSI declining from 55 to 48 range (bearish momentum deterioration). Ichimoku Cloud configuration: price trapped between Kijun-sen (resistance) & Senkou Span B (dynamic support)—indecision zone. Downside target: 0.6580-0.6560.
🔥 1H to 5M Intraday Setup - Micro Timeframe Dynamics
One-hour shows head-and-shoulders pattern developing with neckline at 0.6610. Left shoulder complete (0.6625), head forming (0.6620), right shoulder declining (0.6618). Harmonic pattern: Bearish Bat identified at 0.6595 (D-point) suggesting short entry opportunity. 30M timeframe displays EMA50 crossing below EMA200 (bearish crossover just initiated). Volume declining on attempted rallies = selling pressure dominance. 5M shows bear trap formation near 0.6625—trapping bullish retailers before reversal.
━━━━━━━━━━━━━━━━━━━━━━━━━━━━━━━━━
🎯 2. ENTRY & EXIT PROTOCOL + WYCKOFF DISTRIBUTION PHASE 🎯
SWING TRADE SHORT ENTRIES (4H/1D): Sell breakdown below 0.6610 (H&S neckline) with stop @ 0.6635 (Risk:Reward 1:3 minimum). Wyckoff Distribution phase activated—institutional selling pressure accumulating. Target: 0.6560-0.6540 (swing trade 3-5 days hold).
INTRADAY SHORT SCALPS (5M/15M/30M): Multiple entry opportunities: (1) Head-and-shoulders neckline break = 0.6610 entry | (2) Bearish Bat PRZ completion = 0.6595-0.6590 aggressive short | (3) EMA crossover rejection on 30M = 0.6615-0.6620 pullback short entry.
PRIMARY PROFIT TARGETS: 1D: 0.6560 | 4H: 0.6575 | 1H: 0.6600 | 30M: 0.6610 (quick 15-20 pip scalp gains) | Extended: 0.6540 (major support level).
STOP LOSS PLACEMENT STRATEGY: Swing shorts: 0.6640 (above H&S left shoulder) | Intraday: 0.6625 (tight 15-20 pip stops) | Trail stops below Bollinger Band upper band as price descends.
💡 Pro Trading Tip: Use Ichimoku Kijun-sen (26-period) as dynamic resistance/stop level. Lock profits at each support zone identified via Gann angles.
━━━━━━━━━━━━━━━━━━━━━━━━━━━━━━━━━
⚡ 3. REVERSAL SIGNALS & JAPANESE CANDLESTICK PATTERN ANALYSIS ⚡
✅ BEARISH REVERSAL CONFIRMATIONS:
Engulfing pattern visible on 30M chart—red candle engulfing previous green (seller dominance confirmed). Shooting star candlestick near 0.6625 (failed rally rejection). Dark cloud cover pattern on 1H signals seller takeover at highs. Head-and-shoulders neckline (0.6610) acts as critical reversal zone. Ichimoku Chikou Span trading BELOW price action = confirmed bearish structure. Stochastic showing bearish divergence (lower highs on RSI/price higher highs).
⛔ BULLISH REVERSAL WARNINGS & BULL TRAP IDENTIFICATION:
Bull trap currently IN PROGRESS near 0.6625 resistance—retailers buying resistance, institutions distributing. If price breaks above 0.6630 with declining volume, false breakout confirmed. Morning Star pattern absent—no reversal higher probability. VWAP rejection combined with closing below 0.6610 = strong bearish confirmation. Gann resistance at 0.6640 acts as major distribution zone where selling accelerates.
⚠️ CRITICAL LEVEL: 0.6610 (H&S neckline) = REVERSAL THRESHOLD. Break below = Bearish Continuation | Hold above with volume = Bull trap intact
━━━━━━━━━━━━━━━━━━━━━━━━━━━━━━━━━
🔴 4. BREAKDOWN DYNAMICS & BEARISH PATTERN FORMATIONS 🔴
✅ PRIMARY BEARISH BREAKDOWN SCENARIO (65% PROBABILITY):
Head-and-shoulders breakdown below 0.6610 neckline on 1H timeframe with volume confirmation (need 20%+ volume spike below average). Elliott Wave target: 0.6540-0.6500 (5th wave decline in new downtrend cycle). Bollinger Band lower band at 0.6560 = natural extension target. Measured move from pattern: H&S height (0.6625-0.6610 = 15 pips) projected downward = 0.6595 target.
🔷 HARMONIC PATTERN PRECISION DOWNSIDE TARGETS:
Bearish Bat pattern (XA:BC 0.618) D-point entry: 0.6595 with target 0.6540 (161.8% extension downward). Bearish Butterfly on 4H suggesting potential extended move to 0.6480 (extreme scenario). Crab pattern confluence identifies 0.6570 as intermediate support-bounce zone.
⚠️ BULLISH PATTERN - FALLING WEDGE (BULL TRAP) (35% PROBABILITY):
If price holds above 0.6610, 4H chart displays falling wedge formation that could breakout bullishly to 0.6650+. Stochastic confluence on 1H indicates potential bounce setup. However, volume analysis suggests limited upside conviction. Bear trap possible if institutions accumulate after distribution climax. Watch for climactic volume spike—wedge collapse likely either direction.
━━━━━━━━━━━━━━━━━━━━━━━━━━━━━━━━━
📉 5. VOLATILITY METRICS & PRICE ACTION COMPRESSION 📉
🌊 Bollinger Bands - Critical Squeeze Signal:
Band width compressing to 180 pips on 1D (lowest in 12 days)—explosive volatility breakout imminent within 36-48 hours. Intraday Bollinger Bands (5M/15M/30M) showing initial expansion toward lower band—bearish volatility thesis strengthening. Price approaching lower Bollinger Band (0.6580) = oversold setup potential or trend continuation signal depending on volume.
📍 SUPPORT & RESISTANCE ARCHITECTURE:
MAJOR RESISTANCE ZONES: 0.6630 (Bull trap distribution level) | 0.6625 (Recent swing high) | 0.6640 (Gann angle resistance) | 0.6650 (Weekly pivot)
CRITICAL SUPPORT LEVELS: 0.6610 (H&S neckline/VWAP area) | 0.6595 (Harmonic D-point) | 0.6575 (4H support) | 0.6560 (Bollinger lower band) | 0.6540 (Major support)
VWAP PROFILE: Daily VWAP: 0.6605 (trending downward) | Weekly VWAP: 0.6615 (secondary resistance)
📊 Moving Average Divergence - Bearish Alignment:
EMA 50 below EMA 200 on 1H/4H (bearish structure forming). SMA 20 crossing below SMA 50 on 30M = momentum deterioration signal. 5M chart: EMA50 recently crossed below EMA200—intraday downtrend initiation confirmed. Price trading BELOW all major moving averages = weakness confirmed. Wyckoff Distribution phase in progress—institutional selling continuing.
🎯 OVERBOUGHT/OVERSOLD CONDITIONS & MOMENTUM EXHAUSTION:
RSI Status: 48-52 range (neutral sliding toward oversold)—RSI approaching 40 = potential for capitulation move lower. Stochastic on 15M: Declining from 55 toward 30 zone = bearish momentum acceleration. Ichimoku RSI below midline transitioning lower—downside potential significant. CCI on 5M declining below zero (strong bearish momentum without extreme oversold exhaustion). Fast Stochastic declining toward 20 level—room for extended downside run.
━━━━━━━━━━━━━━━━━━━━━━━━━━━━━━━━━
🎓 6. ADVANCED TECHNICAL THEORY INTEGRATION & FRAMEWORKS 🎓
⭐ ELLIOTT WAVE STRUCTURE: 5-wave impulse (up) completed near 0.6625 | Wave A (down) declining toward 0.6595-0.6540 | Correction target: 50% retracement = 0.6575 | Extended target: 161.8% extension = 0.6480 maximum (9-12 trading days)
⭐ GANN THEORY APPLICATION: 45-degree angle resistance @ 0.6640 (broken support becomes resistance) | Square of Nine support @ 0.6540 | Time-Price intersection: 6-8 trading days for major swing completion | Gann fan support @ 0.6560
⭐ WYCKOFF METHODOLOGY - DISTRIBUTION PHASE: Spring pattern failed (no spring reversal) = Distribution confirmation | Markup phase ended, Distribution phase INITIATED | Test & Decline pattern active = institutional distribution continuing | Expected breakdown: 0.6595-0.6540 over 5-7 trading days | Climax alert: Watch for volume spike + wide range candle = distribution completion
⭐ DOW THEORY BEARISH CONFIRMATION: Lower highs: 0.6640 → 0.6625 → 0.6620 | Lower lows: 0.6590 → 0.6585 | Volume declining on rallies = downtrend validation | Trend now firmly bearish-biased
━━━━━━━━━━━━━━━━━━━━━━━━━━━━━━━━━
✨ COMPLETE TRADING ACTION PLAN ✨
🔴 PRIMARY BEARISH SCENARIO (65% Probability):
Entry Zone: 0.6610 (H&S breakdown) or 0.6615-0.6620 (pullback short)
Stop Loss: 0.6640 | Target 1: 0.6595 | Target 2: 0.6575 | Target 3: 0.6560
Risk/Reward: 1:3+ | Hold Duration: Swing (3-5 days) + Intraday scalp (1-3 hours)
Conviction Level: 65% | Setup Quality: Premium Bearish | Volume: Confirming
🟢 SECONDARY BULLISH SCENARIO (35% Probability - Contingency):
Trigger: Hold above 0.6625 + Stochastic bounce + Volume expansion upward
Entry: 0.6630 long | Stop: 0.6610 | Target: 0.6650 (bounce setup only)
Probability: 35% (Lower conviction bull trap risk) | Pattern: Falling wedge breakout
⏱️ TIMEFRAME STRATEGY HIERARCHY: 1D (macro structure) + 4H (swing foundation) + 1H (entry confirmation) + 15M/5M (execution precision)
💰 POSITION SIZING & RISK RULES: Risk max 1-2% portfolio per trade | Scale shorts on 50% pullbacks toward 0.6625 | Trail stops above Bollinger upper band
🔔 PRICE ALERT SYSTEM: Sell signal @ 0.6610 (neckline break) | Stop loss alarm @ 0.6640 | Take profit 1 @ 0.6595 | Full target @ 0.6560 | Extended @ 0.6540
📱 EXECUTION BLUEPRINT: Aggressive breakdown entries (30% position) + Patient pullback shorts (70% position) = risk-balanced approach | Scale out profits at each support zone
⚠️ RISK MANAGEMENT: Bull trap alert at 0.6625-0.6630 | Volume confirmation mandatory on entry | Trail stops religiously | Close to breakeven if volume fails
━━━━━━━━━━━━━━━━━━━━━━━━━━━━━━━━━
⚖️ COMPLIANCE DISCLAIMER: This analysis provided for educational & information purposes ONLY. NOT financial/investment advice. All trading carries substantial risk of loss. Trade only with capital you can afford to lose. Always implement proper risk management. Consult qualified financial advisors before trading. Past performance ≠ future results. Markets unpredictable.

Exotic Options and Structured Products: A Comprehensive Overview1. Introduction
In modern financial markets, investors constantly seek instruments that offer tailored risk–return profiles beyond what standard securities provide. Traditional options and bonds often fail to address specific investor objectives such as capital protection, leveraged exposure, or conditional payoffs. This gap has been bridged by the development of exotic options and structured products — innovative financial instruments engineered to meet diverse investment and hedging needs.
Exotic options are complex derivatives whose payoffs depend on more sophisticated conditions than standard (“plain vanilla”) options. Structured products, on the other hand, are investment vehicles that combine traditional instruments such as bonds or equities with derivatives — often exotic ones — to produce customized returns. Together, they represent the cutting edge of financial engineering, where mathematics, creativity, and market insight intersect.
2. Understanding Exotic Options
Definition
An exotic option is a type of derivative whose structure differs from standard call or put options. While vanilla options derive value solely from the price of an underlying asset at expiration, exotic options may depend on the path of the asset’s price, multiple underlying assets, or certain conditions during the life of the contract.
Exotic options are widely used in corporate risk management, structured finance, and institutional investment strategies because they allow participants to tailor their exposure to specific market scenarios.
3. Types of Exotic Options
There are numerous forms of exotic options, each designed to serve a unique purpose. Below are the main categories:
a. Barrier Options
Barrier options activate or deactivate when the underlying asset’s price crosses a predetermined level (the barrier).
Knock-In Option – Becomes active only if the asset price reaches a specified barrier.
Knock-Out Option – Becomes worthless if the asset price touches a barrier level.
These options are cheaper than vanilla options because the payoff is conditional. For example, a down-and-out call provides protection as long as the price does not fall below a barrier.
b. Asian Options
Also known as average options, these depend on the average price of the underlying asset during a specified period rather than its final price. This reduces exposure to short-term volatility and is often used in commodities or currency markets.
c. Lookback Options
The payoff is based on the maximum or minimum price of the underlying asset during the option’s life. For instance, a lookback call allows the holder to “look back” and choose the lowest price to buy, making it extremely valuable but expensive.
d. Digital (Binary) Options
These options have a fixed payout — either a set amount if the condition is met, or nothing if not. For example, a digital call pays a fixed amount if the asset ends above a strike price. They are often used in speculative or short-term trading strategies.
e. Compound Options
Also called “options on options,” these give the right to buy or sell another option. They are commonly used in corporate financing where uncertainty about future needs justifies layered optionality.
f. Basket and Rainbow Options
These depend on multiple underlying assets, such as a basket of stocks or currencies. A rainbow option might pay based on the best or worst performer among several assets, allowing diversification or correlation plays.
g. Cliquet (Ratchet) Options
These are series of at-the-money options that “lock in” gains periodically. They are popular in structured deposits and capital-protected notes, providing regular profit capture while preserving downside protection.
h. Bermudan Options
These are hybrids between American and European options — they can be exercised only on specific dates before expiration, balancing flexibility and cost.
4. Pricing and Valuation of Exotic Options
Valuing exotic options is significantly more complex than pricing vanilla options. The Black-Scholes model, which works for simple options, must often be extended or replaced by numerical methods.
a. Analytical and Numerical Models
Monte Carlo Simulation – Estimates the option’s value by simulating thousands of random price paths. Useful for path-dependent options like Asians or lookbacks.
Finite Difference Methods – Solve partial differential equations derived from option pricing models.
Binomial and Trinomial Trees – Used for options with discrete events (e.g., barriers or early exercise).
Local and Stochastic Volatility Models – Incorporate changing volatility patterns over time, improving accuracy for complex instruments.
b. Inputs and Sensitivities
Key variables include:
Spot price and strike price
Volatility (often implied)
Risk-free interest rate
Time to maturity
Dividend yield
Correlation (for multi-asset options)
Because exotic options are tailored instruments, market liquidity is limited, and prices often rely on dealer quotes rather than exchange data. Valuation also incorporates model risk, as small assumptions can lead to large pricing differences.
5. Structured Products: Concept and Construction
Definition
A structured product is a pre-packaged investment that combines one or more derivatives (often exotic options) with traditional securities such as bonds or equities. These products are designed to achieve specific outcomes — such as capital protection, enhanced yield, or leveraged participation — under defined market scenarios.
Structured products are typically issued by banks and sold to investors through private placements or public offerings.
6. Components of Structured Products
Most structured products have two primary building blocks:
Fixed-Income Component (Bond or Deposit)
Provides capital protection or guaranteed returns. For example, a zero-coupon bond maturing at face value can ensure that at least part of the principal is preserved.
Derivative Component (Usually an Option or Basket of Options)
Provides market exposure or enhanced upside potential. The derivative could be linked to equities, indices, commodities, currencies, or even interest rates.
For instance, a capital-protected note may invest 90% of the funds in a zero-coupon bond and 10% in a call option on the Nifty 50. If the market rises, the option generates profit; if it falls, the bond ensures capital safety.
7. Types of Structured Products
a. Capital-Protected Notes (CPNs)
Guarantee the return of principal at maturity, while offering upside potential linked to an underlying asset. These are ideal for conservative investors seeking exposure without risking capital.
b. Yield Enhancement Products
These sacrifice downside protection in exchange for higher returns. For example, a reverse convertible bond pays a high coupon but converts into equity if the underlying asset declines.
c. Participation Notes
Allow investors to participate in the performance of an index or asset, often with leverage or caps on returns. They can be structured for bullish or bearish views.
d. Credit-Linked Notes (CLNs)
Combine a bond with a credit default swap, transferring the credit risk of a reference entity to the investor in return for a higher yield.
e. Autocallables and Range Accruals
These include embedded features that trigger automatic redemption or variable coupon payments based on market conditions. For example, an autocallable product may mature early if an index reaches a certain level, locking in profits.
8. Role of Exotic Options in Structured Products
Exotic options are often the hidden engines within structured products. For example:
A capital-protected equity note may include a digital call option to deliver fixed returns if an index ends above a level.
A range-accrual note may embed barrier options determining coupon accrual based on interest rate movements.
A cliquet note uses ratchet options to lock in periodic gains while protecting principal.
Thus, exotic options allow structured product designers to engineer payoffs that are asymmetric, path-dependent, or conditional — catering to virtually any investment outlook.
9. Benefits of Structured Products
Structured products offer a suite of benefits for both institutional and retail investors:
Customization – Tailored to match specific risk tolerance, market outlook, and investment horizon.
Capital Protection – Through fixed-income components and hedging derivatives.
Enhanced Yield – Higher returns via embedded options or credit exposure.
Diversification – Exposure to alternative asset classes or market conditions.
Risk Management – Can hedge against adverse currency, rate, or equity movements.
These features make structured products appealing in low-yield environments or when traditional investments fail to meet portfolio objectives.
10. Risks and Challenges
Despite their appeal, exotic options and structured products carry significant risks:
a. Market Risk
The derivative component’s value is sensitive to changes in the underlying asset. Extreme volatility or unexpected movements can erode returns.
b. Credit Risk
Investors are exposed to the issuer’s creditworthiness. If the issuing bank defaults, even capital-protected notes may lose value.
c. Liquidity Risk
Since most structured products are not exchange-traded, secondary market liquidity is limited. Early redemption may result in losses.
d. Complexity and Transparency
Understanding embedded options requires advanced financial knowledge. Many retail investors underestimate the product’s risk profile.
e. Model Risk
Incorrect pricing assumptions (such as volatility or correlation) can misrepresent true risk or value.
f. Regulatory Risk
Changing regulations may affect taxation, disclosure, or product eligibility, especially in cross-border offerings.
11. Market Trends and Global Outlook
The global market for structured products exceeds trillions of dollars, with strong growth in Asia and Europe. Banks use them to generate fee income, while investors use them to seek alternative returns in low-interest environments.
Recent trends include:
Digitalization and automation of product issuance through fintech platforms.
Sustainability-linked structured products tied to ESG indices.
Tokenized structured notes on blockchain platforms, improving transparency.
Rising use of machine learning models for pricing exotic derivatives.
Regulatory tightening after past mis-selling scandals to protect retail investors.
Post-2020, with volatile markets and fluctuating rates, structured products have regained popularity as flexible tools for yield optimization and risk diversification.
12. Applications in Portfolio Strategy
Institutional investors employ exotic options and structured products for:
Yield enhancement – capturing returns in sideways markets.
Capital protection – maintaining exposure without principal loss.
Hedging – offsetting corporate exposures in currencies, commodities, or rates.
Diversification – achieving non-linear payoffs uncorrelated with standard assets.
Private banks use them to attract affluent investors seeking sophisticated, personalized products that align with their market views.
13. Conclusion
Exotic options and structured products represent the pinnacle of financial innovation, merging mathematical precision with investment creativity. They allow investors and institutions to shape unique payoff profiles — from capital-protected growth to leveraged yield — often unachievable through conventional assets.
However, with this innovation comes complexity. Proper valuation, risk assessment, and transparency are crucial. Investors must understand not only the potential returns but also the embedded risks and the issuer’s credit quality.
In a global financial landscape increasingly characterized by uncertainty, structured products and exotic options serve as versatile instruments for tailored exposure, capital efficiency, and strategic hedging. Yet, they demand expertise, due diligence, and disciplined risk management to harness their full potential responsibly.

AUDUSD: Time to break the range! Price has been ranging on this pair for a few days (accumulation) and with the Daily FVG acting as support, it is possible we see this pair to start move during the week. If bullish, expect a slight correction lower (manipulation) before an extension to the upside.
What I like:
- Bullish divergence on the daily (clearly visible when using a MACD)
- Current Daily FVG support level.
- Price has been accumulating orders and is primed for a breakout (one way or the other)
What I don't like:
- Fundamentals and the planned mineral deal meetings.
Action:
- Waiting for a break out of this range.

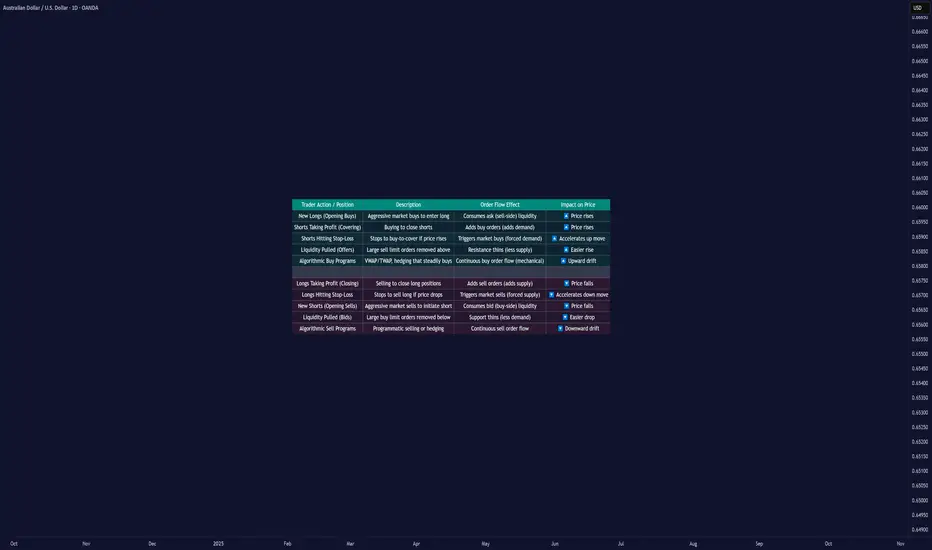
Why Prices Move Up or Down: Order Flow and Liquidity█ Why Prices Move Up or Down: Understanding Order Flow and Liquidity
Most traders are told that prices rise because “there are more buyers than sellers,” and that prices fall because “there are more sellers than buyers.” But that’s not how markets actually work. In every transaction, there’s always one buyer and one seller; what really matters is which side is more aggressive and how liquidity responds to that aggression.
Price movement is the result of order flow interacting with liquidity. When buyers use market orders and aggressively lift the available sell orders (the ask), the price moves up. When sellers hit the bid with market orders, the price moves down.
In short, price moves in the direction of the side that consumes liquidity.
█ The Engine Behind Price Movement
When buyers and sellers agree on price, the market ranges, there’s a balance. When one side becomes more aggressive, an imbalance occurs, and the price must adjust until new liquidity appears.
Imagine the market like a ladder made of buy and sell orders. Each rung shows where traders are waiting, buyers below the current price, and sellers above it. These waiting orders are what we call liquidity.
When a trader sends a market buy order, they’re not waiting; they want to buy immediately. That order takes the best available sell price (the ask). If more traders keep doing this — buying aggressively — those sell orders get used up faster than new ones appear. As a result, the next available sell price is higher, and the price moves up until new sellers fill the gap.
The same logic applies in reverse: when aggressive market sell orders hit the bids, they consume the buy-side liquidity. Once those bids are gone, the next available buyer is lower, and the price moves down.
This continuous back-and-forth, liquidity being consumed, replaced, or withdrawn, is the real engine of every price movement.
█ Why Prices Move Up
1. Aggressive Buying (New Longs)
When new participants enter with market buys, they lift the offers, consuming sell-side liquidity. If this continues, the price climbs until enough new sellers appear to absorb demand. This is the cleanest form of demand-driven uptrend, with new buyers initiating positions.
2. Short Covering
The price moves higher as short sellers buy back positions. This can happen when stops are triggered after a price rise or when shorts take profits after a decline. In both cases, their buying adds upward pressure. When many cover at once, the move can accelerate into a short squeeze — higher prices trigger stops, which trigger even more buy orders, creating a self-reinforcing rally.
Profit Taking Phase
Short Squeeze Phase
3. Stop-Loss Triggers
Clusters of stop-loss orders above previous highs act as “fuel.” When price breaks those levels, automatic buy orders fire off. These aren’t new investors; they’re forced buyers closing shorts. The result is a fast, often exaggerated upward burst.
4. Thin Liquidity and Pulled Offers
Sometimes, price surges not because of huge buying, but because there’s nobody selling. If the sell side of the order book is thin, or if large resting orders get canceled, even small buys can sweep multiple levels. This creates those “air pockets” where price jumps several ticks in seconds.
5. Algorithmic and Institutional Flows
Institutions use automated execution algorithms like VWAP or TWAP to buy steadily throughout the day. These constant flows absorb liquidity over time, creating a slow upward bias. Similarly, option dealers who are short gamma must buy as prices rise to stay hedged, adding even more mechanical buying pressure.
█ Why Prices Move Down
1. Aggressive Selling (New Shorts)
When traders use market sells, they consume buy-side liquidity. If this persists, the price naturally ticks lower as bids disappear, and the next buyer will be willing only at a cheaper level.
2. Long Profit-Taking
At some point, long traders sell to realize profits. These sales add supply, which can cap or reverse an uptrend. It’s not bearish conviction; it’s simply existing longs exiting their positions.
3. Long Stop-Loss Cascades
If prices fall to where many long traders placed stops, those automatic sell orders trigger, creating a chain reaction of forced selling. This is the mirror image of a short squeeze — a long liquidation cascade.
4. Thin Bid Liquidity or Pulled Bids
When buy orders disappear, the market has no floor. Even modest selling pressure can make the price fall through several levels until new bids emerge. This is how “flash drops” occur during low-liquidity periods.
5. Algorithmic and Mechanical Selling
Negative news or risk events can activate automated sell programs, from funds rebalancing to dealers hedging short options exposure. These trades can intensify selling, even without new bearish sentiment.
█ New Positions vs. Exits — The Hidden Difference
Not every up-move means new buyers are coming in, and not every down-move means new shorts.
Some moves happen because existing positions are being closed, not opened. and that distinction matters.
New Positions (Initiative Flow): Create real trends, since they bring new demand or supply.
Position Exits (Reactive Flow): Often short-lived, they relieve pressure rather than add it.
One way to tell the difference is through open interest (in futures or options):
Price up + Open Interest up → new longs entering (sustainable).
Price up + Open Interest down → short covering (temporary).
Price down + Open Interest down → long liquidation (often near exhaustion).
Price down + Open Interest up → new shorts entering (trend formation).
█ The Real Takeaway
Price doesn’t rise because “buyers beat sellers.” It rises because buyers were more aggressive, consuming available sell orders faster than they were replaced. It falls when sellers become more aggressive, taking out the bids.
Both entries and exits can push the price the same way:
New longs and shorts covering both create buy pressure.
New shorts and longs taking profit both create sell pressure.
To truly understand a move, traders must ask:
Who initiated it, new positions or forced exits?
Was liquidity added or withdrawn?
Did open interest confirm new participation or show a squeeze?
Once you start thinking in these terms, price becomes more than a random chart line; it becomes a story of liquidity and intent unfolding in real time.
█ Multiple Forces in Motion
While each example above highlights a single mechanism in isolation, the market rarely moves for one reason alone. In real trading, several of these forces often act simultaneously, new longs entering, shorts covering, stops triggering, algorithms executing, and liquidity thinning.
When multiple flows align in the same direction, the result is acceleration, price moves rapidly as liquidity vanishes, and reactions compound. When opposing forces meet, price can stall, consolidate, or violently whip as both sides compete for control.
In essence, market movement is the sum of overlapping liquidity events, not isolated causes. Understanding how these factors interact in real time is key to reading true intent behind every move.
█ In summary:
Markets move not because of “more buyers” or “more sellers,” but because one side becomes impatient, consumes liquidity, and forces repricing until balance returns.
Understanding who’s moving the market and why — new positioning, forced exits, or vanished liquidity — is the foundation of reading true market intent.
-----------------
Disclaimer
The content provided in my scripts, indicators, ideas, algorithms, and systems is for educational and informational purposes only. It does not constitute financial advice, investment recommendations, or a solicitation to buy or sell any financial instruments. I will not accept liability for any loss or damage, including without limitation any loss of profit, which may arise directly or indirectly from the use of or reliance on such information.
All investments involve risk, and the past performance of a security, industry, sector, market, financial product, trading strategy, backtest, or individual's trading does not guarantee future results or returns. Investors are fully responsible for any investment decisions they make. Such decisions should be based solely on an evaluation of their financial circumstances, investment objectives, risk tolerance, and liquidity needs.
AUDUSD H1 | Bullish Bounce Off SupportAussie (AUD/USD) has bounced off the buy entry which is a pullback support that aligns with the 61.8% Fibonacci retracement and could rise from this levle to the upside.
Buy entry is at 0.6492, which is a pullback support that aligns with the 61.8% Fibonacci retracement.
Stop loss is at 0.6476, whic is a multi swing low support.
Take profit is at 0.6526, which is a multi swing high ressitance.
Stratos Markets Limited (tradu.com ):
CFDs are complex instruments and come with a high risk of losing money rapidly due to leverage. 68% of retail investor accounts lose money when trading CFDs with this provider. You should consider whether you understand how CFDs work and whether you can afford to take the high risk of losing your money.
Stratos Europe Ltd (tradu.com ):
CFDs are complex instruments and come with a high risk of losing money rapidly due to leverage. 70% of retail investor accounts lose money when trading CFDs with this provider. You should consider whether you understand how CFDs work and whether you can afford to take the high risk of losing your money.

AUDUSD FRGNT Daily Forecast -Q4 | W43 | D24| Y25 |📅 Q4 | W43 | D24| Y25 |
📊 AUDUSD FRGNT Daily Forecast
🔍 Analysis Approach:
I’m applying Smart Money Concepts, focusing on:
Identifying Points of Interest on the Higher Time Frames (HTFs) 🕰️
Using those POIs to define a clear trading range 📐
Refining those zones on Lower Time Frames (LTFs) 🔎
Waiting for a Break of Structure (BoS) for confirmation ✅
This method allows me to stay precise, disciplined, and aligned with the market narrative, rather than chasing price.
💡 My Motto:
"Capital management, discipline, and consistency in your trading edge."
A positive risk-to-reward ratio, paired with a high win rate, is the backbone of any solid trading plan 📈🔐
⚠️ Losses?
They’re part of the mathematical game of trading 🎲
They don’t define you — they’re necessary, they happen, and we move forward 📊➡️
🙏 I appreciate you taking the time to review my Daily Forecast.
Stay sharp, stay consistent, and protect your capital
— FRNGT 🚀
OANDA:AUDUSD

AUDUSD: Swing LOW!AUDUSD has already followed tradition with short sales and activated previously but this is a new entry position for those that missed it or want to scale up.
This order has completed Wave 2 and crossed both RSI and EMA. It is currently at the start of Wave 3 so plenty of opportunity there.
The trade hasn’t entered into this waves sell areas yet and I am still waiting for Wave 3 Trend Direction confirmation to enter.
This is a trade I plan to participate in so
I will be posting updates to this trade as well as posting potential trades.
Follow me to stay updated with modifications and new trade opportunities.
Have a Prosperous Trade and God Bless


AUDUSD FRGNT Daily Forecast -Q4 | W43 | D23| Y25 |📅 Q4 | W43 | D23| Y25 |
📊 AUDUSD FRGNT Daily Forecast
🔍 Analysis Approach:
I’m applying Smart Money Concepts, focusing on:
Identifying Points of Interest on the Higher Time Frames (HTFs) 🕰️
Using those POIs to define a clear trading range 📐
Refining those zones on Lower Time Frames (LTFs) 🔎
Waiting for a Break of Structure (BoS) for confirmation ✅
This method allows me to stay precise, disciplined, and aligned with the market narrative, rather than chasing price.
💡 My Motto:
"Capital management, discipline, and consistency in your trading edge."
A positive risk-to-reward ratio, paired with a high win rate, is the backbone of any solid trading plan 📈🔐
⚠️ Losses?
They’re part of the mathematical game of trading 🎲
They don’t define you — they’re necessary, they happen, and we move forward 📊➡️
🙏 I appreciate you taking the time to review my Daily Forecast.
Stay sharp, stay consistent, and protect your capital
— FRNGT 🚀
OANDA:AUDUSD

Bullish reevrsal off pullback support?The Aussie (AUD/USD) could fall towards the pivot and could bounce to the 1st resistance which acts as a multi swing high resistance.
Pivot: 0.6500
1st Support: 0.6486
1st Resistance: 0.6522
Disclaimer:
The above opinions given constitute general market commentary, and do not constitute the opinion or advice of IC Markets or any form of personal or investment advice.
Any opinions, news, research, analyses, prices, other information, or links to third-party sites contained on this website are provided on an "as-is" basis, are intended only to be informative, is not an advice nor a recommendation, nor research, or a record of our trading prices, or an offer of, or solicitation for a transaction in any financial instrument and thus should not be treated as such. The information provided does not involve any specific investment objectives, financial situation and needs of any specific person who may receive it. Please be aware, that past performance is not a reliable indicator of future performance and/or results. Past Performance or Forward-looking scenarios based upon the reasonable beliefs of the third-party provider are not a guarantee of future performance. Actual results may differ materially from those anticipated in forward-looking or past performance statements. IC Markets makes no representation or warranty and assumes no liability as to the accuracy or completeness of the information provided, nor any loss arising from any investment based on a recommendation, forecast or any information supplied by any third-party.

23.10.25 Morning ForecastPairs on Watch -
FX:NZDJPY
FX:AUDUSD
A short overview of the instruments I am looking at for today, multi-timeframe analysis down to what I will be looking at for an entry. Enjoy!

possibility of uptrend It is expected that after some fluctuation and correction, a trend change will form and we will see the start of an upward trend. A break of the resistance trend line will be a confirmation of the upward trend.

AUDUSD📈AUDUSD
Out from AUDUSD. its countertrend trade and as much as it is ranging I see lower and lower probability its happening.
You know the rules. I close it and it will happen hahah We always leave some money on the table, So lets be it , but I don't feel comfortable in the position.

AUDUSD: Monitoring Downside MomentumDaily Timeframe:
Yesterday's session closed with a doji (inside bar). There's a lot of indecision going on. Price is maintaining below the HTL, however, the ranging bars may indicate that there's a lack of selling pressure.
If momentum does not pickup, we might see a fakeout. For the time being, I still maintain a bearish stance on the daily timeframe.
H1 Timeframe:
Price is breaking below the ATL, which is the first indication that momentum may be picking up throughout the Asian session.
Price remains choppy around the EMAs, which is a less reliable momentum signal.
However, I do think this pair has potential if price does not close back above the ATL.

AUDUSD – The Downtrend Remains DominantOn the 4H chart, AUDUSD continues to move within a descending channel that has persisted since early October. Each time price touches the upper trendline, it gets sharply rejected — showing that sellers remain firmly in control.
Currently, the pair is hovering around the 0.6480 zone, just below both the EMA34 and EMA89, which are sloping downward — confirming that the medium-term downtrend is still intact.
From a fundamental perspective, weaker-than-expected Australian employment data and growing expectations that the RBA might cut rates sooner are weighing on the Aussie. Meanwhile, the U.S. dollar is supported by rising Treasury yields — further strengthening the bearish bias.
Short-term scenario: price may rebound slightly toward the 0.6500 area (testing EMA resistance + upper trendline) before continuing its decline toward the 0.6420 target zone — which also aligns with strong technical support and the bottom of the descending channel.

AUDUSD(20251023)Today's AnalysisMarket News:
The US Senate rejected the temporary funding bill for the 12th time as the shutdown continues.
Technical Analysis:
Today's Buy/Sell Levels:
0.6491
Support and Resistance Levels:
0.6524
0.6512
0.6504
0.6478
0.6470
0.6458
Trading Strategy:
If the price breaks above 0.6491, consider a buy entry with the first target at 0.6512.
If the price breaks below 0.6478, consider a sell entry with the first target at 0.6458

AUD/USDThe price formed a lower low, then pulled back near the previous lower high level. From that same zone, the price faced two strong rejections, creating a double top pattern. After that, the neckline was broken, confirming bearish momentum.
Trade Plan:
• Entry: On neckline break
• Stop Loss: Above the double top
• Target: 1:1 risk-to-reward ratio
