AUDUSD Could drop new lowThe AUD/USD is expected to fall further after showing a pullback to the M15 timeframe top in a clear downtrend. The pair is reacting negatively to that resistance area, suggesting that after a short-term retracement to the upside, we could see another move toward new lows.
This setup could offer a high-quality short opportunity with strong potential if the price confirms rejection at the M15 top.
This is not financial advice. You are responsible for your own trades and decisions.
Trade ideas

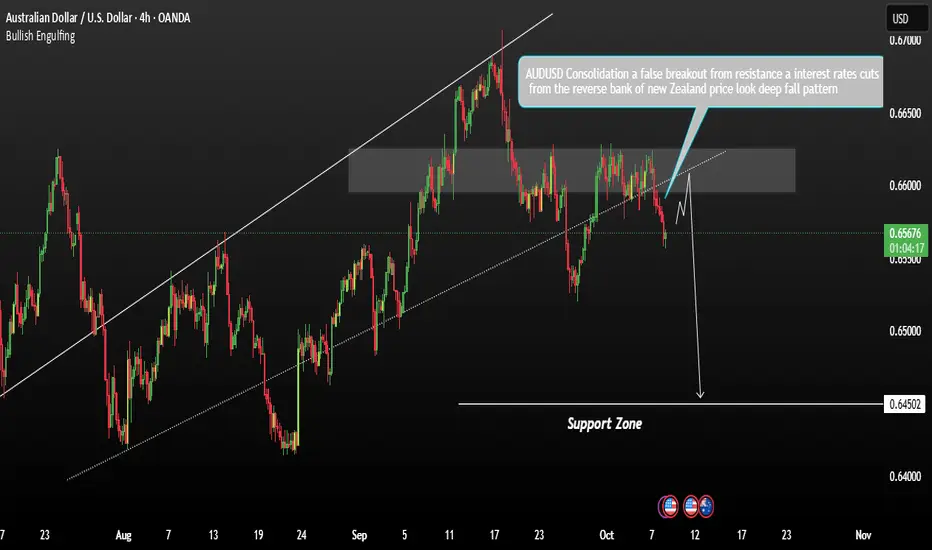
AUDUSD attempted to break above the key resistance levelThe AUD/USD pair recently attempted to break above the key resistance level at 0.6520, but this move appears to have been a false breakout. Following a period of consolidation below resistance, the pair is showing signs of renewed bearish momentum.
From a fundamental perspective, the recent interest rate cuts by the Reserve Bank of New Zealand may have contributed to increased downside pressure on the Australian dollar, strengthening the bearish outlook.
Technical Outlook:
Price is currently trading below the critical resistance zone near 0.6520, confirming sellers are in control Failure to sustain gains above this level suggests a potential continuation of the downtrend If bearish momentum holds, the pair is expected to decline towards the next support level around 0.6450.
You may find more details in the chart.
Trade wisely best of Luck.
Ps; Support with like and comments for better analysis Thanks for Supporting.
AUDUSD Bullish ScenarioAUDUSD presenting a bullish flag pattern ahead of the highly anticipated NFP release which was delayed due to Government Shutdowns in the USA last Friday. Of all USD pairs, AUDUSD look the readiest to move higher as the Australian market enters into Thursday.

possibility of uptrend The recent downtrend is expected to end at the current support level and we will see the start of an uptrend. If the price breaks through the support level, a continuation of the downtrend is likely.

AUDUSD New long term sell-off just starting.The AUDUSD pair has been trading within a 3-year Channel Down pattern. On the September 15 2025 1W candle, the price hit and got rejected on its 1W MA200 (orange trend-line) for the first time since January 30 2023.
That was the pattern's first Bullish Leg and as you can see, even the second one (started September 30 2024) peaked just below the 1W MA200. With the 1W RSI also having been rejected on its 3-year Resistance Zone last month, we expect the pair to start its new Bearish Leg now.
The minimum target on the long-term is the 0.786 Fibonacci retracement level at 0.60700.
-------------------------------------------------------------------------------
** Please LIKE 👍, FOLLOW ✅, SHARE 🙌 and COMMENT ✍ if you enjoy this idea! Also share your ideas and charts in the comments section below! This is best way to keep it relevant, support us, keep the content here free and allow the idea to reach as many people as possible. **
-------------------------------------------------------------------------------
💸💸💸💸💸💸
👇 👇 👇 👇 👇 👇

AUDUSD H4 | Bearish ContinuationThe Aussie (AUD/USD) is rising towards the sell entry, which is a pullback resistance and could drop from this level to the take profit.
Sell entry is at 0.6590, which is a pullback resistance.
Stop loss is at 0.6621, which is a multi-swing high resistance.
Take profit is at 0.6521, which is an overlap support that lines up with the 61.8% Fibonacci projection.
High Risk Investment Warning
Trading Forex/CFDs on margin carries a high level of risk and may not be suitable for all investors. Leverage can work against you.
Stratos Markets Limited (tradu.com ):
CFDs are complex instruments and come with a high risk of losing money rapidly due to leverage. 65% of retail investor accounts lose money when trading CFDs with this provider. You should consider whether you understand how CFDs work and whether you can afford to take the high risk of losing your money.
Stratos Europe Ltd (tradu.com ):
CFDs are complex instruments and come with a high risk of losing money rapidly due to leverage. 66% of retail investor accounts lose money when trading CFDs with this provider. You should consider whether you understand how CFDs work and whether you can afford to take the high risk of losing your money.
Stratos Global LLC (tradu.com ):
Losses can exceed deposits.
Please be advised that the information presented on TradingView is provided to Tradu (‘Company’, ‘we’) by a third-party provider (‘TFA Global Pte Ltd’). Please be reminded that you are solely responsible for the trading decisions on your account. There is a very high degree of risk involved in trading. Any information and/or content is intended entirely for research, educational and informational purposes only and does not constitute investment or consultation advice or investment strategy. The information is not tailored to the investment needs of any specific person and therefore does not involve a consideration of any of the investment objectives, financial situation or needs of any viewer that may receive it. Kindly also note that past performance is not a reliable indicator of future results. Actual results may differ materially from those anticipated in forward-looking or past performance statements. We assume no liability as to the accuracy or completeness of any of the information and/or content provided herein and the Company cannot be held responsible for any omission, mistake nor for any loss or damage including without limitation to any loss of profit which may arise from reliance on any information supplied by TFA Global Pte Ltd.
The speaker(s) is neither an employee, agent nor representative of Tradu and is therefore acting independently. The opinions given are their own, constitute general market commentary, and do not constitute the opinion or advice of Tradu or any form of personal or investment advice. Tradu neither endorses nor guarantees offerings of third-party speakers, nor is Tradu responsible for the content, veracity or opinions of third-party speakers, presenters or participants.

AUDUSDCheck my recent post
I might as well be out
looking at the short I'm in on some good profit
If you took the trade when I first posted
Congratulations

AUDUSDaudusd its third week price rejected at 0.60 level plus bullish dxy, trendline slope aligns with 100day SMA, that 100 SMA may over support when tested

AUDUSD Eyes 0.65900 as Gold Nears Record HighHey Traders, in the coming week we are monitoring AUDUSD for a potential buying opportunity around the 0.65900 zone. AUDUSD remains in an uptrend and is currently in a correction phase, with price moving toward this key support/resistance level.
Structure: The broader bias is bullish, with price retracing toward trend support.
Key level in focus: 0.65900 — an important area where buyers may look to re-enter.
Fundamentals: Gold continues to rise and is nearing a fresh ATH, supported by a bearish US Dollar bias. Given the positive correlation between AUDUSD and Gold, further upside on the pair remains likely.
Next move: Monitoring price reaction at 0.65900 to assess whether the trend resumes higher.
Trade safe,
Joe.

AUD-USD Free Signal! Buy!
Hello,Traders!
AUDUSD reacts strongly from the horizontal demand area, confirming bullish displacement as Smart Money defends discount levels. With liquidity swept below structure, price seeks to rebalance inefficiency toward 0.6599$.
-------------------
Stop Loss: 0.6574$
Take Profit: 0.6599$
Entry: 0.6585$
Time Frame: 1H
-------------------
Buy!
Comment and subscribe to help us grow!
Check out other forecasts below too!
Disclosure: I am part of Trade Nation's Influencer program and receive a monthly fee for using their TradingView charts in my analysis.

Bearish drop off major resistance?AUD/USD has rejected the resistance level, which is an overlap resistance, and could drop from this level to our take-profit.
Entry: 0.6623
Why we like it:
There is an overlap resistance level.
Stop loss: 0.6684
Why we like it:
There is a swing high resistance level.
Take profit: 0.6507
Why we like it:
There is a pullback support level that aligns with the 61.8% Fibonacci projection.
Enjoying your TradingView experience? Review us!
Please be advised that the information presented on TradingView is provided to Vantage (‘Vantage Global Limited’, ‘we’) by a third-party provider (‘Everest Fortune Group’). Please be reminded that you are solely responsible for the trading decisions on your account. There is a very high degree of risk involved in trading. Any information and/or content is intended entirely for research, educational and informational purposes only and does not constitute investment or consultation advice or investment strategy. The information is not tailored to the investment needs of any specific person and therefore does not involve a consideration of any of the investment objectives, financial situation or needs of any viewer that may receive it. Kindly also note that past performance is not a reliable indicator of future results. Actual results may differ materially from those anticipated in forward-looking or past performance statements. We assume no liability as to the accuracy or completeness of any of the information and/or content provided herein and the Company cannot be held responsible for any omission, mistake nor for any loss or damage including without limitation to any loss of profit which may arise from reliance on any information supplied by Everest Fortune Group.

AUDUSD May Be at Key Juncture for Long-Term Trend ChangeAUDUSD is at a critical juncture in both the medium and long term. It has broken above the downward trendline (green downtrend) that began in 2011. A trend channel from 2021 (yellow), whose upper line is almost identical to that same green trendline, has also been broken. This could signal a major shift for AUD traders, as dynamics that held from 2011 to 2025 may no longer apply.
Fundamentals support this potential change. Headline inflation is at 2.1 percent, but short-term data suggest the fight against inflation may not be fully over. CPI is expected to bounce back to 2.68 percent by the end of 2026, meaning fast rate cuts are unlikely. Unlike the US, Australia shows no clear downtrend in net employment change, which is very supportive for the AUD. On growth, forecasts for 2026 show Australia’s GDP at a median 2.20 percent compared to 1.70 percent for the US. With similar CPI forecasts, this gives the AUD an advantage over the USD.
On the fiscal side, Australia is in much better shape than the US, with a lower budget deficit and far lower debt-to-GDP. Despite lower debt, lower deficit, lower inflation, and lower rates, Australia’s 10-year bond yield stands at 4.22 percent compared to 4.02 percent in the US. This is a serious imbalance in both yields and currency, one that will likely return to balance within a year, perhaps sooner.
Both technically and fundamentally, AUDUSD looks bullish in the medium and long term. In the short term, however, direction may hinge on the FOMC. Price is now near the upper line of the green shorter-term channel. A possible downward correction could bring AUDUSD back to the lower line, retesting the long-term channel in a single big move. If so, it could mark the best buying opportunity for AUD bulls. Still, the dollar index itself is testing its long-term trend dating back to 2011, so a downward correction may not materialize at all. Traders should plan accordingly.

AUDUSD keep an eyeAUD USD. maybe to late for an entry. waiting for a pull back. looking at going long

AUDUSDHello Traders! 👋
What are your thoughts on AUDUSD?
The pair has broken its ascending trendline and completed a pullback to the broken level.
It is now trading below a key resistance zone, showing signs of bearish pressure.
After some consolidation in this area, the price is expected to continue declining toward the highlighted support levels.
As long as the pair remains below the resistance zone, the downside bias will stay in play.
Don’t forget to like and share your thoughts in the comments! ❤️

AUDUSD - Steady Uptrend with Strong Support ? 👋Hello everyone, what do you think about the trend of OANDA:AUDUSD ?
AUDUSD has maintained a steady uptrend over the past few months, primarily consolidating in a defined price channel, with the price holding above key support levels. Technically, the pair is currently testing the support zone that aligns with the ascending trendline. This trendline has proven to be a reliable support in the past and continues to be a focal point.
On the other hand, the Australian dollar benefits from a favorable economic outlook and rising commodity prices, which bolster investor confidence in the currency. Meanwhile, the U.S. dollar remains under pressure due to concerns over economic growth and the potential policy adjustments by the Federal Reserve.
With these two factors in play, I remain optimistic about this currency pair. 💬How about you?

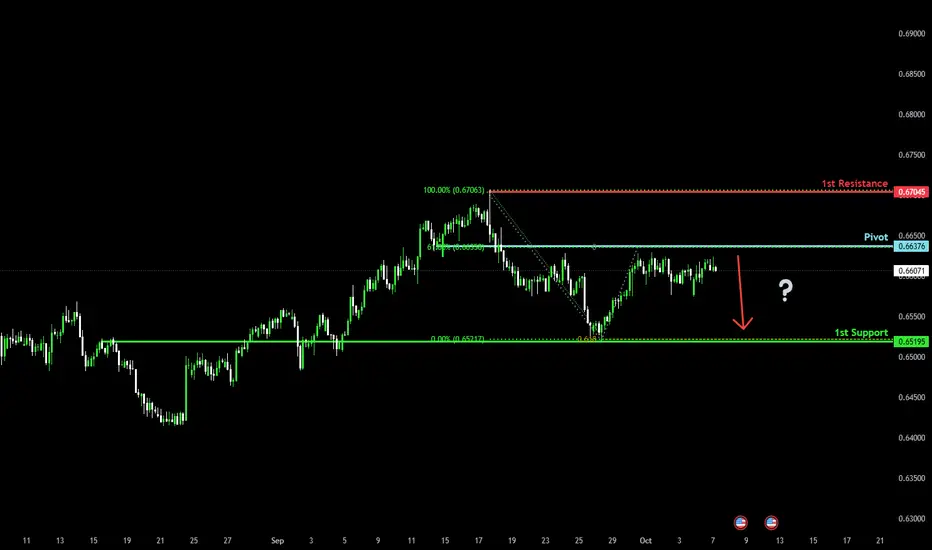
Bearish reversal?The Aussie (AUD/USD) is rising towards the pivot, which is a pullback resistance that aligns with the 61.8% Fibonacci retracement and could reverse to the 1st support, which has been identified as an overlap support.
Pivot: 0.6637
1st Support: 0.6519
1st Resistance: 0.6704
Disclaimer:
The above opinions given constitute general market commentary, and do not constitute the opinion or advice of IC Markets or any form of personal or investment advice.
Any opinions, news, research, analyses, prices, other information, or links to third-party sites contained on this website are provided on an "as-is" basis, are intended only to be informative, is not an advice nor a recommendation, nor research, or a record of our trading prices, or an offer of, or solicitation for a transaction in any financial instrument and thus should not be treated as such. The information provided does not involve any specific investment objectives, financial situation and needs of any specific person who may receive it. Please be aware, that past performance is not a reliable indicator of future performance and/or results. Past Performance or Forward-looking scenarios based upon the reasonable beliefs of the third-party provider are not a guarantee of future performance. Actual results may differ materially from those anticipated in forward-looking or past performance statements. IC Markets makes no representation or warranty and assumes no liability as to the accuracy or completeness of the information provided, nor any loss arising from any investment based on a recommendation, forecast or any information supplied by any third-party.
AUDUSD: Trend ContinuationKey Observations
Daily Timeframe:
EMA20 remains above EMA60 > uptrend indication
Price holds above HTL > no strong downside momentum
H1 Timeframe:
Price crossed above DTL and holds
Price pulled back to DTL and held above it
Price also exited EMA band with momentum strength

Bullish Trend - Bullish Divergence - ABCD ContinuationFX:AUDUSD has continued its bullish trend, surpassing major resistance levels.
Currently, price has completed a 0.618 fib retracement, made bullish divergence and broke the lower highs, signalling imminent bullish momentum.
I am expecting price to complete the ABCD projections!

AUDUSD- short 30minAsian session sell setup. this is a high risk trade but due to the resistance at the .66200 level respecting im going to short for a alittle while until i get my buy setup again.

AUDUSD FREE SIGNAL|SHORT|
✅AUDUSD reacts strongly from the supply level, rejecting premium structure and confirming bearish order flow continuation. Price aims for the 0.6600 liquidity pool with confluence from previous imbalance.
—————————
Entry: 0.6620
Stop Loss: 0.6628
Take Profit: 0.6600
Time Frame: 1H
Setup Risk: High
—————————
SHORT🔥
✅Like and subscribe to never miss a new idea!✅

The market is hading upIf the market happen to take the daly time frame Cadles it will be the confirmation to us that we are going up and we must be looking for entry

AUDUSD Bullish continuation breakout? The AUDUSD remains in a bullish trend, with recent price action showing signs of a breakout within the broader uptrend.
Support Zone: 0.6540 – a key level from previous consolidation. Price is currently testing or approaching this level.
A bullish rebound from 0.6540 would confirm ongoing upside momentum, with potential targets at:
0.6640 – initial resistance
0.6656 – psychological and structural level
0.6670 – extended resistance on the longer-term chart
Bearish Scenario:
A confirmed break and daily close below 0.6540 would weaken the bullish outlook and suggest deeper downside risk toward:
0.6520 – minor support
0.6500 – stronger support and potential demand zone
Outlook:
Bullish bias remains intact while the AUDUSD holds above 0.6540. A sustained break below this level could shift momentum to the downside in the short term.
This communication is for informational purposes only and should not be viewed as any form of recommendation as to a particular course of action or as investment advice. It is not intended as an offer or solicitation for the purchase or sale of any financial instrument or as an official confirmation of any transaction. Opinions, estimates and assumptions expressed herein are made as of the date of this communication and are subject to change without notice. This communication has been prepared based upon information, including market prices, data and other information, believed to be reliable; however, Trade Nation does not warrant its completeness or accuracy. All market prices and market data contained in or attached to this communication are indicative and subject to change without notice.

AUDUSD let's try to short
Short structure, nzd usd short looks short as wel (it'c on of the confirmation points for me)
