USDCAD: FED Cut Speculation Keeps Pair on a TightropeUSDCAD: FED Cut Speculation Keeps Pair on a Tightrope
In the current environment, where the market expects the FED to cut rates next week by 25 to 50 basis points, trading USDCAD comes with a very high level of risk.
The market today will also speculate on the US PCE data and its potential impact on the FOMC's rate cut decision.
US PCE is expected to be 2.8% vs. 2.7% YoY and Core PCE data is expected to be 2.9% vs. 2.9% YoY.
A higher reading could help the US dollar show some strength. However, I think with small deviations, a 25 basis point cut is already possible, and it was already priced in, so we should be cautious.
You may find more details in the chart!
Thank you and Good Luck!
❤️PS: Please support with a like or comment if you find this analysis useful for your trading day❤️
U.S. Dollar / Canadian Dollar
No trades
Trade ideas
USDCAD: 2-week horizon🛠 Technical Analysis: On the 4-hour timeframe, USDCAD has invalidated its ascending channel structure, triggering a "Global bearish signal" confirmed by the death cross of the SMA 50 below the SMA 100 and 200. The pair is currently under strong selling pressure but is approaching a major support zone near 1.3730, which aligns with previous accumulation levels. The projected trade setup anticipates a stabilization at this support floor, followed by a corrective rally targeting the breakdown point and the SMA cluster around 1.3980 - 1.4000.
———————————————
❗️ Trade Parameters (BUY)
———————————————
➡️ Entry Point: Buy Limit at the support zone (approx. 1.3730 – 1.3750)
🎯 Take Profit: 1.3980 – 1.4015 (Resistance)
🔴 Stop Loss: Below the support structure (approx. 1.3600)
⚠️ Disclaimer: This is a potential trade idea based on current analysis; market conditions and price direction are subject to change based on news factors and volatility.

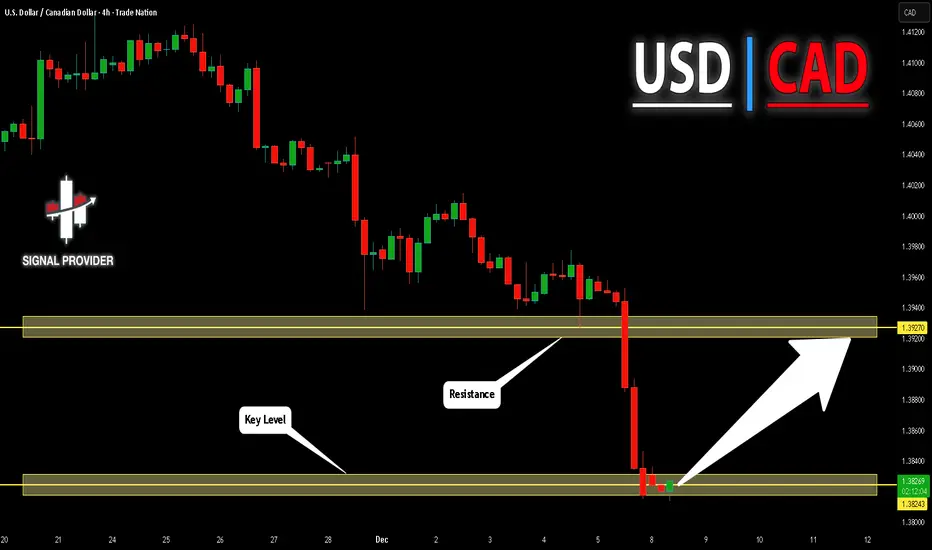
Lingrid | USDCAD Bullish Entry at Key Demand LevelFX:USDCAD is approaching the 1.3915 support band after retesting the descending trendline from below, forming a constructive reaction at the lower boundary of the structure. Price action shows exhaustion in the recent pullback, with buyers starting to defend the same zone that previously acted as breakout pressure. This behavior hints at early accumulation as long as price remains above the reclaimed support shelf.
If price continues to hold this floor, a recovery toward 1.4000 becomes increasingly likely, where the next liquidity pool and short-term resistance converge. Trend pressure remains soft, but a stabilizing base favors upside rotation from current levels.
➡️ Primary scenario: hold above 1.3915 → climb toward 1.4000.
⚠️ Risk scenario: break below trendline delays any bullish continuation.
If this idea resonates with you or you have your own opinion, traders, hit the comments. I’m excited to read your thoughts!

USDCAD D11. Market Structure
USDCAD has broken down from the ascending channel (rising structure), showing loss of bullish momentum.
Current price around 1.3817 is sitting just below the previous channel support, now acting as resistance.
The bearish break suggests a shift from bullish → corrective → bearish.
⭐ 2. Key Levels
Resistance (Sell Zones)
🔴 1.3925 – 1.3965
Strong supply area.
Former support → now turning resistance.
Price retest into this zone is likely before continuing the move down.
Support (Targets)
🔵 1.3729
Major horizontal D1 support.
Liquidity zone + previous accumulation.
🔵 1.3600 – 1.3650 (extended target)
Trendline confluence.
Next swing support if bearish pressure continues.
⭐ 3. Price Action Outlook
Your chart projection matches the clean technical flow:
Baseline Bearish Scenario (Most Likely)
Price pulls back into 1.3925–1.3965 (retest supply).
Rejection signals → bearish continuation.
First target: 1.3730.
Break of 1.3730 could open deeper drop toward 1.3600 trendline.
Conditions Supporting This Bias
Bearish structure break.
Momentum candles down.
Retest zone not yet filled (price often retraces to fill before continuation).

USD/CAD Selling from key supply zone strong sell📉USDCAD Sell Setup Alert 🇺🇸🇨🇦
Price is reacting from a key supply zone at 1.38600 and forming an ascending triangle pattern on the 30-minute chart ⏱️📊
🎯 Technical Targets:
• TP1: 1.38200
• TP2: 1.38000
🚨 Trading Insight:
Structure shows potential bearish pressure from supply—watch for confirmation before entering.
⚠️ Always use proper risk management — protect your capital first! 💰🛡️
👍 Like • Follow • Comment • Share

USDCAD plunges as BOC vs Fed divergence grows! Can it continue?USDCAD has broken sharply lower following Canada's surprise jobs blowout on Friday, with the pair now pricing in a divergence: the Bank of Canada is expected to hold rates Wednesday, while the Fed is expected to cut.
Canada added 54,000 jobs in November, and the unemployment rate plunged to 6.5%, taking a BOC cut off the table. Meanwhile, the Fed is 90% priced to cut by 25bps on Wednesday, narrowing the rate differential and weakening the US dollar against the loonie.
Key drivers
Canada jobs report beat expectations with +54k positions (vs expected loss), unemployment fell to 6.5% from 6.9% — three straight months of gains totalling 181k jobs.
BOC decision this week virtually certain to hold at 2.25% after cutting in October and signalling the easing cycle is likely over.
Fed FOMC decision on Wednesday priced in at 90% odds for a 25bps cut to 3.75–4%, the third consecutive cut driven by cooling US labour and dovish Fed commentary.
Technical: USDCAD corrected to 50% Fibonacci (1.4140–60) of the 1.4790–1.3543 impulse leg and is now breaking down in a potential head and shoulders pattern with neckline at 1.3543.
Downside targets: 1.3370–1.3396 (61.8% extension + 50% retracement confluence), 1.3068 (61.8% retracement), and 1.2895 (100% extension full measured move).
Risk scenario: Neckline hold above 1.3543 could see bounce back toward 1.36 or 1.43, but below 1.4140, the path of least resistance is lower.
Are you trading the USDCAD breakdown? Share your head and shoulders setups in the comments and follow for more central bank divergence and technical trade ideas.
This content is not directed to residents of the EU or UK. Any opinions, news, research, analyses, prices or other information contained on this website is provided as general market commentary and does not constitute investment advice. ThinkMarkets will not accept liability for any loss or damage including, without limitation, to any loss of profit which may arise directly or indirectly from use of or reliance on such information.

USDCAD - Bullish Outlook | Weekly * Midterm Higher-Timeframe Bias:
USDCAD is bullish. HTF structure is clean — price has broken major and significant highs to the left, maintaining a clear bullish trajectory.
Mid-Term Structure:
Price initially disrespected the mid-term flow but landed into a HTF internal-framework structure zone.
• From here, we wait for a mid-term CHoCH (trend change)
• Once the CHoCH occurs and a new POI is refined, the plan is:
• Wait for mitigation
• Drop to lower timeframes to play continuations
Execution Approach:
This setup will take time to fully develop. Until then, we track price, follow the footprints, and remain aligned with structure.
Plan for the Week:
We stay patient and observe — let Smart Money lead the direction.
Structure first, entries second.
Patience is key. Follow the footprints. Let’s go.
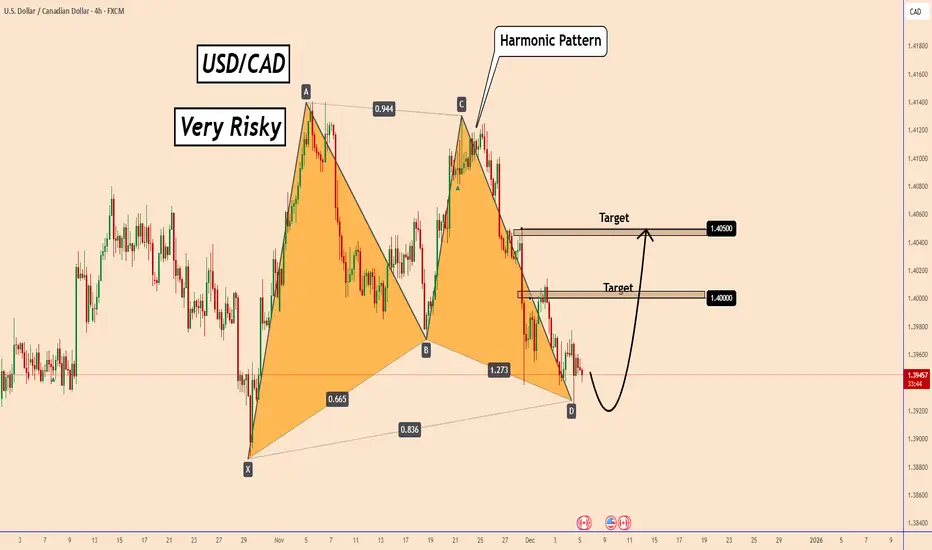
USDCAD: +400 Pips Selling Opportunity!Overview🧠
The USDCAD currency pair has reversed and a potential change in trend is occurring. Confirmation is required before a sell entry can be made. The only take profit is a swing move with a potential gain of approximately 400 pips. The stop loss can be placed above the higher high. Please like and comment for more.
Team Setupsfx

07-12-2025 _ Short Term Bearish Idea _ USDCAD H41- Double Top coupled with Divergence.
2- Followed by series of Lhs and LLs.
3- Bearish convergence on MACD indicator.
4- No Divergence against.
5- Therefore, after pullback one can expect a push to the down side.

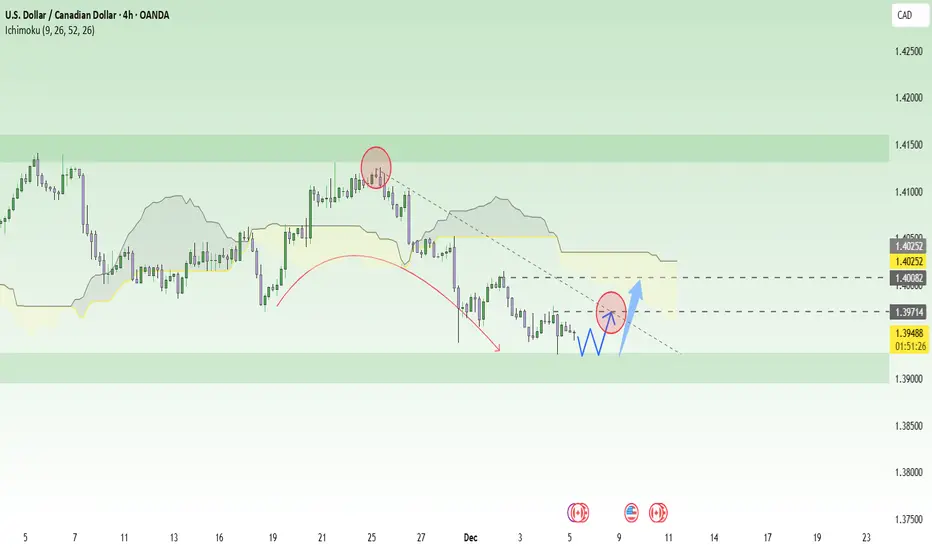
USDCAD – A “Soft Rebound” Forming at Defensive SupportUSDCAD is currently caught between two weak forces . On one side, the USD is losing momentum as markets almost fully expect the Fed to cut rates soon ; on the other side, the CAD isn’t strong either as Canada’s manufacturing data continues to weaken. These opposing forces neutralize each other, preventing a strong trend—but they do create room for a mild technical rebound from the current support zone.
On the H4 chart, USDCAD has slipped out of its upper consolidation range and gradually moved toward the support area around 1.3920, a level where price has reacted strongly multiple times before. The decline is slowing, with candles showing reduced volatility—signs that selling pressure is fading . Above, the zone around 1.3970, aligned with the lower edge of the Ichimoku cloud and the descending trendline, becomes a reasonable upside target for a rebound.
Preferred scenario: USDCAD may continue to test the floor near 1.3920, form a small accumulation pattern, then bounce for a light recovery toward 1.3970, possibly even sweeping slightly higher toward the cloud if USD sentiment stabilizes. However, this remains only a corrective move within a broader weakening structure. Therefore, the optimal approach is to look for short-term buys at support , take profits early at nearby resistance, and maintain strict risk management in a macro environment that remains highly uncertain.
USDCAD Will Go Higher! Long!
Take a look at our analysis for USDCAD.
Time Frame: 4h
Current Trend: Bullish
Sentiment: Oversold (based on 7-period RSI)
Forecast: Bullish
The market is on a crucial zone of demand 1.382.
The oversold market condition in a combination with key structure gives us a relatively strong bullish signal with goal 1.392 level.
P.S
Please, note that an oversold/overbought condition can last for a long time, and therefore being oversold/overbought doesn't mean a price rally will come soon, or at all.
Like and subscribe and comment my ideas if you enjoy them!
USDCAD - Breakout Will Flip the Trend BullishUSDCAD has been sliding inside a well-defined descending channel, completing a full five-wave drop toward the support zone. The structure from the top looks corrective rather than impulsive. That means the downtrend is weakening as it reaches its final leg.
Your count shows Wave 3 finishing at the dashed red line zone, followed by a small Wave 4 bounce, and now the market is pushing into the last Wave 5. This final drop is expected to target the Fibonacci levels near 1.3915 and 1.3895 . Nothing suggests strength until those levels are tested.
The price is still trapped inside the downward channel, and every bounce has been getting sold. That confirms sellers are still in control for now. Wave (C) is close to completion, but buyers haven’t proven anything yet.
The bullish outlook only becomes valid after a clean breakout above the channel. Without that break, any upside move is just noise inside a bearish structure. The breakout must hold with a higher low to confirm a trend reversal.
If the channel breaks decisively, a strong bullish reversal toward 1.40+ becomes possible. The entire structure suggests the downtrend is aging, so a major upside swing is likely once sellers exhaust. Until then, downside targets remain open and caution is necessary.
Stay Tuned!
@Money_Dictators

USD/CAD Recovers From a 2.5-Month LowUSD/CAD Recovers From a 2.5-Month Low
The main driver of the decline was a sharp shift in sentiment and diverging expectations for policy actions in the United States and Canada.
→ Canada: Friday’s employment data came in far stronger than forecast. As a result, traders sharply reduced the likelihood of a Bank of Canada rate cut at the next meeting, judging the economy resilient enough to pause its easing cycle.
→ United States: Markets are pricing in a high probability of a Federal Reserve rate cut at tomorrow’s meeting (22:00 GMT+3).
This contrast pushed USD/CAD to a 2.5-month low. However, the chart shows that the bulls may still have some grounds for optimism.
USD/CAD Technical Analysis
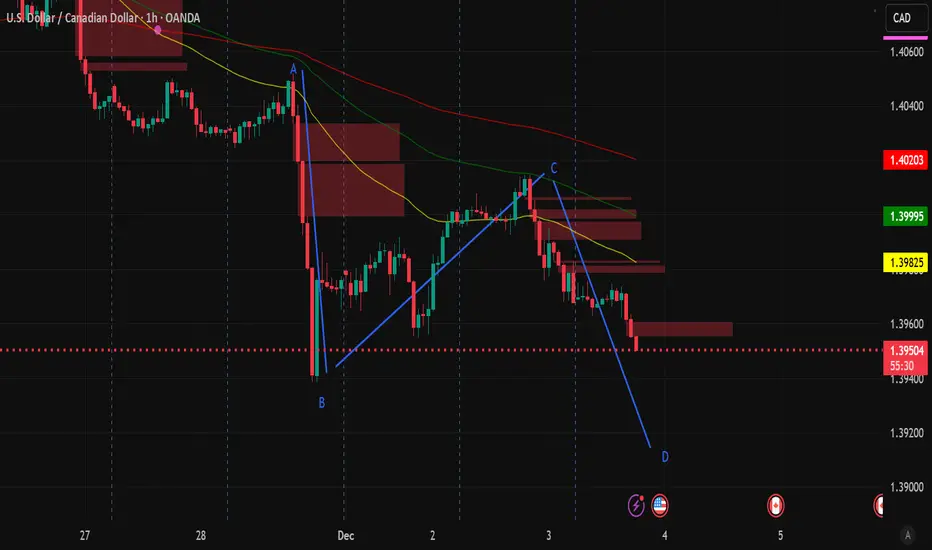
On 1 December we analysed the USD/CAD chart and:
→ drew an ascending channel (shown in blue) and noted several bearish signals;
→ suggested that the 1.4000 level would act as resistance in the near term, with bears likely to attempt to resume the downward move in USD/CAD.
Indeed, as the arrow indicates, the bears managed to restart the downtrend, which led to:
→ a breakout below the lower boundary of the channel;
→ the need to map out a descending trajectory (shown in red), with its median potentially acting as resistance going forward.
In this context, it is reasonable to assume that the bulls have some cause for hope in the short term, as:
→ the price is rebounding from the lower boundary of the red channel, indicating demand;
→ the RSI has risen from extreme oversold levels;
→ the candle highlighted by the second arrow looks bullish – it closed near the top of its range, forming a long lower shadow.
Given the above, traders should not rule out a corrective recovery in USD/CAD until the Federal Reserve releases its decision, which could significantly impact financial markets.
This article represents the opinion of the Companies operating under the FXOpen brand only. It is not to be construed as an offer, solicitation, or recommendation with respect to products and services provided by the Companies operating under the FXOpen brand, nor is it to be considered financial advice.

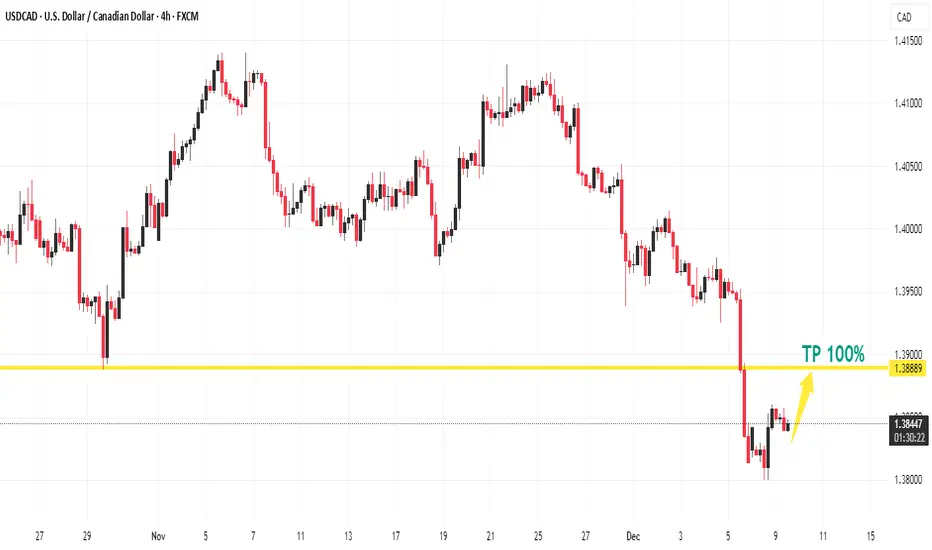
Us /Cad up !i am expecting a significant rise as price dropped closer to a support level.
TP 1.38880
USDCAD#USDCAD has reacted from demand and is climbing, but the bigger picture still favors the downside.
Price may push higher into the 1.4010–1.4040 supply area to gather liquidity before sellers take control again.
As long as price remains below that zone,
the downside target stays at the weak low waiting below.
Smart money moves in phases — not in straight lines.
This leg up may just be the refill before the drop.
Buy usdcad I was expecting a reversal today and it's been confirmed by a fair value gap on the 4hour timeframe. All the best and risk responsibly. Risk to reward is 1:3. Could be more
UASDCAD: Bearish! A Little Pullback, Then Down!The USD has been weakened over the past couple of weeks. Markets are at a 90% pchance the Fed cut rates by .25 bp, and that Trump will be installing Hasset, a loyalist, as Fed Chair. Couple that with the positive job numbers that Canada announced last week, and you see the downward trajectory of the USDCAD heading down.
It seems very likely that we will see more movement downtown this week.
I am expecting an OHLC candle for the week ahead.
The Draw on liquidity (DOL) would likely be the relative equal lows to the left.
May profits be upon you.
Disclaimer:
I do not provide personal investment advice and I am not a qualified licensed investment advisor.
All information found here, including any ideas, opinions, views, predictions, forecasts, commentaries, suggestions, expressed or implied herein, are for informational, entertainment or educational purposes only and should not be construed as personal investment advice. While the information provided is believed to be accurate, it may include errors or inaccuracies.
I will not and cannot be held liable for any actions you take as a result of anything you read here.
Conduct your own due diligence, or consult a licensed financial advisor or broker before making any and all investment decisions. Any investments, trades, speculations, or decisions made on the basis of any information found on this channel, expressed or implied herein, are committed at your own risk, financial or otherwise.

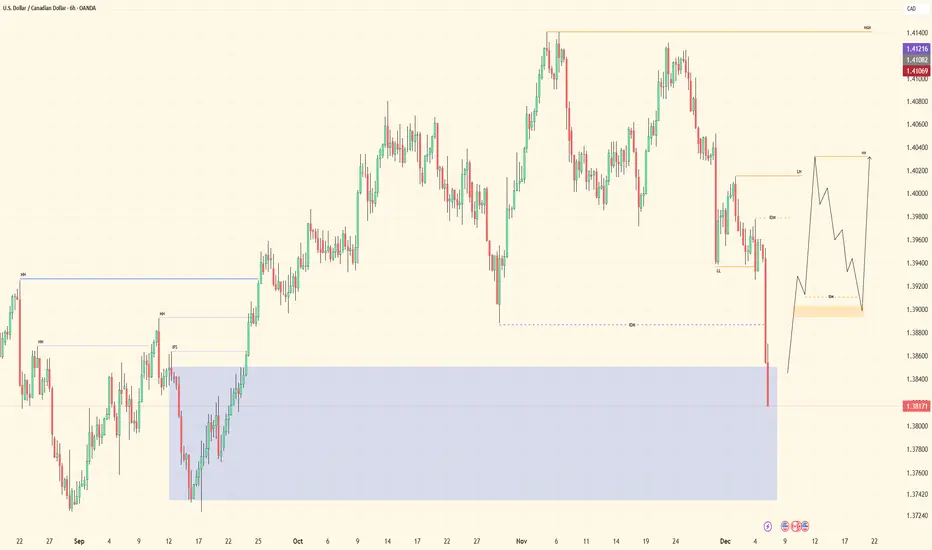
USD/CAD Pair structure and forecast.USD/CAD – Market Structure & Forecast
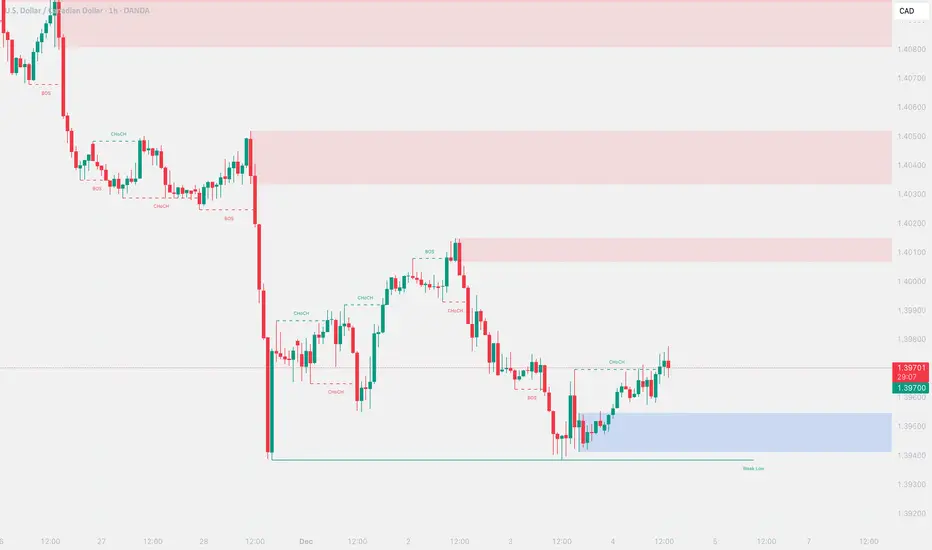
USD/CAD has completed a strong bearish leg, breaking structure (BOS) on the way down and forming a clear demand zone near support. Price has recently shown signs of accumulation, including internal CHoCH signals indicating a potential shift from bearish to bullish order flow.
Current structure shows:
Multiple CHoCH signals around the low, suggesting buyers are stepping in.
A corrective push upward followed by a pullback into a POI (Point of Interest).
The POI aligns with a small demand zone inside the larger support area.
A bullish BOS above this POI supports continuation to the upside.
Projection:
If price respects the POI and maintains bullish structure, USD/CAD may expand upward toward the major resistance zone above 1.39600.
Bias: Bullish (as long as support and POI hold)
Key Levels:
Support: Demand zone at the bottom of the chart
POI: Minor demand where the pullback is expected
Target: Higher resistance block above 1.3960
What you think about USD/CAD, write in the comment section.

USD/CAD Holds Support Into FOMC, BOCWith the BoC and FOMC meetings approaching, USD/CAD is likely to be caught in the crossfire. One-day implied volatility has surged, and the 1-week tenor now sits above the 1-month. While this sets the stage for two-way swings in the near term, a short-term bounce still looks possible before the broader decline resumes.
The pair has already seen a solid selloff ahead of the BoC on expectations of a hawkish hold. Strong US data could also give the Fed scope to deliver a hawkish, well-flagged 25bp cut.
USD/CAD is holding above the monthly S2 pivot and the September VPOC, leaving room for a retracement towards the 1.3880 low and monthly S1 pivot.
However, with yield differentials still pointing lower, bears may be inclined to fade any such bounce in anticipation of a move towards the August and September lows.
Matt Simpson, Market Analyst at City Index.

USDCAD bear trend in makingDIvergence on both MCAD and RSI is obvious and the price will follow bears

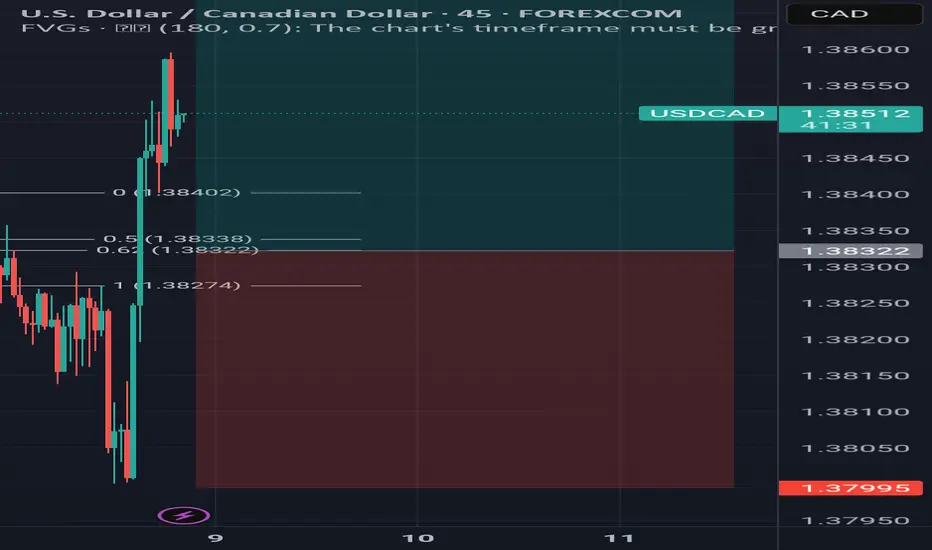
USD/CAD Short Level at 1.3858: Volume Cluster + FVG ConfluenceI’m watching USD/CAD for a pullback into a strong short level at 1.3858. This zone is defined by a heavy volume cluster formed during Friday’s downtrend, where sellers were likely building short positions. The level also aligns with the beginning of a fair value gap, adding extra strength. If the price pulls back into this area, I expect sellers to defend it and create a reaction.

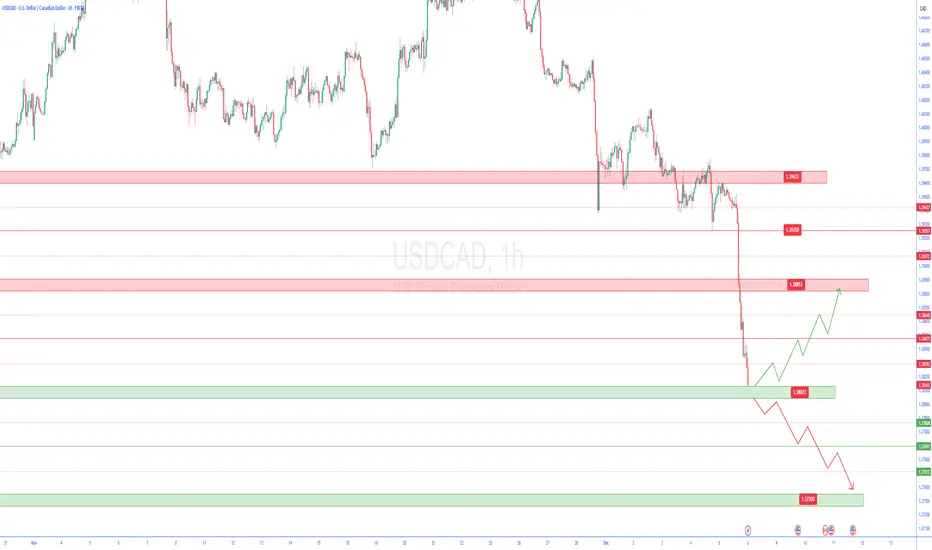
usdcad 1h🔹 Overall Outlook and Potential Price Movements
In the charts above, we have outlined the overall outlook and possible price movement paths.
As shown, each analysis highlights a key support or resistance zone near the current market price. The market’s reaction to these zones — whether a breakout or rejection — will likely determine the next direction of the price toward the specified levels.
⚠️ Important Note:
The purpose of these trading perspectives is to identify key upcoming price levels and assess potential market reactions. The provided analyses are not trading signals in any way.
✅ Recommendation for Use:
To make effective use of these analyses, it is advised to manually draw the marked zones on your chart. Then, on the 5-minute time frame, monitor the candlestick behavior and look for valid entry triggers before making any trading decisions.