USDCAD remains bullish, showing signs of strengtheningUSDCAD remains bullish, showing signs of strengthening. After a successful breakout, the pair has completed a minor correction phase, and price accumulation in the current zone suggests potential for further upside movement.
Although the U.S. dollar remains relatively weak in the broader context, the technical setup still favors the bulls. The main fundamental risk to USD strength at the moment comes from Donald Trump’s tariff policies, which could introduce volatility if escalated further. Additionally, the U.S. government shutdown, now in its second week, has so far had limited market impact.
Overall, the USD appears stronger than before, and as long as the price stays above key support levels, a bullish scenario remains in play. If bullish momentum continues, resistance near 1.40007 could be the next significant upside target.
You may find more details in the chart.
Trade wisely best of Luck.
Ps. Support with like and comments for more better analysis Thanks for Support.
USDCAD trade ideas

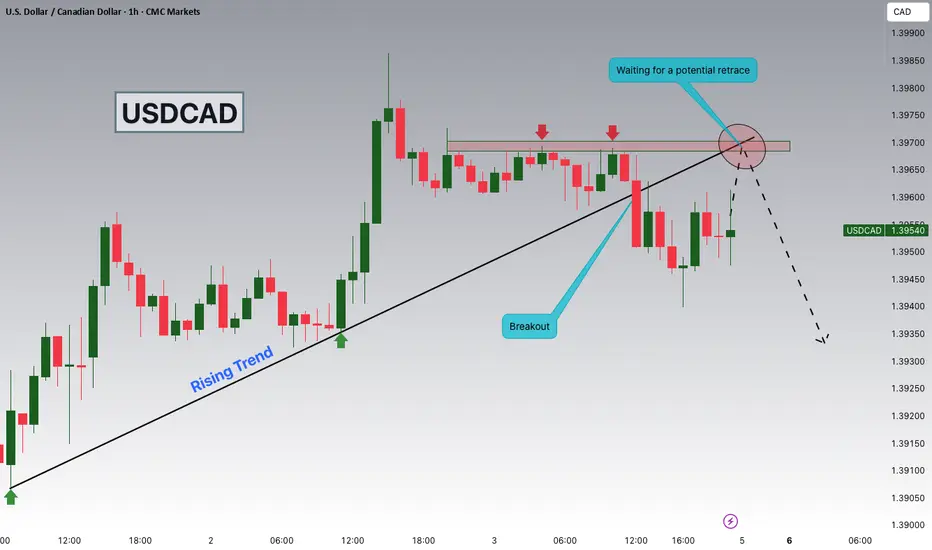
USDCAD Breakout and Potential RetraceHey Traders, in tomorrow's trading session we are monitoring USDCAD for a selling opportunity around 1.39700 zone, USDCAD was trading in an uptrend and successfully managed to break it out. Currently is in a correction phase in which it is approaching the retrace area at 1.39700 support and resistance area.
Trade safe, Joe.
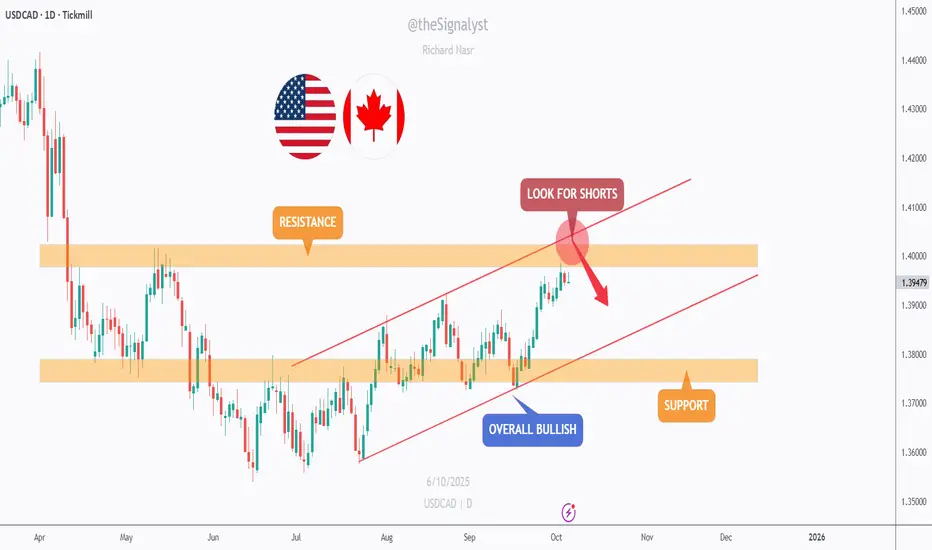
USDCAD – Testing a Major Resistance ZoneUSDCAD remains overall bullish, trading within a rising channel.
However, price is now approaching a key intersection between the upper trendline and a major resistance zone around 1.4000.
As price nears this confluence area, we’ll be looking for potential short opportunities, anticipating a possible rejection before any continuation higher.
The next support zone sits near 1.3750, where buyers might step back in if a pullback occurs.
⚠️ Disclaimer: This is not financial advice. Always do your own research and manage risk properly.
📚 Stick to your trading plan regarding entries, risk, and management.
Good luck! 🍀
All Strategies Are Good; If Managed Properly!
~Richard Nasr
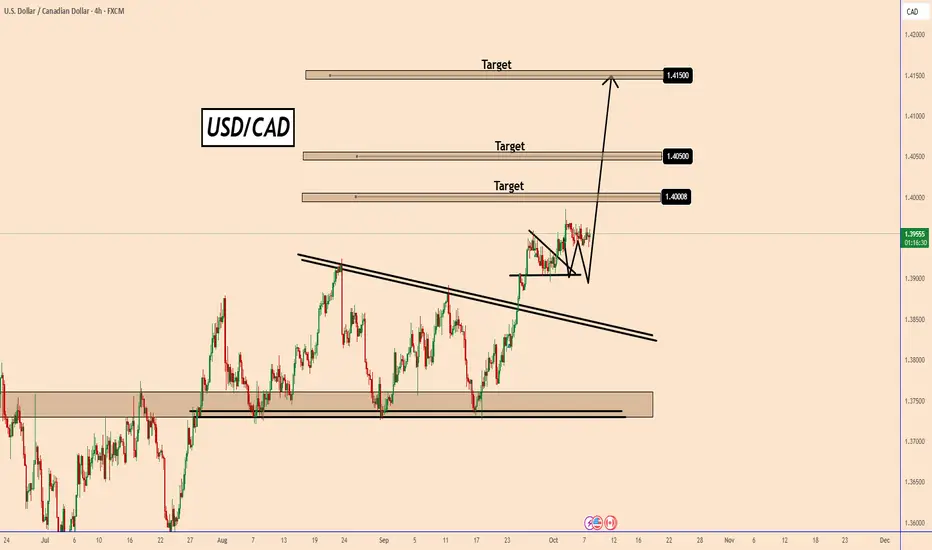
USDCAD: Bullish Momentum in Play-UpdateUSDCAD: Bullish Momentum in Play-Update
Price broke out above the descending trendline, showing bullish strength.
After the breakout, developed more and also completed a small bullish triangle pattern. USD is still weak but this price accumulation looks really good.
The only threat of the US dollar is Trump and the strange game he is playing with his tariffs.
Let's hope he will not make a bigger mess. The U.S government shutdown is on its second week and nothing happened. Overall, the USD is stronger than before.
Key Targets:
1.4000
1.4050
1.4150
As long as price stays above the large pattern, the bullish scenario remains valid.
You may find more details in the chart!
Thank you and Good Luck!
❤️PS: Please support with a like or comment if you find this analysis useful for your trading day❤️
USD/CAD Bulls Eye Pivotal ResistanceUSD/CAD is trading at key resistance into the start of the week at 1.3977/85- a region defined by the 2022 high, the May high-close and the 200-day moving average. Risk for possible inflection exhaustion / inflection off this zone in the days ahead.
Monthly open support rests at 1.3920 and is backed by the 2022 high-close / 2023 high at 1.3881/99. Broader bullish invalidation rests with the 61.8% retracement / September 11 reversal close at 1.3826/32 with a breach / daily close above the 38.2% retracement of the yearly range at 1.4019 needed to fuel the next major leg of the advance. Keep in mind we get the release of Canada employment data on Friday.
-MB

USD/CAD: Important Breakout📈USDCAD formed a high-momentum bullish candle yesterday, on a 4-hour time frame,
This candle closed above a significant horizontal resistance level.
The violated structure and a prominent ascending trend line now create a contracting demand zone, which is the area where the next bullish movement is anticipated to begin.
The subsequent resistance level is at 1.3986.

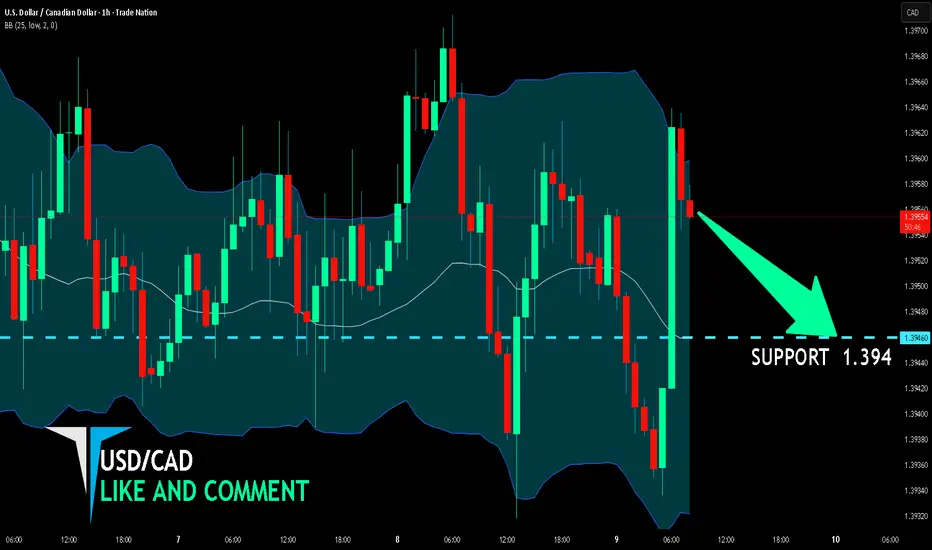
USD/CAD BEARS WILL DOMINATE THE MARKET|SHORT
Hello, Friends!
We are going short on the USD/CAD with the target of 1.394 level, because the pair is overbought and will soon hit the resistance line above. We deduced the overbought condition from the price being near to the upper BB band. However, we should use low risk here because the 1W TF is green and gives us a counter-signal.
Disclosure: I am part of Trade Nation's Influencer program and receive a monthly fee for using their TradingView charts in my analysis.
✅LIKE AND COMMENT MY IDEAS✅
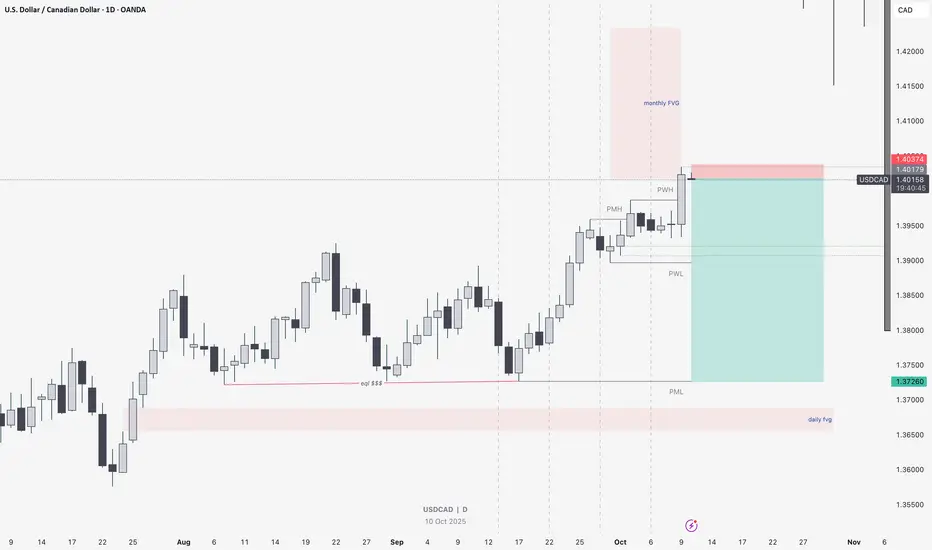
USD/CAD Short Setup from Monthly Fair Value Gap RejectionPrice has tapped into the monthly FVG (Fair Value Gap) around the 1.4050 area, aligning with a potential liquidity sweep above the previous week’s high (PWH).
If lower timeframes (H4 or H1) confirm a bearish shift in market structure or displacement, I’ll be looking for short entries targeting the previous monthly low (PML) at 1.3726, which also aligns with equal lows and a daily FVG resting below.
The setup idea follows the premise that the market has reached a premium level after engineering liquidity above the highs and is likely to rebalance towards the discount zone where liquidity and inefficiencies remain unfilled.
Confluence:
• Monthly FVG tapped
• Liquidity sweep above previous week’s high
• Potential bearish structure shift on lower timeframe
• Untapped daily FVG below at 1.37 zone
If price fails to show bearish confirmation and breaks cleanly above the monthly FVG, this idea becomes invalid.
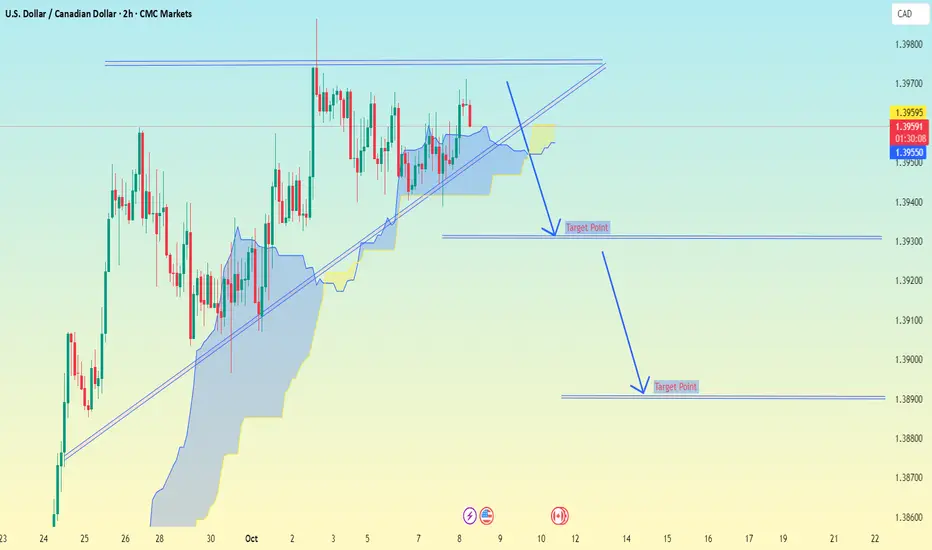
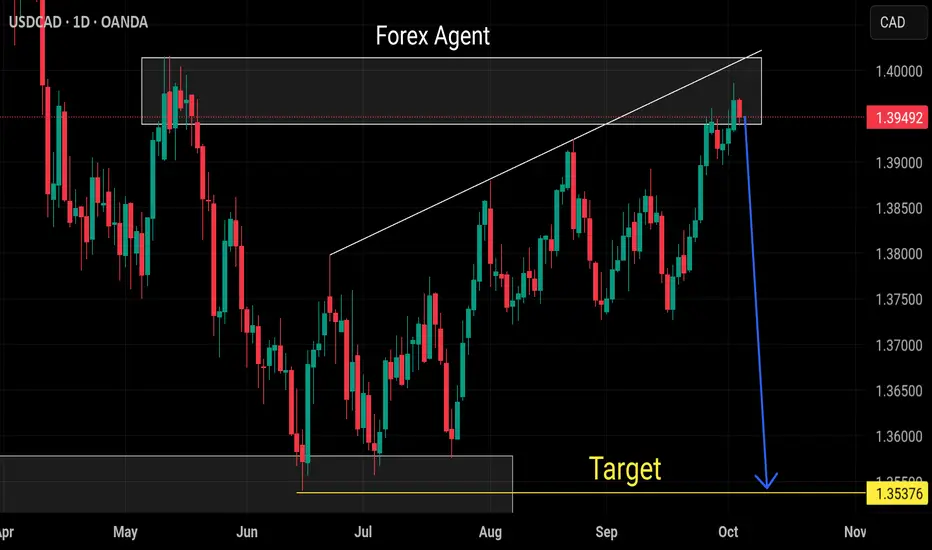
USDCAD (2H timeframe).USDCAD (2H timeframe).
From the technical setup shown:
Current price: 1.3995 approx.
A trendline break is being anticipated.
Two downside targets are already marked in my chart.
Targets:
1. First Target Zone → 1.3940 – 1.3935
(This is the first support level after the breakdown)
2. Second Target Zone → 1.3890
(This is the extended bearish target, next support level)
📉 If the price breaks below 1.3950 trendline, bearish continuation toward 1.3940 → 1.3890 looks possible.
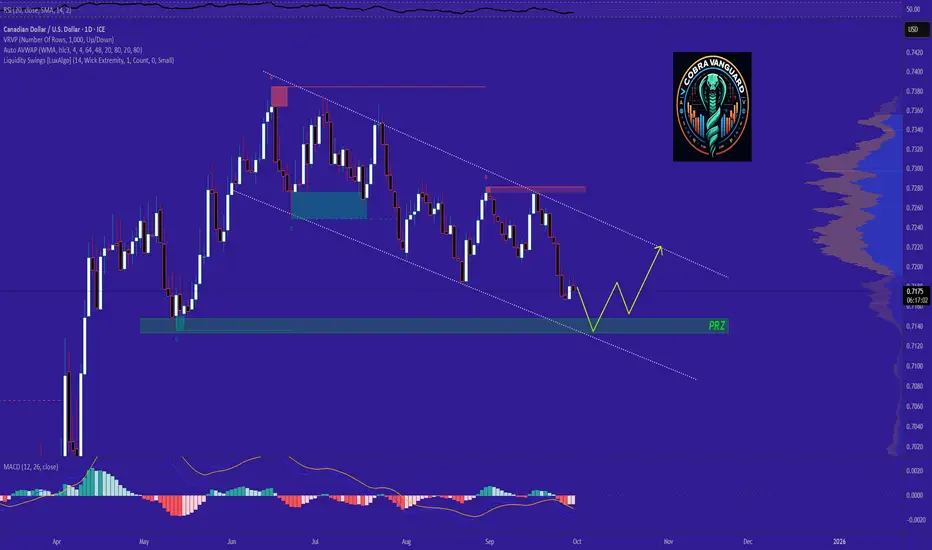
CADUSD → Bearish 𝐏𝐫𝐞𝐬𝐬𝐮𝐫𝐞 !!!As you can see, the price could drop to the bottom of the descending channel and then turn bullish. The PRZ (Potential Reversal Zone) is a good area for an upward move.
Strong sell usdcadStrong sell level reached
Upward resistance trend reached
Waiting to sweep high then sell with confirmation
USDCAD | Yield Gap Supports Wave (y) Push to 1.40
The U.S.–Canada yield spread has widened back toward 1.0%, reflecting hawkish Fed–dovish BoC divergence. This has underpinned broad USD strength and weighed on the CAD.
Technical Lens:
USDCAD has progressed into wave (y) of the corrective structure, breaking through interim resistance and testing the upper channel toward the 1.40 region. The structure remains constructive as long as the channel holds, with the Elliott count framing 1.40 as a key inflection point.
Scenarios:
If the yield gap continues to widen and the channel holds → potential extension to 1.40.
If spreads narrow and price rejects 1.40 → pullback toward mid-channel support near 1.37–1.38.
Catalysts:
U.S. economic data & Fed communication.
Canadian growth signals and BoC policy stance.
Oil price stability (limited CAD support so far).
Takeaway:
The 1.40 zone is the decision point where macro divergence and technical structure converge.

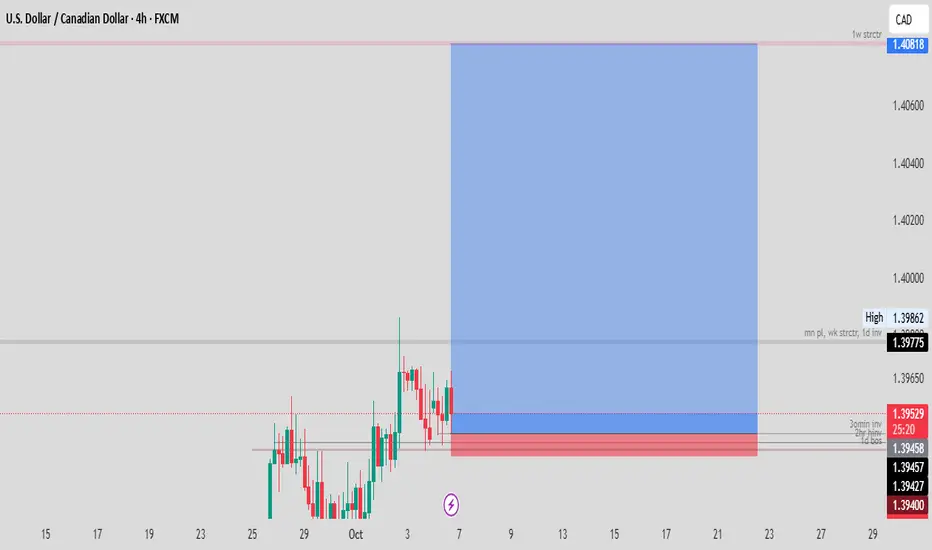
USDCAD, is it a confirmation entry?EURUSD Main Parameters
1. Monthly timeframe - Bullish
2. Weekly timeframe - Bullish
3. Daily timeframe - Bullish
4. Intraday timeframes - Bullish
Other Parameters
5. COT Data - CAD with main parameters
6. DXY Index - Beariosh with main parameters.
Confirmed Confluences
1d BOS Level, 4hr Hidden Invalidation, 2hr Hidden Invalidation,1hr Structural retest, 30min Invalidation.
Based on all these parameters and having 90% probability on our parameters; we executed a Long position risking not more than 10 Pips, targeting a 1:15+ at significant level where we are targeting to take our profits.
DISCLAIMER: You already Know.
USDCAD: H1 ConfluenceKey Observations
Daily Timeframe:
On Friday's close last week, price held above the daily level
This week's open indicate price is likely held supported
H1 Timeframe:
There's confluence on the H1 timeframe where price is crossing above the DTL
Price is also moving away from the EMA band, which indicates momentum could be picking up here

Evening Forecast on USDCAD 9/10/2025Hello, this is my evening Forecast on USDCAD. Curous for your feedback and guidance

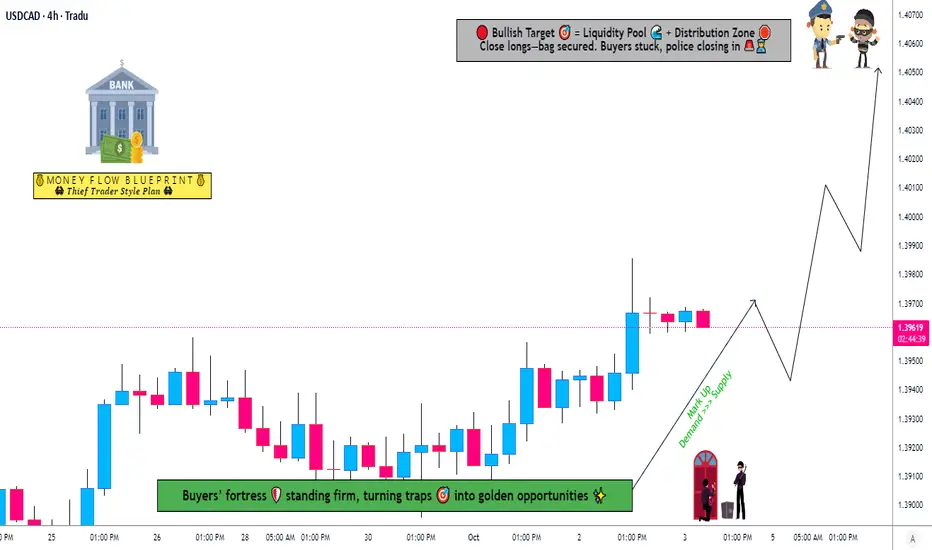
Trading Map for USD/CAD — Bullish Layered Entry Strategy🦒 The Loonie Heist: USD/CAD Swing & Day Trade Wealth Map 🚀
Asset: USD/CAD ("The Loonie")
Outlook: Bullish 📈
Vibe: Thief-Style Layering Strategy — Sneaky, Smart, and Stylish 😎
Welcome, Ladies and Gentlemen, to the Loonie Heist! This USD/CAD trading plan is designed for the crafty traders out there — our Thief OG's — ready to layer up entries and snatch profits like pros. Let’s break down this stylish, rule-compliant TradingView idea that’s ready to steal the spotlight! ✨
📜 The Plan: Bullish Breakout with a Thief’s Precision 🕵️♂️
Strategy: Thief Layering — A multi-limit order approach for smooth, calculated entries.
Entry Levels: Deploy your buy limit orders like a mastermind at:
1.39300
1.39400
1.39500
1.39600
Pro Tip: Feel free to add more layers based on your risk appetite — scale it up, Thief OG style!
Stop Loss (SL): Set a sneaky SL at 1.39000 to guard your loot.
Note: This is my suggested SL, but you’re the boss of your trades — adjust to your risk tolerance! ⚠️
Take Profit (TP): Aim for 1.40500, just shy of the 1.40600 police barricade (a strong resistance zone with overbought signals and potential traps). Lock in profits and escape like a pro! 🏃♂️ Note: TP is your call — take the money when it feels right!
🔍 Why USD/CAD? Key Market Insights 🧠
Market Context: USD/CAD is riding a bullish wave, driven by USD strength and CAD’s sensitivity to oil prices. Keep an eye on macroeconomic data like US Non-Farm Payrolls and Canadian employment reports, as they can sway the Loonie! 📊
Technical Setup: The pair is testing key support levels around 1.39300–1.39600, making it a prime spot for layered entries. The 1.40600 resistance is a historical hurdle, so watch for price action there! 🚨
Thief’s Edge: By layering buy limits, you’re stacking the odds in your favor, catching dips and riding the trend with finesse.
💰 Related Pairs to Watch 👀
Keep these correlated pairs on your radar to spot opportunities and confirm trends:
OANDA:USDCHF ($): Positive correlation with USD/CAD due to USD strength. If USD/CHF is climbing, it could signal more upside for USD/CAD.
OANDA:AUDUSD ($): Negative correlation with USD/CAD. A falling AUD/USD (stronger USD) often aligns with USD/CAD bullish moves.
OANDA:NZDUSD ($): Similar to AUD/USD, this pair’s weakness can support USD/CAD’s bullish case.
Key Point: Watch oil prices (WTI, Brent) since CAD is a commodity currency. If oil weakens, USD/CAD may push higher! 🛢️
⚠️ Risk Management (Thief’s Code) 🛡️
Risk Disclaimer: Trading is a high-stakes game, and this Thief-Style Strategy is for fun and educational purposes. Always manage your risk, set your own SL/TP, and trade responsibly. Don’t chase the market — let it come to you!
Position Sizing: Adjust your lot sizes based on your account and risk tolerance. The Thief OG never risks the whole vault! 💸
✨ “If you find value in my analysis, a 👍 and 🚀 boost is much appreciated — it helps me share more setups with the community!”
Disclaimer: This is a Thief-Style Trading Strategy crafted for fun and educational purposes. Trade at your own risk, and always conduct your own analysis.
#Hashtags: #USDCAD #Forex #SwingTrading #DayTrading #ThiefStrategy #LoonieHeist #Bullish #TradingView
USDCAD Rejected on its 1D MA200. Sell signal.Last time we looked at the USDCAD pair (August 21, see chart below), the Channel Up gave us an excellent sell signal right on its top, which easily hit our 1.37715 Target:
The market is currently giving us a strong signal yet again as the price not only hit the top of its Channel Up but also the 1D MA200 (orange trend-line) for the first time since May 13 2025.
That was the time it suffered a brutal rejection to multi-month lows and again upon testing it yesterday, it is being rejected.
With the 1D RSI also hitting its own Resistance Zone, we expect the price to pull-back to at least its 0.5 Fibonacci retracement level, similar to August 07. As a result, our short-term Target is 1.8570.
-------------------------------------------------------------------------------
** Please LIKE 👍, FOLLOW ✅, SHARE 🙌 and COMMENT ✍ if you enjoy this idea! Also share your ideas and charts in the comments section below! This is best way to keep it relevant, support us, keep the content here free and allow the idea to reach as many people as possible. **
-------------------------------------------------------------------------------
💸💸💸💸💸💸
👇 👇 👇 👇 👇 👇

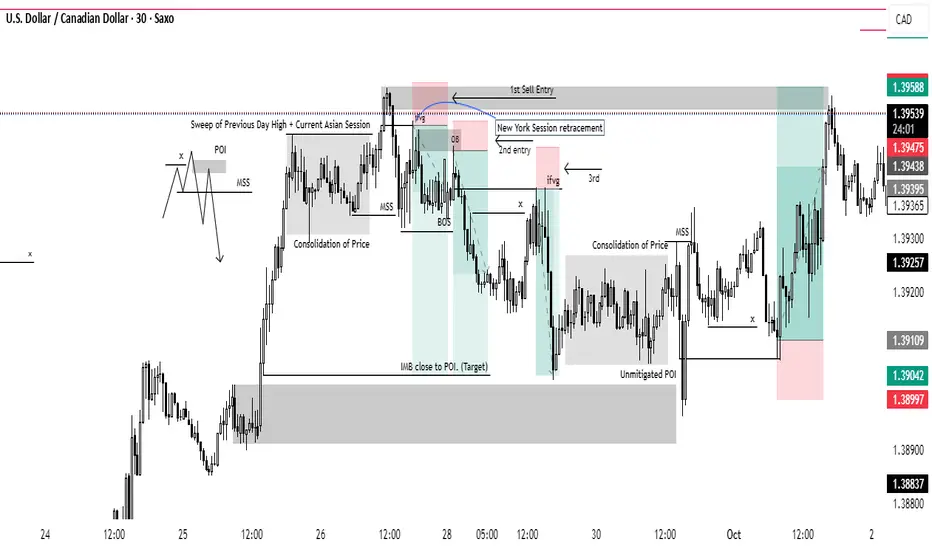
USDCAD perfect entry setups Beautiful entry setups spotted on USDCAD. Study the pattern!
Price was overall Bullish but Intra-day sell setups were spotted to get price down to another discount point of interest (POI) @1.39024 for continuous bullish trend.
London Session swept previous day's high and Asian session high then broke the last lower low causing a Market Structure Shift (MSS). This confirms that sellers are interested to take price lower. Retracement on New York Session at Inverse Fair Value Gap (ifvg) targeting the discount POI.
Second entry- OB mitigation the next week
3rd entry- ifvg mitigation while sweeping liquidity.
You can spot the same concept after mitigation of POI- Sweep of Price Consolidation + MSS + liquidity sweep + mini- demand targeting Previous high.
Go to your charts and practice this concept! Bye for now :)
USDCAD LONGWe are awaiting for the Retest of the bullish order block. if it does not get violated we enter at that point. Let see how it goes

USDCAD | Possible Reaction From Supply ZoneAs we kick off the new week, price action on USDCAD is currently reacting around a higher timeframe Supply Zone after an extended bullish leg from the recent equal lows (EQL). The pair has pushed into a premium pricing area, which often aligns with potential distribution zones where institutions may seek to offload positions.
We can observe a clean Break of Structure (BOS) to the upside, followed by a mitigation of imbalance (IMB). However, the recent rejection wicks within the supply zone may hint at early signs of exhaustion.
If price respects this supply area, we could see a move back toward the Hidden Base or Discount Zone, where fresh demand might step in. The area between 1.3690 – 1.3600 marks an interesting Major Demand Zone, which could serve as a re-accumulation point if bearish order flow takes over.
At this stage, it’s important to remain patient and observe how price behaves — whether the supply holds or if buyers manage to break through and continue the uptrend.
This is not a trade idea, just a possible outlook based on structure, liquidity, and supply-demand dynamics.

USDCAD H1 | Bearish Drop-Off in PlayUSD/CAD has reacted off the sell entry, which is a pullback resistance, and could drop from this level to the take profit.
Sell entry is at 1.3957, which is a pullback resistance level.
Stop loss is at 1.3975, which is a pullback resistance.
Take profit is at 1.3933, which is a pullback support.
High Risk Investment Warning
Trading Forex/CFDs on margin carries a high level of risk and may not be suitable for all investors. Leverage can work against you.
Stratos Markets Limited (tradu.com ):
CFDs are complex instruments and come with a high risk of losing money rapidly due to leverage. 65% of retail investor accounts lose money when trading CFDs with this provider. You should consider whether you understand how CFDs work and whether you can afford to take the high risk of losing your money.
Stratos Europe Ltd (tradu.com ):
CFDs are complex instruments and come with a high risk of losing money rapidly due to leverage. 66% of retail investor accounts lose money when trading CFDs with this provider. You should consider whether you understand how CFDs work and whether you can afford to take the high risk of losing your money.
Stratos Global LLC (tradu.com ):
Losses can exceed deposits.
Please be advised that the information presented on TradingView is provided to Tradu (‘Company’, ‘we’) by a third-party provider (‘TFA Global Pte Ltd’). Please be reminded that you are solely responsible for the trading decisions on your account. There is a very high degree of risk involved in trading. Any information and/or content is intended entirely for research, educational and informational purposes only and does not constitute investment or consultation advice or investment strategy. The information is not tailored to the investment needs of any specific person and therefore does not involve a consideration of any of the investment objectives, financial situation or needs of any viewer that may receive it. Kindly also note that past performance is not a reliable indicator of future results. Actual results may differ materially from those anticipated in forward-looking or past performance statements. We assume no liability as to the accuracy or completeness of any of the information and/or content provided herein and the Company cannot be held responsible for any omission, mistake nor for any loss or damage including without limitation to any loss of profit which may arise from reliance on any information supplied by TFA Global Pte Ltd.
The speaker(s) is neither an employee, agent nor representative of Tradu and is therefore acting independently. The opinions given are their own, constitute general market commentary, and do not constitute the opinion or advice of Tradu or any form of personal or investment advice. Tradu neither endorses nor guarantees offerings of third-party speakers, nor is Tradu responsible for the content, veracity or opinions of third-party speakers, presenters or participants.

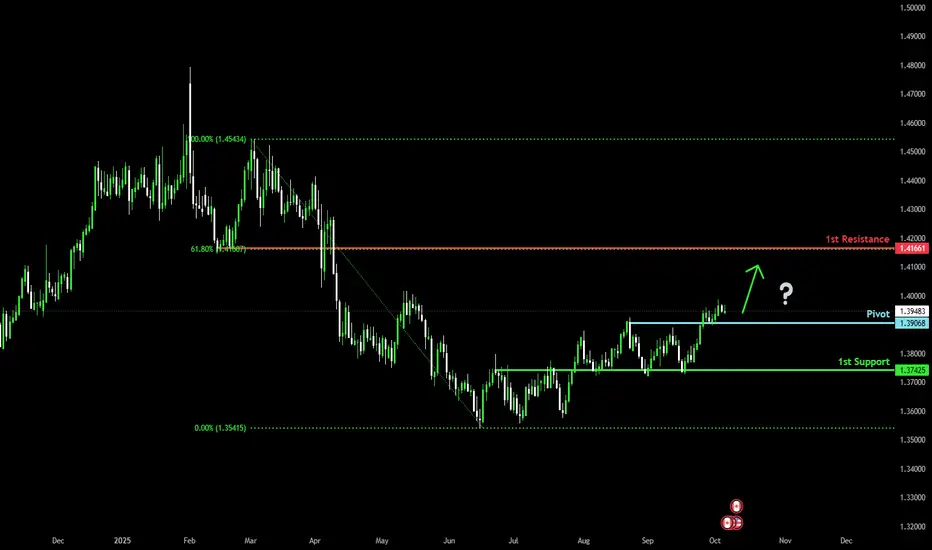
Bullish momentum set to continue?The loonie (USD/CAD) is falling towards the pivot and could bounce to the 61.8% Fibonacci resistance.
Pivot: 1.3906
1st Support: 1.3742
1st Resistance: 1.4166
Disclaimer:
The above opinions given constitute general market commentary, and do not constitute the opinion or advice of IC Markets or any form of personal or investment advice.
Any opinions, news, research, analyses, prices, other information, or links to third-party sites contained on this website are provided on an "as-is" basis, are intended only to be informative, is not an advice nor a recommendation, nor research, or a record of our trading prices, or an offer of, or solicitation for a transaction in any financial instrument and thus should not be treated as such. The information provided does not involve any specific investment objectives, financial situation and needs of any specific person who may receive it. Please be aware, that past performance is not a reliable indicator of future performance and/or results. Past Performance or Forward-looking scenarios based upon the reasonable beliefs of the third-party provider are not a guarantee of future performance. Actual results may differ materially from those anticipated in forward-looking or past performance statements. IC Markets makes no representation or warranty and assumes no liability as to the accuracy or completeness of the information provided, nor any loss arising from any investment based on a recommendation, forecast or any information supplied by any third-party.
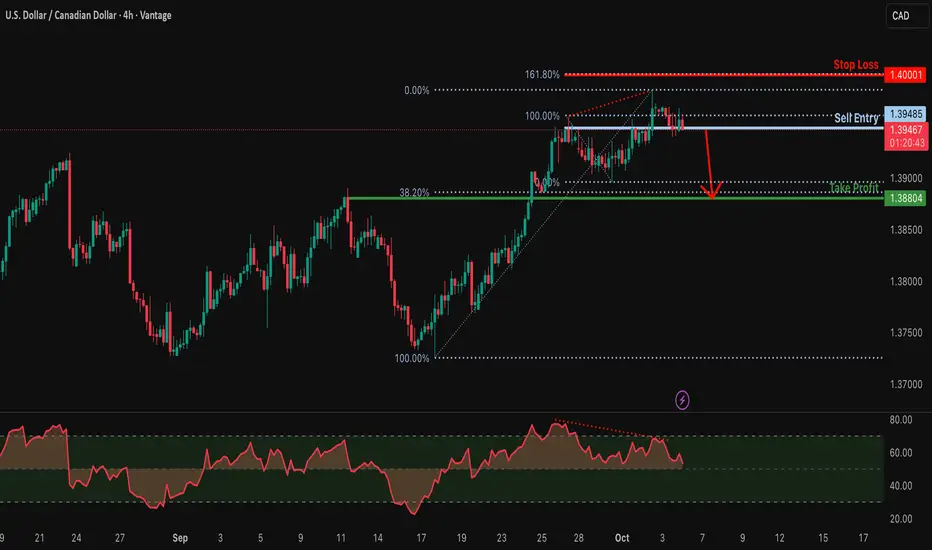
Potential bearish reversal for the Loonie?The price is reacting off the resistance level which is a pullback resistance, and could drop from this level to our take profit.
Entry: 1.3948
Why we like it:
There is a pullback resistance.
Stop loss: 1.4000
Why we like it:
There is a resistance level which aligns with the 161.8% Fibonacci extension.
Take profit: 1.3880
Why we like it:
There is a pullback support level which lines up with the 38.2% Fibonacci retracement.
Enjoying your TradingView experience? Review us!
Please be advised that the information presented on TradingView is provided to Vantage (‘Vantage Global Limited’, ‘we’) by a third-party provider (‘Everest Fortune Group’). Please be reminded that you are solely responsible for the trading decisions on your account. There is a very high degree of risk involved in trading. Any information and/or content is intended entirely for research, educational and informational purposes only and does not constitute investment or consultation advice or investment strategy. The information is not tailored to the investment needs of any specific person and therefore does not involve a consideration of any of the investment objectives, financial situation or needs of any viewer that may receive it. Kindly also note that past performance is not a reliable indicator of future results. Actual results may differ materially from those anticipated in forward-looking or past performance statements. We assume no liability as to the accuracy or completeness of any of the information and/or content provided herein and the Company cannot be held responsible for any omission, mistake nor for any loss or damage including without limitation to any loss of profit which may arise from reliance on any information supplied by Everest Fortune Group.