USD/CAD - Fundamental Drives (13.11.2025)🧠 Setup Overview OANDA:USDCAD
USD/CAD continues to face strong rejection from the resistance zone, with price failing multiple times to break above the 1.4020–1.4045 supply area.
The market structure remains bearish as the pair forms lower highs and struggles to sustain upside momentum.
With fundamentals also favoring CAD strength, the downside scenario remains more probable.
📊 Trading Plan🔻 Sell Bias
Look for bearish confirmation near or below the resistance zone
Continuation to the downside expected toward key support levels
🎯 Targets:
1st Support: 1.3969
2nd Support: 1.3950
🔰 Resistance Zone: 1.4020 – 1.4045
⚡ Fundamental Updates (Today – 13 Nov 2025)
1️⃣ Bank of Canada (BoC) signaled no further interest rate cuts, which strengthened the CAD.
• A stable or moderately hawkish BoC typically supports CAD appreciation.
2️⃣ US Treasury yields continue to fall as markets increase bets on the Federal Reserve easing policy in the coming months.
• Lower yields = weaker USD, helping push USD/CAD lower.
📌 High Impact Event Today:
USD - CPI (Inflation Rate) → A softer CPI reading could accelerate USD weakness.
#USDCAD #Forex #TechnicalAnalysis #PriceAction #ResistanceZone #FXMarket #FundamentalAnalysis #ChartPatterns #KABHI_TA_TRADING #ChartsDontLieTradersDontQuit #USD #CAD #TradingView #ForexSignals #BearishSetup #IntradayTrading
⚠️ Disclaimer
This analysis is for education only. It is not financial advice.
Always apply proper risk management and trade based on your own confirmation.
💬 Support My Work ❤️
If this analysis helps you —👉 LIKE 👍 👉 COMMENT 💬 👉 FOLLOW 🔔
Your support motivates more daily chart breakdowns and setups!
Trade ideas

USD/CAD) Bearish trend analysis Read The captionSMC Trading point update
Technical analysis of USD/CAD on the 1-hour timeframe. Let’s break down the analysis idea clearly:
---
l Market Context
The overall trend is bearish, as price is trading below both the 50 EMA and 200 EMA, which are sloping downward.
The recent bullish correction appears to have been a retracement within the broader downtrend.
---
Key Technical Insights
1. Bearish Structure:
Price broke below a previous low and confirmed a lower low (LL).
A small bearish flag or rising channel formed during the retracement — a common continuation pattern.
2. Supply Zone (Blue Box):
This zone represents the previous demand turned supply, where sellers re-entered strongly.
Price tapped into this area and sharply rejected, confirming supply dominance.
3. EMA Confluence:
Both EMA(50) and EMA(200) are above price, acting as dynamic resistance.
The rejection from the blue zone occurred around EMA confluence — a strong bearish confirmation signal.
---
Projected Price Action
The structure suggests a minor pullback (to form a lower high) before continuing downward.
The drawn path shows price retesting a small intraday resistance area before resuming the drop.
Target Point: 1.39689 — near the next structural low / liquidity area.
---
Trade Idea Summary
Bias: Bearish continuation
Entry Zone: 1.4010–1.4030 area (retest of minor resistance or broken structure)
Target: 1.3969
Stop-Loss: Above 1.4048 (above supply zone / EMAs)
Risk/Reward Ratio: Approx. 1:2.5 to 1:3 potential setup
Mr SMC Trading point
---
Concept Summary
This setup follows Smart Money Concepts (SMC) logic:
Break of structure → Retracement into supply → Continuation in direction of the higher timeframe trend.
---
Please support boost 🚀 this analysis

USDCAD: Institutions Accumulating? Perfect Pullback Into FVG1. MACRO & COT FRAMEWORK
COT – CAD
→ Speculators remain heavily net short on CAD.
The Canadian dollar shows a massive net-short imbalance, exceeding 100k net contracts.
Speculators are still selling CAD aggressively → supportive for upside continuation on USD/CAD.
COT – USD
→ USD is still net short overall, but positioning is shifting.
The dollar is beginning to reverse positioning: fewer shorts + more longs = improving USD strength.
→ Overall COT environment favors further upside for USD/CAD.
2. RETAIL SENTIMENT
Retail Longs: 51%
Retail Shorts: 49%
Retail is almost evenly split, slightly long.
This is mostly neutral, but historically, when sentiment is balanced, price tends to follow institutional flows → which remain long USD/CAD.
Sentiment confirms a bullish bias.
3. SEASONALITY (USD/CAD – November)
November is historically a slightly bullish month for USD/CAD.
The 20-year, 15-year, and 10-year composites all show a positive seasonal tendency.
The current month is tracking a similar pattern.
Seasonality supports a long bias into the second half of November.
4. TECHNICAL ANALYSIS
The pair remains in a structurally bullish uptrend with a clean ascending channel.
Higher highs and higher lows confirm trend integrity.
Price is currently correcting toward the mid-range of the channel.
The market is entering a Daily FVG between 1.3950 – 1.3980.
A prior sweep has already tapped the lower trendline, adding confluence.
Immediate Support Zone
1.3950 – 1.3980 (FVG + structural support)
→ ideal area for long accumulation.
Upside Target:
1.41500 → clear liquidity level above previous swing high.
RSI remains above 40 and cooling off, indicating a healthy pullback within a bullish trend.

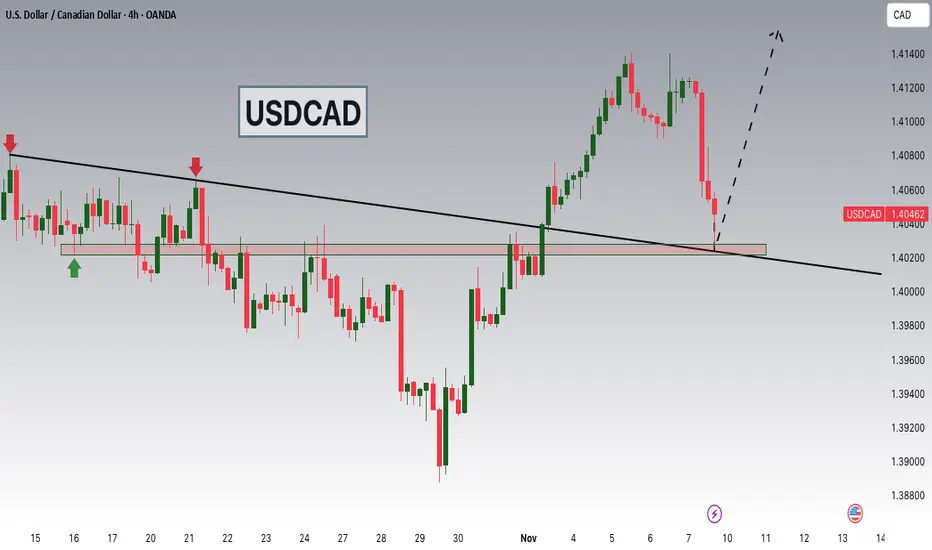
USD/CAD: Breakout Alert: 2 Strong Bullish Patterns Say YesAs you can see, 📈USDCAD is resuming its growth.
After completing a bullish accumulation, the price is currently breaking both the neckline of an ascending triangle and of an inverted head and shoulders formation on a 4H timeframe.
I anticipate that the price will continue to rise and reach the 1.4070 resistance soon.

USDCAD Ascending channel pattern buy on consolidation breakoutUSOIL Technical Outlook – 4H Timeframe
USOIL continues to show strong downside momentum, with sellers maintaining control. Price is currently respecting the downtrend structure, and a consolidation breakdown below 59,100 is confirming further bearish pressure.
📉 Key Technical Levels:
Immediate Support: 58,300
Next Major Support: 56,400
As always, ensure you are using proper risk management and wait for clear confirmations before entering any position.
👍 Like • Follow • Comment • Share
Stay updated for more professional market insights.

USDCAD: Move Up Expected 🇺🇸🇨🇦
USDCAD will likely bounce from the underlined support cluster.
A formation of a bullish imbalance candle on that on a daily time frame
suggests a strong buying pressure.
Expect a rise at least to 1.4089
❤️Please, support my work with like, thank you!❤️
I am part of Trade Nation's Influencer program and receive a monthly fee for using their TradingView charts in my analysis.

USDCAD - Bulls Preparing to Reload!📈USDCAD has been moving within a clear ascending channel, maintaining a well-defined bullish structure over the past months.
After rejecting the upper bound, price is now pulling back toward a key confluence area, the intersection of the orange support zone and the lower trendline of the channel.
🏹This zone is crucial, as it has acted as a strong demand area in the past, where buyers consistently regained control. From here, I’ll be looking for long setups, aiming for a continuation toward the upper bound of the channel once more.
⚔️As long as the price holds above the orange zone, the overall bullish momentum remains intact.
⚠️ Disclaimer: This is not financial advice. Always do your own research and manage risk properly.
📊All Strategies Are Good; If Managed Properly!
~Richard Nasr

USDCAD uptrend still holdingUSDCAD uptrend still looks strong, I am looking for long entries in 2 different scenarios. If the current November low holds at 1.39854 and that is the low for the month, I would put my risk there. If it doesn't hold and creates a new November low but the low of October hold at 1.38877 would need to hold. In both those scenarios I remain bullish
looking for entires to the upside. Only if the October low breaks will I think reevaluate my bullish view. OANDA:USDCAD


USD/CAD) Bullish trend analysis Read The captionSMC Trading point update
Technical analysis of USD/CAD 4-hour timeframe, based on Smart Money Concepts (SMC) and Fibonacci retracement confluences.
Here’s a full breakdown of the idea behind this analysis:
---
Overall Bias: Bullish Continuation
The chart suggests that USD/CAD is in an uptrend, currently undergoing a corrective pullback into a key discount zone (buy area) before potentially continuing higher toward the next liquidity target.
---
Technical Breakdown
1. Trend Context
The pair recently broke structure to the upside, indicating a bullish shift in market structure (MSB).
Price has been forming higher highs and higher lows, confirming bullish order flow.
The 50 EMA (blue) and 200 EMA (black) are aligned in bullish order — 50 EMA above 200 EMA — signaling overall bullish momentum.
2. Retracement / Discount Zone
Price is currently pulling back after a bullish impulse.
The blue box zone represents a discount buy zone between 0.62–0.79 Fibonacci retracement levels.
The green arrow marks the expected reversal area, showing potential demand and liquidity accumulation before continuation.
Confluence:
200 EMA support
0.62–0.79 Fibonacci zone
Prior structure / demand zone
3. Projected Price Path
The price is expected to:
1. Dip into the discount zone (1.3980–1.3950 area).
2. Find bullish rejection / confirmation from that zone.
3. Reverse upward, targeting 1.42135 (the next liquidity / target point).
4. Target Point
The target at 1.42135 aligns with:
Prior swing high (liquidity zone).
Fibonacci extension completion.
Potential imbalance fill.
---
Market Structure Summary
Element Direction Key Levels
Market Bias Bullish
Demand Zone (Buy Area) 1.3980 – 1.3950 0.62–0.79 fib confluence
Support Confluence 200 EMA + Demand Zone
Entry Zone Bullish reaction from blue zone
Target 1.4213 Liquidity target
---
Trade Idea (Conceptually)
Wait for price to reach the blue demand zone and show a bullish confirmation candle or structure shift.
Then consider a long entry with:
Entry: Around 1.3980–1.3960
Stop-loss: Below 1.3930 (beneath zone)
Take-profit: Around 1.4213
Mr SMC Trading point
---
Narrative Summary
> This setup expects a bullish continuation following a corrective retracement into a high-probability demand area. The confluence of Fibonacci discount levels, EMAs, and structure support strengthens the case for buyers to rejoin the trend, targeting liquidity above 1.4213.
---
Please support boost 🚀 this analysis

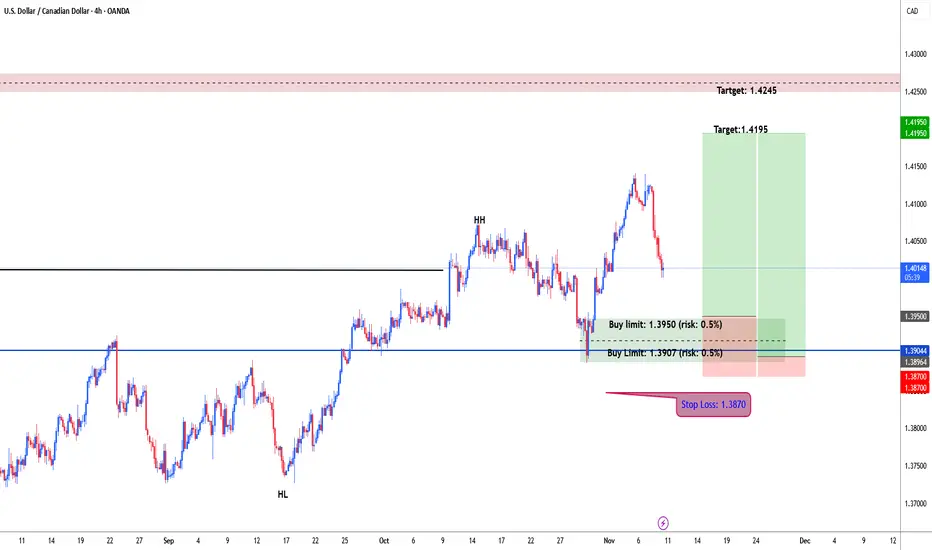
USDCAD possible bullish for 1.4195 & 1.4245#usdcad daily chart forming higher high and higher low. usdcad price broke and closed above 1.4016. wait for correction and test demand zone for another leg higher. i placed my orders at 1.3950 & 1.3906 each with 0.5% risk. stop loss: 1.3870. target: 1.4195 & 1.4245 as well.
USDCAD: Consolidation Continues 🇺🇸🇨🇦
I think that sideways price action will continue on USDCAD.
The price is going to pull back from an intraday support at least
one more time.
Expect a rise at least to 1.4027 level.
❤️Please, support my work with like, thank you!❤️
I am part of Trade Nation's Influencer program and receive a monthly fee for using their TradingView charts in my analysis

USDCAD - Bullish Continuation Using Multiple Forms of DivergenceHere on the USDCAD we have a bullish continuation trade which represents a perfect example of how countertrend & trend continuation trading can be used together.
Following a violation of our most recent level of structure price has given us a pullback and a double bottom which I used for my reason for entry into the trade.
Other forms of confluence come from psychological numbers, Fibonacci levels & both hidden and regular divergence on the RSI.
If you have any questions or comments please leave them below.
Akil

USDCAD: Bullish Bias Remains 🇺🇸🇨🇦
USDCAD will likely grow more,
following a test and a strong pullback from the underlined
daily support cluster.
Expect a rise at least to 1.4089
❤️Please, support my work with like, thank you!❤️
I am part of Trade Nation's Influencer program and receive a monthly fee for using their TradingView charts in my analysis.

USDCAD: BUY in 30TF - SL : 1.4046030Min Trading - Improve 70% Winning Rate.
USDCAD : BUY Break out the Box in M30
Multiple MA - 26 and 50 in M30
SL : 1.40460
TP : 1.40767 / 1.41160
Good Luck.

USDCAD Bearish FlagThe retest setup of that inverse head and shoulders pattern is finally playing out and now we also have double confluence thanks to that bear flag.
Less Yap, More Trades

USDCAD 4HPrice broke out of the falling channel bullish reversal pattern after making a bullish reaction off the 4 hour order block (orange zone), breaking the lower timeframe structure to the upside forming a higher high. Price has now made a pullback for a higher low, where I will be anticipating for a bullish continuation to resume the higher timeframe trend aiming for the zones above.

USD/CAD Hints at Swing LowA simple setup may have emerged for USD/CAD bulls. A bullish outside day formed around a support cluster on Thursday, which includes the 1.40 handle, monthly pivot point and weekly VPOC. It also posted a daily close above its 20-day EMA.
The 1-hour chart shows a bullish divergence formed on the RSI (14) ahead of yesterday's rally, with price action displaying a falling wedge (bullish reversal) into the cycle lows.
Bulls could seek dips towards the 1.4005 high-volume node (HVN) and initially target the weekly pivot point (1.4062), a break above which brings the 1.41 handle into focus.
A break beneath the cycle lows invalidates the near-term bullish bias.
Matt Simpson, Market Analyst at City Index.

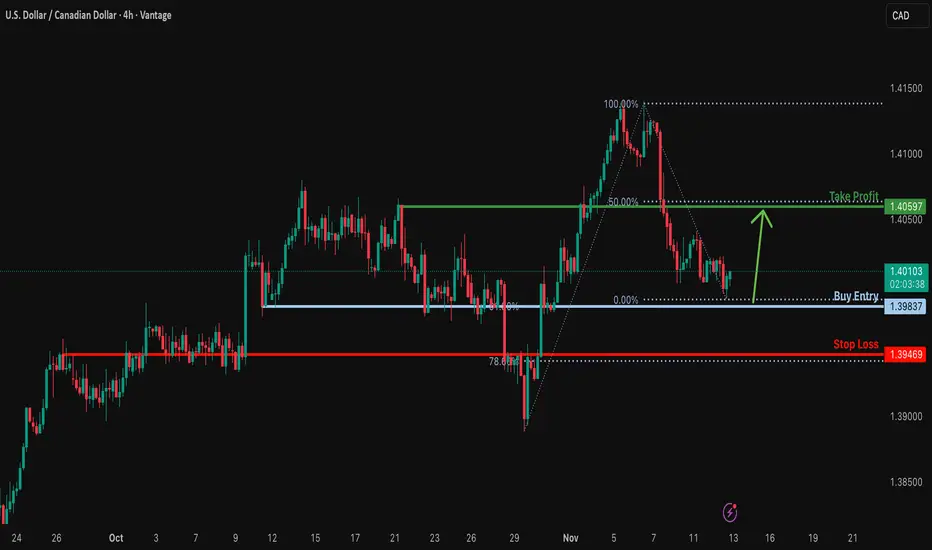
Bullish bounce off key support?USD/CAD is falling towards a support level, which is an overlap support that aligns with the 61.8% Fibonacci retracement. The pair could potentially bounce from this level toward our take-profit target.
Entry: 1.3983
Why we like it:
There is an overlap support that aligns with the 61.8% Fibonacci retracement level.
Stop Loss: 1.3946
Why we like it:
This level coincides with an overlap support and the 78.6% Fibonacci retracement, providing additional confluence.
Take Profit: 1.4059
Why we like it:
There is a pullback resistance that aligns with the 50% Fibonacci retracement level.
Enjoying your TradingView experience? Review us!
Please be advised that the information presented on TradingView is provided to Vantage (‘Vantage Global Limited’, ‘we’) by a third-party provider (‘Everest Fortune Group’). Please be reminded that you are solely responsible for the trading decisions on your account. There is a very high degree of risk involved in trading. Any information and/or content is intended entirely for research, educational and informational purposes only and does not constitute investment or consultation advice or investment strategy. The information is not tailored to the investment needs of any specific person and therefore does not involve a consideration of any of the investment objectives, financial situation or needs of any viewer that may receive it. Kindly also note that past performance is not a reliable indicator of future results. Actual results may differ materially from those anticipated in forward-looking or past performance statements. We assume no liability as to the accuracy or completeness of any of the information and/or content provided herein and the Company cannot be held responsible for any omission, mistake nor for any loss or damage including without limitation to any loss of profit which may arise from reliance on any information supplied by Everest Fortune Group.
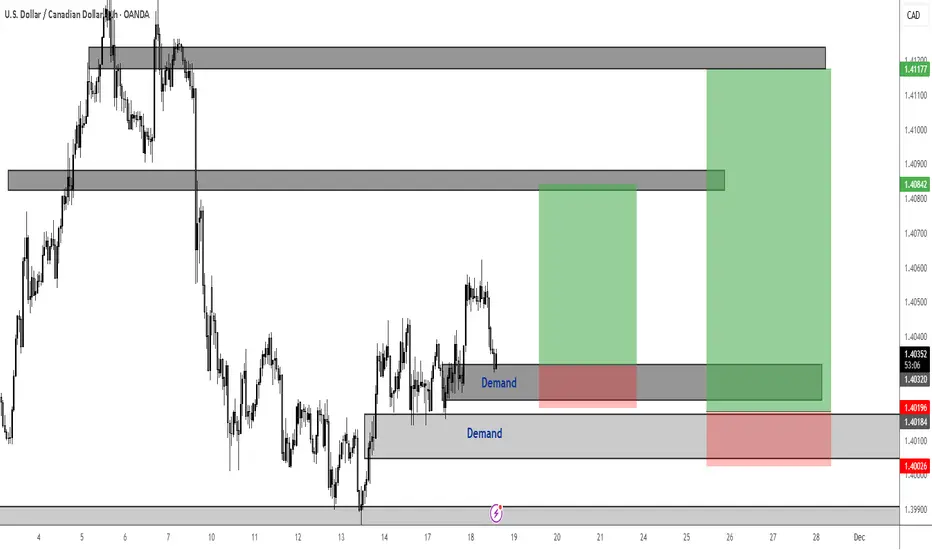
USDCAD Consistent Demand Zone - Bullish ConfluenceNow that DXY has officially broken out to the upside of that falling wedge, I am seeing strong bullish confirmations on USDXXX pairs.
My bias on USDCAD is bullish.
USDCAD Breakout and Potential RetraceHey Traders, in tomorrow's trading session we are monitoring USDCAD for a buying opportunity around 1.40250 zone, USDCAD was trading in a downtrend and successfully managed to break it out. Currently is in a correction phase in which it is approaching the retrace area at 1.40250 support and resistance area.
Trade safe, Joe.
USDCAD Resistance Ahead!
HI,Traders !
#USDCAD keeps going up
And the pair is locally oversold
So after it hits the horizontal
Resistance of 1.40666 we
Will be expecting a local
Bearish correction !
Comment and subscribe to help us grow !

USD/CAD Price Outlook – Trade Setup (USD/CAD)📊 Technical Structure
OANDA:USDCAD USD/CAD remains supported above 1.4014–1.4019, a key intraday demand zone that has supported price multiple times over the past sessions. Price is attempting a rebound from this support area, pushing back toward the 1.4040–1.4045 intraday pivot.
A sustained move above 1.4050 may open room for a continuation toward the resistance zone at 1.4066–1.4072, which aligns with previous supply and structural highs on the 30M chart. Failure to hold 1.4010 would invalidate the bullish setup and expose downside risk toward 1.3980.
Overall, price action favours a buy-the-dip structure as long as the support zone remains intact.
🎯 Trade Setup
Idea: Buy from support zone for continuation toward resistance.
Entry: 1.4014 – 1.4019
Stop Loss: 1.4011
Take Profit 1: 1.4066
Take Profit 2: 1.4072
Risk–Reward Ratio: ≈ 1 : 6.46
Bias remains short-term bullish while the pair trades above 1.4010.
🌐 Macro Background
USD/CAD extends modest gains around 1.4030–1.4050 during Monday’s Asian session as the Canadian Dollar weakens alongside declining crude oil prices.
According to FXStreet, “USD/CAD holds gains near 1.4050 as lower crude Oil prices weigh on the Canadian Dollar.” 【FXStreet】
Oil Pressure on CAD:
WTI crude pulls back from last session’s 2% rise, trading near $59.30 after Russia’s Novorossiysk port resumed operations following a two-day shutdown caused by a Ukrainian drone strike.
Meanwhile, the IEA warns of a potential 4 million bpd oversupply in 2026, reinforcing bearish pressure on energy markets.
BoC Expectations:
Markets expect the Bank of Canada to hold rates steady through 2026, unless economic conditions deteriorate further. October CPI data later today could influence rate expectations.
Fed Commentary:
Hawkish remarks from Fed officials continue to support the US Dollar.
Kansas City Fed President Jeffery Schmid said monetary policy should “lean against demand growth,” calling current conditions “modestly restrictive.”
Rate Cut Odds:
CME FedWatch shows 46% probability of a 25bps Fed cut in December — a sharp decline from 67% last week, reducing near-term dovish expectations.
Overall, the macro backdrop remains slightly USD-supportive, maintaining upward pressure on USD/CAD as long as oil prices stay weak and Fed officials maintain a cautious stance.
🔑 Key Technical Levels
Resistance: 1.4066 – 1.4072
Support: 1.4014 – 1.4019
Psychological Level: 1.4050
📌 Trade Summary
USD/CAD sustains above the 1.4010 support region, keeping the short-term bias tilted to the upside. Weakening oil prices and cautious Fed rhetoric favour a rebound toward 1.4066–1.4072.
A break below 1.4011 would negate the bullish scenario and shift focus toward 1.3980.
⚠️ Disclaimer
This analysis is for reference only and does not constitute trading advice. Trading involves significant risk, and proper risk management is essential.
