The importance of trendlines in FOREXIn the world of currencies or FOREX, there are certain entry points that only happen a few times a year , but they’re incredibly powerful . These opportunities come after a trend breaks, a trend that has been touched and confirmed as a support or resistance zone over several years.
Right now, with OANDA:USDCAD , we’re seeing a break and pullback to one of these long-term trends. That makes this a great moment to go short on this pair.
Let me share a couple of examples with USDBRL and USDMXN. In both cases, after similar long-term trends were broken, the price moved strongly in one direction, these are the kinds of moves that can really grow your account.
There are other pairs showing similar breakouts.
Have you spotted them? If not, leave a comment and I’ll share the other pairs with you!
Trade ideas

Bank of Canada lowers rates, Canadian dollar edges upwardsThe Canadian dollar has posted small gains on Wednesday. In the North American session, USD/CAD is trading at 1.3762, up 0.17% on the day.
There were no surprises from the Bank of Canada, which lowered its policy rate by a quarter-point to 2.5%, its lowest level since July 2022. This was the first time the Bank of Canada lowered rates since March, as it was forced to respond to signs of weakness in the economy and lower inflation.
The rate statement said that a rate cut was justified, given that the economy had weakened and there was less upside risk to inflation. The US tariffs were expected to have a further dampening effect on economic activity.
The statement made three references to the uncertainty of the economic outlook, which has required the BoC to act cautiously. At a follow-up press conference, Governor Macklem defended the rate cut due to a weaker labor market and less upside pressure on underlying inflation.
What was missing from the rate statement and press conference was any forward guidance about future rate cuts, as the central bank doesn't want to be pushed into any corners with regard to future decisions. If inflation risks continue to fade, the BoC could deliver one or even two rate cuts before the end of the year.
The Federal Reserve is virtually certain to lower rates at today's meeting, barring a monumental surprise. The expected rate cut would be the Fed's first since December 2024. With the rate decision virtually a given, investors will be looking for some clues as to whether the Fed is looking at further rates cuts before the end of the year.
USD/CAD is testing resistance at 1.3752. Above, there is resistance at 1.3770
There is support at 1.3721 and 1.3703

USDCAD upside resistance at 1.3790The USDCAD pair is currently trading with a bearish bias, aligned with the broader downward trend. Recent price action shows a retest of the falling resistance, suggesting a temporary relief rally within the downtrend.
Key resistance is located at 1.3790, a prior consolidation zone. This level will be critical in determining the next directional move.
A bearish rejection from 1.3790 could confirm the resumption of the downtrend, targeting the next support levels at 1.3725, followed by 1.3700 and 1.3690 over a longer timeframe.
Conversely, a decisive breakout and daily close above 1.3790 would invalidate the current bearish setup, shifting sentiment to bullish and potentially triggering a move towards 1.3820, then 1.3840.
Conclusion:
The short-term outlook remains bearish unless the pair breaks and holds above 1.3790. Traders should watch for price action signals around this key level to confirm direction. A rejection favours fresh downside continuation, while a breakout signals a potential trend reversal or deeper correction.
This communication is for informational purposes only and should not be viewed as any form of recommendation as to a particular course of action or as investment advice. It is not intended as an offer or solicitation for the purchase or sale of any financial instrument or as an official confirmation of any transaction. Opinions, estimates and assumptions expressed herein are made as of the date of this communication and are subject to change without notice. This communication has been prepared based upon information, including market prices, data and other information, believed to be reliable; however, Trade Nation does not warrant its completeness or accuracy. All market prices and market data contained in or attached to this communication are indicative and subject to change without notice.

USD/CAD 4H chart:USD/CAD 4H chart:
Current price: ~1.3753
Support zone: ~1.3720 – 1.3730 (where price has bounced)
First target (TP1): ~1.3835 – 1.3840 (next resistance zone)
Second target (TP2): ~1.3915 – 1.3920 (major resistance zone at the top)
So the trade plan shown in chart is:
✅ Entry from support ~1.3730
🎯 Target 1 → ~1.3840
🎯 Target 2 → ~1.3920

4H USD/CAD Head + Shoulders PatternWaiting for potential break and retest of the 1.37200 level. If this happens, I’ll be watching USD/CAD on a lower timeframe in order a for a better entry. I’ll be placing my TP around the 1.3600 level and my SL around the 1.37400 level.

Double Blow for the USD/CAD MarketDouble Blow for the USD/CAD Market
Today, the USD/CAD market faces a “double blow” from central banks:
→ At 16:45 GMT+3, the Bank of Canada will announce its decision. The rate is expected to be cut from 2.75% to 2.50%.
→ At 21:00 GMT+3, the Federal Reserve will follow with its own rate announcement.
Both events will be accompanied by statements from the central bank chairmen on future outlooks, and the USD/CAD market is likely to experience heightened volatility today.
Technical Analysis of the USD/CAD Chart
When analysing the USD/CAD chart earlier this month, we noted the formation of a symmetrical narrowing triangle (a sign of balance between supply and demand), bounded by:
→ a long-term descending channel (red), which has been in place since early February;
→ a short-term channel (blue), shaped by price fluctuations since mid-summer.
At that time, we suggested that supply and demand forces would keep USD/CAD in a temporary state of equilibrium until today.
Since then:
→ the price has reversed sharply from the upper boundary of the triangle (marked with an arrow);
→ on the eve of key announcements, the pair is attempting to consolidate below the lower boundary, signalling bearish pressure (in other words, a shift in balance in favour of supply).
Key observations:
→ the aggressive nature of the September support breakout (S);
→ the decline towards the critical 1.3725 level, which has acted as support since August.
Given the above, we could assume that the market is leaning bearish. Today’s announcements could trigger a downward impulse in USD/CAD – in this context, the chart may be interpreted through:
→ a potential breakout of the bearish flag pattern (formed by the blue channel);
→ prospects for the resumption of the broader downtrend within the red channel.
This article represents the opinion of the Companies operating under the FXOpen brand only. It is not to be construed as an offer, solicitation, or recommendation with respect to products and services provided by the Companies operating under the FXOpen brand, nor is it to be considered financial advice.

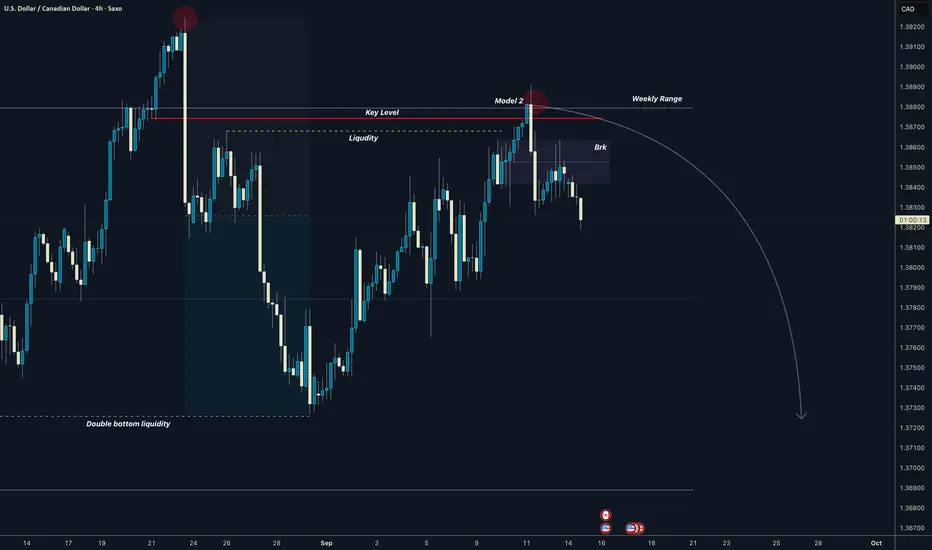
USDCAD Weekly Range Model 2Bearish setup from the weekly range retest from the key level.
Weekly Range manipulated
Price dropped down and created double bottom = Liqudity
Pullback to the Premium liquidity
Rejection + Breaker
Targeting 50% of Range and Double bottom , then Range low
Note: FOMC this week. it can be volatile.
Good luck
David Perk aka Dave FX Hunter
USDCAD Midweek TradeWe may see an increase in volatility as we approach the middle of the week. The market is at peak euphoria. Expecting a bearish engulfing candle on the 4hr chart on USDCAD

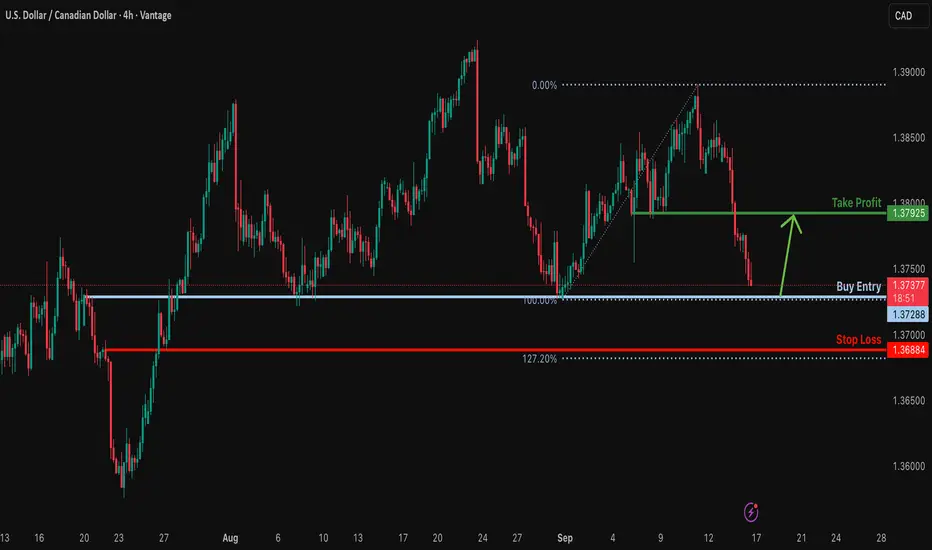
USDCAD H4 | Bullish reversal off major supportBased on the H4 chart analysis, we can see that the price has bounced off the buy entry which acts as an overlap support and could potentially rise from this level to the take profit.
Buy entry is at 1.3730, whichis an overlap support.
Stop loss is at 1.3694, which i a pullback support.
Take profit is at 1.3790, whichis a pullback resistance that aligns with the 38.2% Fibonacci retracement.
High Risk Investment Warning
Trading Forex/CFDs on margin carries a high level of risk and may not be suitable for all investors. Leverage can work against you.
Stratos Markets Limited (tradu.com ):
CFDs are complex instruments and come with a high risk of losing money rapidly due to leverage. 65% of retail investor accounts lose money when trading CFDs with this provider. You should consider whether you understand how CFDs work and whether you can afford to take the high risk of losing your money.
Stratos Europe Ltd (tradu.com ):
CFDs are complex instruments and come with a high risk of losing money rapidly due to leverage. 66% of retail investor accounts lose money when trading CFDs with this provider. You should consider whether you understand how CFDs work and whether you can afford to take the high risk of losing your money.
Stratos Global LLC (tradu.com ):
Losses can exceed deposits.
Please be advised that the information presented on TradingView is provided to Tradu (‘Company’, ‘we’) by a third-party provider (‘TFA Global Pte Ltd’). Please be reminded that you are solely responsible for the trading decisions on your account. There is a very high degree of risk involved in trading. Any information and/or content is intended entirely for research, educational and informational purposes only and does not constitute investment or consultation advice or investment strategy. The information is not tailored to the investment needs of any specific person and therefore does not involve a consideration of any of the investment objectives, financial situation or needs of any viewer that may receive it. Kindly also note that past performance is not a reliable indicator of future results. Actual results may differ materially from those anticipated in forward-looking or past performance statements. We assume no liability as to the accuracy or completeness of any of the information and/or content provided herein and the Company cannot be held responsible for any omission, mistake nor for any loss or damage including without limitation to any loss of profit which may arise from reliance on any information supplied by TFA Global Pte Ltd.
The speaker(s) is neither an employee, agent nor representative of Tradu and is therefore acting independently. The opinions given are their own, constitute general market commentary, and do not constitute the opinion or advice of Tradu or any form of personal or investment advice. Tradu neither endorses nor guarantees offerings of third-party speakers, nor is Tradu responsible for the content, veracity or opinions of third-party speakers, presenters or participants.

USDCADToday’s Elliott Wave outlook for USDCAD suggests the pair is completing its corrective phase, with potential for the next bearish leg if the structure holds. Traders should watch for confirmation around key levels.

USD/CAD POTENTIAL bullish SOONusd/cad has hit its all time low and could potentially become bullish, tomorrow there will be news about the fed cuts for the US so we will see, on the 10 minute timeframe the momentum has slowed down for the sellers and buyers so there is some indecision taking place.

Bullish reversal off key support?USD/CAD is falling towards the support level, which is an overlap support and could bounce from this level to our take profit.
Entry: 1.3728
Why we like it:
There is an overlap support level.
Stop loss: 1.3688
Why we like it:
There is a pullback support that is slightly above the 127.2% Fibonacci extension,
Take profit: 1.3792
Why we like it:
There is a pullback resistance level.
Enjoying your TradingView experience? Review us!
Please be advised that the information presented on TradingView is provided to Vantage (‘Vantage Global Limited’, ‘we’) by a third-party provider (‘Everest Fortune Group’). Please be reminded that you are solely responsible for the trading decisions on your account. There is a very high degree of risk involved in trading. Any information and/or content is intended entirely for research, educational and informational purposes only and does not constitute investment or consultation advice or investment strategy. The information is not tailored to the investment needs of any specific person and therefore does not involve a consideration of any of the investment objectives, financial situation or needs of any viewer that may receive it. Kindly also note that past performance is not a reliable indicator of future results. Actual results may differ materially from those anticipated in forward-looking or past performance statements. We assume no liability as to the accuracy or completeness of any of the information and/or content provided herein and the Company cannot be held responsible for any omission, mistake nor for any loss or damage including without limitation to any loss of profit which may arise from reliance on any information supplied by Everest Fortune Group.
USDCAD Setup: A Textbook Trade in Motion Sometimes, the market paints a picture so clean it feels like it came straight out of a trading manual—and USDCAD is doing just that.
🔍 What I'm seeing:
- A classic Head and Shoulders pattern forming with clear neckline structure
- A fresh supply zone just above, recently tested
- A sharp reaction as price touches that zone—textbook rejection behavior
📉 My plan: I’ve placed a sell stop just below yesterday’s wick, anticipating a strong bearish move if momentum kicks in. The setup aligns with pattern confirmation and supply zone logic.
🎯 Why it matters: This could be a high-probability move—or not. That’s trading. But as they say: “Risk a little, gain a lot.” I’m ready to see how it plays out.
Let me know your thoughts or if you’re seeing something different on the chart. Let’s trade smart and stay sharp.
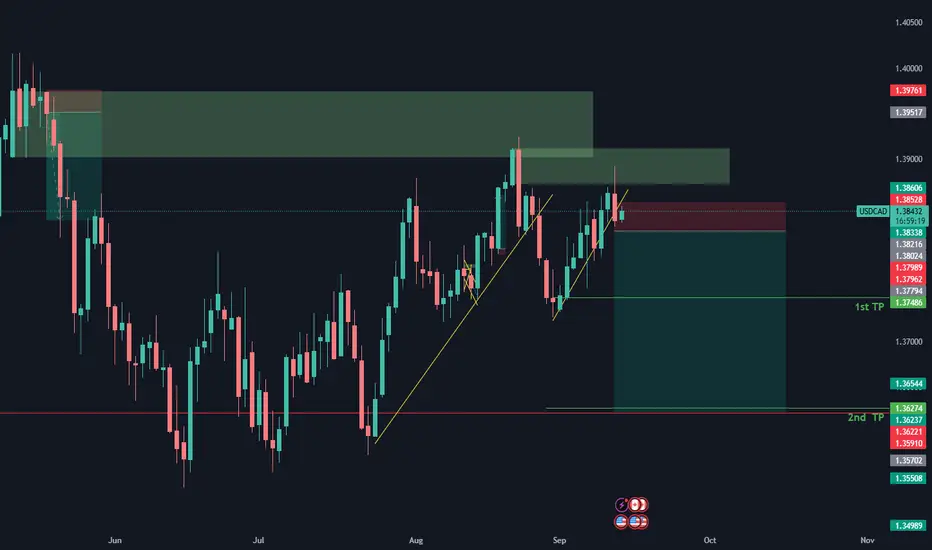
On weekly Consolidation. Looking Swing LongOn weekly Consolidation. Price should manipulate Equal Lows. There is a two type of TPs i see.
Type 1 - On Liquidity Voids / in weekly and Daily Time Frames /
Type 2 - On weekly Bearish OB

USD-CAD Support Ahead! Buy!
Hello,Traders!
USD-CAD keeps falling
Down but a wide horizontal
Support area is ahead
Around 1.3728 so after
The retest a local bullish
Correction is to be
Expected
Buy!
Comment and subscribe to help us grow!
Check out other forecasts below too!
Disclosure: I am part of Trade Nation's Influencer program and receive a monthly fee for using their TradingView charts in my analysis.

USD/CAD eyeing lower levels ahead of data & rate decisionAhead of today’s inflation data from Canada, the currency pair is trading below a 3M resistance from CAD1.3827 and is fast approaching a neckline (taken from the low of CAD1.3721) of a potential head and shoulders top pattern.
In view of the downside bias since topping at CAD1.4793 earlier this year, the current pullback in the downtrend (from the low of CAD1.3540) could tempt price to engulf the oncoming neckline and challenge nearby support at CAD1.3669 (6M) and CAD1.3617 (1Y), followed by CAD1.3549 (1Y).
Written by the FP Markets Research Team

Potential bearish drop for the Loonie?The price has reacted off the pivot and could drop to the 1st support which has been identified as a multi-swing low support.
Pivot: 1.3807
1st Support: 1.3720
1st Resistance: 1.3877
Oil markets on September 16, 2025, are caught between conflicting forces. While immediate supply disruption risks from Ukrainian attacks on Russian infrastructure and anticipated Federal Reserve rate cuts are providing near-term price support, fundamental market conditions point to significant oversupply ahead. The EIA's projection of massive inventory builds and OPEC+'s continued production increases suggest substantial downward price pressure through 2026, with Brent potentially falling to $50 per barrel despite current geopolitical tensions. The market is essentially pricing in short-term disruption risks while bracing for longer-term oversupply challenges.

USD/CAD, GBP/CAD, EUR/CAD: Canadian Dollar Bulls Regain FootingPrice action on several Canadian dollar charts suggests that we've entered a phase of strength from the bull camp. With Canadian CPI and a Bank of Canada meeting on tap, there is plenty of opportunity for volatility. Today I outline my bias for USD/CAD, GBP/CAD and EUR/CAD.
Matt Simpson, Market Analyst at City Index and Forex.com (part of StoneX)

USDCAD - WEEKLY HEAD AND SHOULDER ACTIONKey Drivers:
Fed vs BoC Rate Path:
The Fed is signaling more rate cuts, while the BoC remains cautious, creating a rate cut differential that favors CAD.
Weak USD Theme:
The USD is under broad pressure as markets price in easing and risk sentiment improves.
COT Positioning – CAD Bearish, But Squeeze Risk:
Speculators remain net short CAD, but improving fundamentals and sentiment could trigger a short squeeze, accelerating CAD strength.


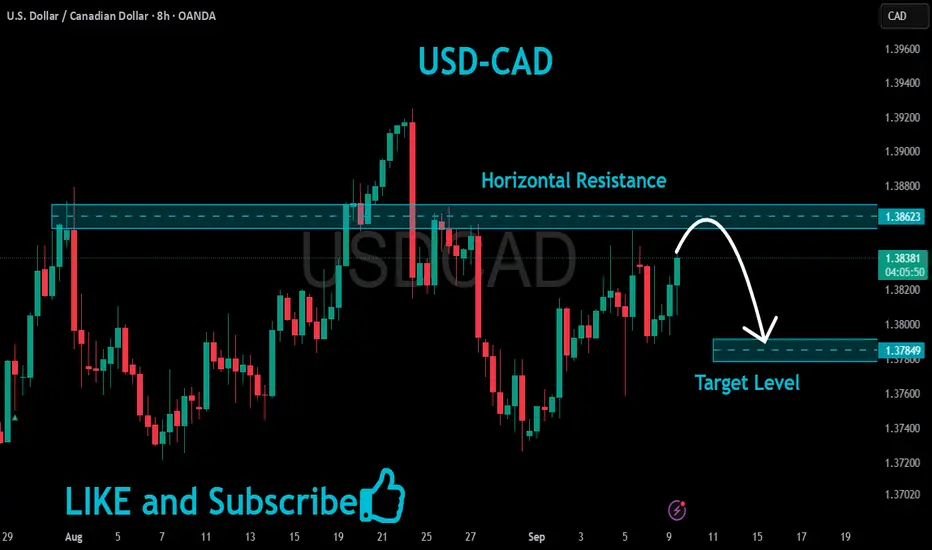
USDCAD Resistance Ahead!
HI,Traders !
#USDCAD is trading in an
Uptrend but the pair is locally
Overbought so after the pair
Hits the horizontal resistance
Level of 1.38623 we will be
Expecting a local bearish
Move down !
Comment and subscribe to help us grow !

USDCAD | Cracks in the Ice at 1.3725Macro Hook:
USD/CAD is under pressure as oil strength provides a CAD tailwind and markets lean toward deeper Fed easing relative to the BoC. The backdrop has flipped from summer’s CAD softness (BoC dovish hold + weak Canadian data) to a September environment where USD underperforms on relative policy and risk tone.
Technical Lens:
Price has broken the local trendline (DL1), shifting risk lower toward the neckline pivot (DL2 at ~1.3725). Acceptance below DL2 confirms a downside path toward the 1.3600 zone (structural objective / channel support). Invalidation sits at ~1.3900 on a closing basis. RSI has also slipped beneath the midline, leaving momentum space open to extend lower.
Scenarios:
If DL2 (1.3725) holds → rebound risk back into 1.3860–1.3900.
If DL2 breaks/accepts → path of least resistance opens to 1.3600.
Catalysts:
Watch crude price momentum, Fed vs BoC policy signals, and near-term US/CAD data releases for confirmation.
Takeaway:
1.3725 is the decision line; below it, the structural path points to 1.3600.
