USD/CHF short What I am currently seeing during the new york sesion its a formation of a double top in 30 minutes and I have been analizing the volume and the EMas and how the price its going with that indicators.
USDCHF_SPT trade ideas

USDCHF H4 | Bullish Bounce Based on the 4-hour chart analysis, we can see that the price is falling toward our buy entry at 0.88485. This level is anticipated to act as significant support, close to the 161.8% Fibonacci extension.
Our take profit is set at 0.89426, identified as an overlap resistance level.
The stop loss is placed at 0.87805, which is recognized as an overlap support level to mitigate downside risk."

USDCHF H4 | Bearish reversalBased on the H4 chart analysis, we can see that the price is rising toward our sell entry at 0.8988, which is a pullback resistance and a 38.2% Fibonacci retracement.
Our take profit will be at 0.8892, a multi-swing low support level.
The stop loss will be placed at 0.9079, a pullback esistance level."
High Risk Investment Warning
Trading Forex/CFDs on margin carries a high level of risk and may not be suitable for all investors. Leverage can work against you.
Stratos Markets Limited (www.fxcm.com):
CFDs are complex instruments and come with a high risk of losing money rapidly due to leverage. 68% of retail investor accounts lose money when trading CFDs with this provider. You should consider whether you understand how CFDs work and whether you can afford to take the high risk of losing your money.
Stratos Europe Ltd, previously FXCM EU Ltd (www.fxcm.com):
CFDs are complex instruments and come with a high risk of losing money rapidly due to leverage. 70% of retail investor accounts lose money when trading CFDs with this provider. You should consider whether you understand how CFDs work and whether you can afford to take the high risk of losing your money.
Stratos Trading Pty. Limited (www.fxcm.com):
Trading FX/CFDs carries significant risks. FXCM AU (AFSL 309763), please read the Financial Services Guide, Product Disclosure Statement, Target Market Determination and Terms of Business at www.fxcm.com
Stratos Global LLC (www.fxcm.com):
Losses can exceed deposits.
Please be advised that the information presented on TradingView is provided to FXCM (‘Company’, ‘we’) by a third-party provider (‘TFA Global Pte Ltd’). Please be reminded that you are solely responsible for the trading decisions on your account. There is a very high degree of risk involved in trading. Any information and/or content is intended entirely for research, educational and informational purposes only and does not constitute investment or consultation advice or investment strategy. The information is not tailored to the investment needs of any specific person and therefore does not involve a consideration of any of the investment objectives, financial situation or needs of any viewer that may receive it. Kindly also note that past performance is not a reliable indicator of future results. Actual results may differ materially from those anticipated in forward-looking or past performance statements. We assume no liability as to the accuracy or completeness of any of the information and/or content provided herein and the Company cannot be held responsible for any omission, mistake nor for any loss or damage including without limitation to any loss of profit which may arise from reliance on any information supplied by TFA Global Pte Ltd.
The speaker(s) is neither an employee, agent nor representative of FXCM and is therefore acting independently. The opinions given are their own, constitute general market commentary, and do not constitute the opinion or advice of FXCM or any form of personal or investment advice. FXCM neither endorses nor guarantees offerings of third party speakers, nor is FXCM responsible for the content, veracity or opinions of third-party speakers, presenters or participants.

Heading into 50% Fibonacci resistance?USD/CHF is rising towards a resistance level which is a pullback resistance that is slightly below the 50% Fibonacci retracement and could reverse from this level to our take profit.
Entry: 0.8998
Why we like it:
There is a pullback resistance level which is slightly below the 50% Fibonacci retracement.
Stop loss: 0.9093
Why we like it:
There is an overlap resistance level which lines up with the 78.6% Fibonacci retracement.
Take profit: 0.8888
Why we like it:
There is a pullback resistance level.
Please be advised that the information presented on TradingView is provided to Vantage (‘Vantage Global Limited’, ‘we’) by a third-party provider (‘Everest Fortune Group’). Please be reminded that you are solely responsible for the trading decisions on your account. There is a very high degree of risk involved in trading. Any information and/or content is intended entirely for research, educational and informational purposes only and does not constitute investment or consultation advice or investment strategy. The information is not tailored to the investment needs of any specific person and therefore does not involve a consideration of any of the investment objectives, financial situation or needs of any viewer that may receive it. Kindly also note that past performance is not a reliable indicator of future results. Actual results may differ materially from those anticipated in forward-looking or past performance statements. We assume no liability as to the accuracy or completeness of any of the information and/or content provided herein and the Company cannot be held responsible for any omission, mistake nor for any loss or damage including without limitation to any loss of profit which may arise from reliance on any information supplied by Everest Fortune Group.

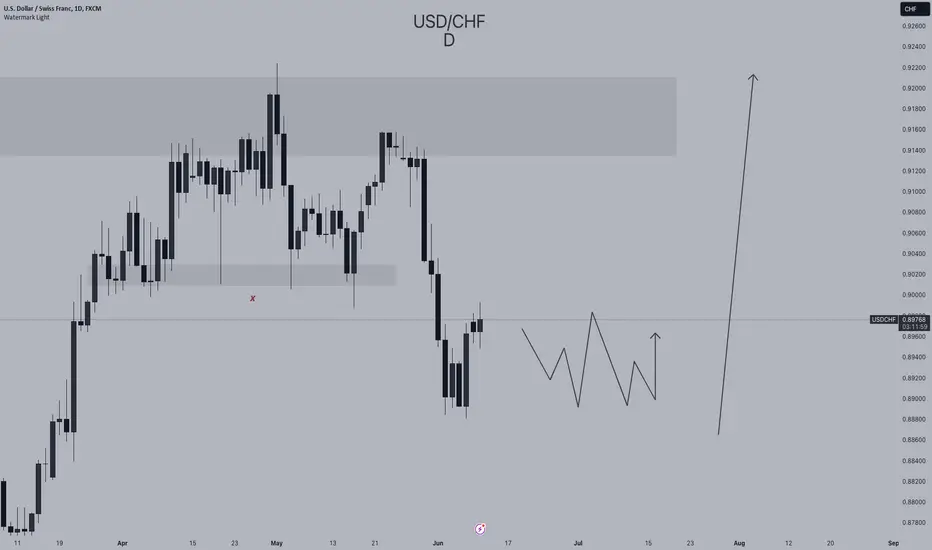
USDCHFUPDATE: Price still stalls around the 0.236 fib level/support, rejecting and failing to break below it. But for how long can it hold? Market structure looks much clearer now with somewhat a Double Top pattern (completion of wave B and wave C in progress). I still have a bearish Bias on this pair. So will be on the lookout for SHORT (scalps) setups on the breakout of the 0.236 fib level down to 0.8900-0.8880 during intraday sessions.
Sentiment Data shows majority (78%) of retail traders are net LONG on this pair.

USDCHFFUNDAMENTAL; getting strength against CHF
USD LONG 55 SHORT 45
CHF 12 87
SENTIMENTAL ; LONG 56 SHORT 44
TECHNICAL ; after making higher rate dressing 0.51 to 0.6 area .
as today USD high impact news, with expectation for the dollar get strength it will be a good grade on buying site at0.51 -0.6 area
or
BUY STOP at the break of consolidation box

USDCHF Short Short position for at least 90 pips.
On the H4 I see price broke through a support area athe the price of 0.89900, then it pulled back to that same area making it a good resistance area to SELL from.

SELL IDEA USD/CHFWe can expect a reaction in the direction of selling from the specified resistance zone

USDCHF AnalysisUSDCHF broke down on Friday major key level 0.89920 , and closed under previous weekly low, and activated a bearish sequence with target towards 0.8780 which represents a major key level 50% Fibbo and demand zone, and a final target for the sequence

USDCHF Short term bullsUSDCHF May run to 0.92100 early next week, as the week's high. I anticipate a reversal once it reaches that level ahead of US PMI and US GDP. Given that the GDP is expected to decline, any less than forecast figure may push it 0.88700 then later to 0.88100.

USDCHF - LongThere is a potential USDCHF short term long (pullback) play on the cards. Currently the price seems to be pulling back lower to discount prices before a potential long. Price has broken previous highs after a week long bearish blood bath. Last Friday's gains, signify what looks like the start of the bullish pullback in order to complete wave 4.

USDCHFPair is testing daily zone where sells can be taken. Clear inverse head and shoulder pattern can be seen. Target shown on chart.

pullback-Entery Short- 90 Pips!!!!Dear Traders,
Price Start Retest Resistance Area as specified in chart,
i Expect price will start downward movement to 0.89000 Area ,
what you think about my Idea?
dont Forget like&Comment please !
Regards,
Alireza!

UCHF, I AM EXPECTING UCHEF TO GO LONG TODAY AHEAD PF CPIGood day followers, am expecting UCHF to go bullish today ahead of today CPI news.
Based on the trend line and market movement, USDCHF is expected to be bullish as we expect DXY to be bullish today

USD/CHF - Sensitive Zone!! When you have a liquidity reaction zone, you´ve to pay attention.
Like you can see, the market react !!
It look like a breakout but I´m not trust that..
We have two options:
Stay consolidation or Flying to the Moon !!
Keep it Simple!
If you´re like it, FOLLOW ME !! :)
USD-CHF Resistance Ahead! Sell!
Hello,Traders!
USD-CHF is going up now
But the pair will soon hit
A horizontal resistance
Of 0.9013 from where
And after the retest
We will be expecting
A further move down
Sell!
Like, comment and subscribe to help us grow!
Check out other forecasts below too!

USDCHF is posed for the recoveryHi there!
We've got another potentially interesting situation: long USDCHF. After a massive slide down, USDCHF is recovering, and it's reasonable to try to open a trade around the breakout area of a small formation, as indicated on the chart.
SNB (Swiss National Bank) decreased its interest rate in March and triggered a dovish monetary cycle, while the Fed is still far away from this scenario. So, the Swiss Franc would logically stay under pressure against the US dollar within the present cycle.
The big bullish candlestick on the daily chart on Friday points to a continuation of growth of USDCHF.
I am considering placing a position with a relatively small stop of 15 pips, as intraday volatility of USDCHF is quite low.
Don't forget to DYOR and manage your risk!

USDCHF to breakdown?USDCHF - Intraday
We look for losses to be extended today.
There is no clear indication that the downward move is coming to an end.
Short term momentum is bearish.
0.8884 has been pivotal.
A break of the recent low at 0.8883 should result in a further move lower.
We look to Sell a break of 0.8879 (stop at 0.8907)
Our profit targets will be 0.8809 and 0.8789
Resistance: 0.8900 / 0.8920 / 0.8948
Support: 0.8883 / 0.8860 / 0.8840
Risk Disclaimer
The trade ideas beyond this page are for informational purposes only and do not constitute investment advice or a solicitation to trade. This information is provided by Signal Centre, a third-party unaffiliated with OANDA, and is intended for general circulation only. OANDA does not guarantee the accuracy of this information and assumes no responsibilities for the information provided by the third party. The information does not take into account the specific investment objectives, financial situation, or particular needs of any particular person. You should take into account your specific investment objectives, financial situation, and particular needs before making a commitment to trade, including seeking advice from an independent financial adviser regarding the suitability of the investment, under a separate engagement, as you deem fit.
You accept that you assume all risks in independently viewing the contents and selecting a chosen strategy.
Where the research is distributed in Singapore to a person who is not an Accredited Investor, Expert Investor or an Institutional Investor, Oanda Asia Pacific Pte Ltd (“OAP“) accepts legal responsibility for the contents of the report to such persons only to the extent required by law. Singapore customers should contact OAP at 6579 8289 for matters arising from, or in connection with, the information/research distributed.


USDCHF moving higher this week**Monthly Chart**
USDCHF is moving within a range between a high of 0.92450 and a low of 0.83300 levels. Last month candles closed as MC candles around the relatively equal monthly high. The Pair is moving a range since April 2023.
**Weekly Chart**
Last week candle closed as a bearish candle. However, the close of the price at the mid-level of the move which as a strong reaction from the US NFP and Employment change announcements. It has also tested the weekly IPA of March 2024. In line with DXY analysis, we might see USDCHF move higher and break the weekly and monthly high around 0.9200 level.
**Daily Chart**
USDCHF broke the previous daily swing with a few pips and then resumed lower with last Friday's NFP news. If you look at the 4H time frame, the price formed a key reversal before the news and then pushed higher. For this week I will be looking a a retracement to at least 50% of IPA candle that formed with a confirmation as a key reversal pattern to take this pair higher. The next target will be around 0.92000 level and then 0.93000 level.

USD_CHF LOCAL SHORT|SELL|
✅USD_CHF has been growing recently
And the pair seems locally overbought
So as the pair has approached a horizontal resistance of 0.9000
Price fall is to be expected
SHORT🔥
✅Like and subscribe to never miss a new idea!✅

USDCHFSome of the best AI forex trading platforms include MetaTrader 4, MetaTrader 5, cTrader, TradingView, and ProRealTime. Some of the most popular tools for AI trading include automated trading and copy trading tools, as well as market scanners such as those provided by Autochartist.

USDCHFFUNDAMENTAL :LONG ,USD bullish ,CHF bearish
SENTIMENTAL:52/48
TECHNICAL ;long with double bottom and bullish divergence making HH
i will be interested buy limit on retracement and fair value gap tapping
