USDCHF major buy Price is currently at support level as seen on the chart 4h time frame
The risk to reward is very promising with this trade
We likely will.keep this trade open for the next 2 days good luck!
USDCHF_SPT trade ideas

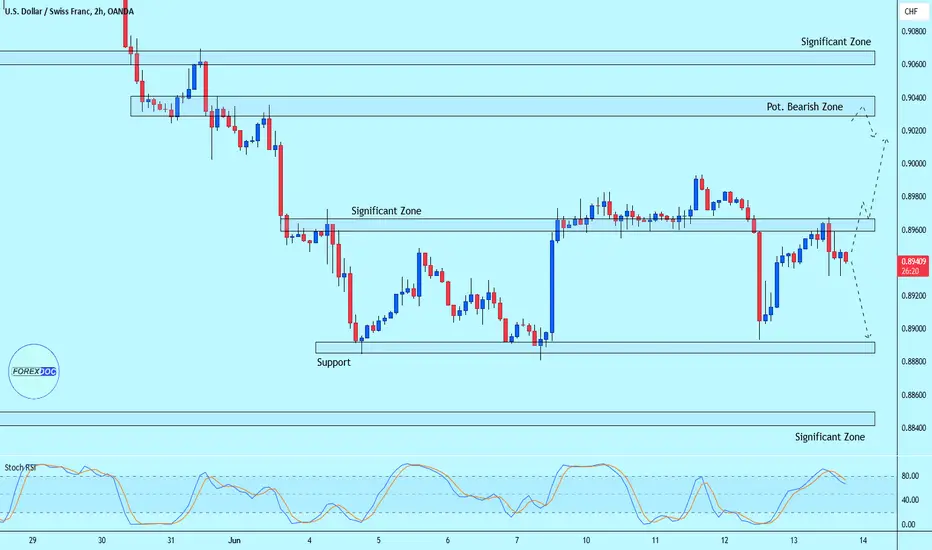
USD/CHF is Testing Significant ZoneWe can see massive bearish candle here, but price reacted to 0.88850 zone and it is currently testing 0.89600. I expect to see bearish move, but if price goes up to break this zone, then it is likely to see bullish continuation.
USDCHF Short Short position for at least 90 pips.
On the H4 I see price broke through a support area athe the price of 0.89900, then it pulled back to that same area making it a good resistance area to SELL from.

USDCHF FOR BULLISHIm looking bullish for this structure . Yes, remain bullish as long as price not break my invalidation level. Trade with your risk.

USDCHF Corrected! DOWN to .8700 Range!!Here I have USD/CHF on the Daily Chart!
After USD/CHF finished its Impulse Wave May 1st with a High @ .92242 we see based on the Low or Point A @ .89879 followed by a LOWER HIGH or Point B @ .91587 ..
We are given all the Ingredients for a CORRECTION WAVE!!
Now based on the break of the NEW LOWER LOW @ .88809, using the Fibonacci Retracement Tool, we see price has made a perfect 61.8% Retracement!!!
On the initial Touch of 61.8% I took Sell Entries but we will certainly see this pair FALL!!!
Range Target is ( .87748 - .86842 )

USD/CHF Analysis: Potential Major Decline Pending ConfirmationOverview: The USD/CHF currency pair, after breaking its ascending trendline visible on the daily timeframe, is on the verge of a significant decline. The critical condition for this bearish move is the closing of a 4-hour candle below 0.88920. The confirmation of this break requires the candle to be of substantial size and without a long shadow.
Trade Setup:
• Entry Trigger: Wait for the 4-hour candle to close below 0.88920.
• Confirmation: Ensure the candle has a substantial body with minimal or no long shadow.
Entry Strategy:
• If the 4-hour candle closes below 0.88920, initiate a sell position.
• If the specified entry trigger is missed, use the RSI indicator as an alternative signal. Enter the sell trade with the candle that causes the RSI to enter the oversold zone (below 30).
Stop Loss:
• Initial Stop Loss: Place the stop loss above the shadow of the candle that triggers the entry.
• Conservative Stop Loss: For a more conservative approach, place the stop loss above the last swing high.
Risk Management: Ensure proper risk management by calculating position size according to your risk tolerance and adhering to stop loss placements.
Chart Analysis:
• Daily Timeframe: Observed a break of the ascending trendline.
• 4-Hour Timeframe: Awaiting a confirming candle close below 0.88920 for entry.
Indicators:
• RSI: Monitor RSI for entering the oversold zone as an alternative entry signal.
Summary: The USD/CHF pair is poised for a significant decline contingent upon a confirmed break below 0.88920 on the 4-hour timeframe. Adhering to the outlined entry and stop loss strategies will enhance the probability of a successful trade.

USDCHF H4 | Bearish Drop Based on the H4 chart analysis, we can see that the price has just reacted off our sell entry at 0.8988, which is an overlap resistance close to the 38.2% Fibo retracement
Our take profit will be at 0.8937, a pullback support level.
The stop loss will be placed at 0.9031, which is an overlap resistance level.
High Risk Investment Warning
Trading Forex/CFDs on margin carries a high level of risk and may not be suitable for all investors. Leverage can work against you.
Stratos Markets Limited (www.fxcm.com):
CFDs are complex instruments and come with a high risk of losing money rapidly due to leverage. 68% of retail investor accounts lose money when trading CFDs with this provider. You should consider whether you understand how CFDs work and whether you can afford to take the high risk of losing your money.
Stratos Europe Ltd, previously FXCM EU Ltd (www.fxcm.com):
CFDs are complex instruments and come with a high risk of losing money rapidly due to leverage. 70% of retail investor accounts lose money when trading CFDs with this provider. You should consider whether you understand how CFDs work and whether you can afford to take the high risk of losing your money.
Stratos Trading Pty. Limited (www.fxcm.com):
Trading FX/CFDs carries significant risks. FXCM AU (AFSL 309763), please read the Financial Services Guide, Product Disclosure Statement, Target Market Determination and Terms of Business at www.fxcm.com
Stratos Global LLC (www.fxcm.com):
Losses can exceed deposits.
Please be advised that the information presented on TradingView is provided to FXCM (‘Company’, ‘we’) by a third-party provider (‘TFA Global Pte Ltd’). Please be reminded that you are solely responsible for the trading decisions on your account. There is a very high degree of risk involved in trading. Any information and/or content is intended entirely for research, educational and informational purposes only and does not constitute investment or consultation advice or investment strategy. The information is not tailored to the investment needs of any specific person and therefore does not involve a consideration of any of the investment objectives, financial situation or needs of any viewer that may receive it. Kindly also note that past performance is not a reliable indicator of future results. Actual results may differ materially from those anticipated in forward-looking or past performance statements. We assume no liability as to the accuracy or completeness of any of the information and/or content provided herein and the Company cannot be held responsible for any omission, mistake nor for any loss or damage including without limitation to any loss of profit which may arise from reliance on any information supplied by TFA Global Pte Ltd.
The speaker(s) is neither an employee, agent nor representative of FXCM and is therefore acting independently. The opinions given are their own, constitute general market commentary, and do not constitute the opinion or advice of FXCM or any form of personal or investment advice. FXCM neither endorses nor guarantees offerings of third party speakers, nor is FXCM responsible for the content, veracity or opinions of third-party speakers, presenters or participants.

USDCHF – Is a new downtrend underway? (double top in place)When all this happens on a daily chart, I am always interested. My chart is self-explanatory but I will just add that I am looking for a pull-back. That could happen at the round number 0.9000 or perhaps higher up around the 0.50 or 0.618 retracement area of the most recent down move. Initial target can be around 0.8900 or 0.8700.
Recently, forex pairs have been rather choppy. Let’s see how this plays out.
This is not a trade recommendation.
Trading carries a high level of risk, so only trade with money you can afford to lose. Anything can happen in the markets at any time. Please use sound money and risk management in all your trades.
If you like my idea, please give a “boost” and follow me to get even more.
Please comment and share your thoughts too!!

USDCHF: A false break of resistance will set up a sell-offUSDCHF breaks trend support and forms a range of 0.900 - 0.888
The market is flat and accordingly an intra-range strategy should be considered
There is no potential to break the resistance at the moment, as a small rally to the resistance is forming.
and such a fast movement can be stopped and reversed quite easily.
A big player is likely to delimit the range at 0.89994 resistance with the aim of taking a large position before moving to one side or the other.
Strategy: False breakdown of resistance followed by a fall. Targets: 0.895, 0.888

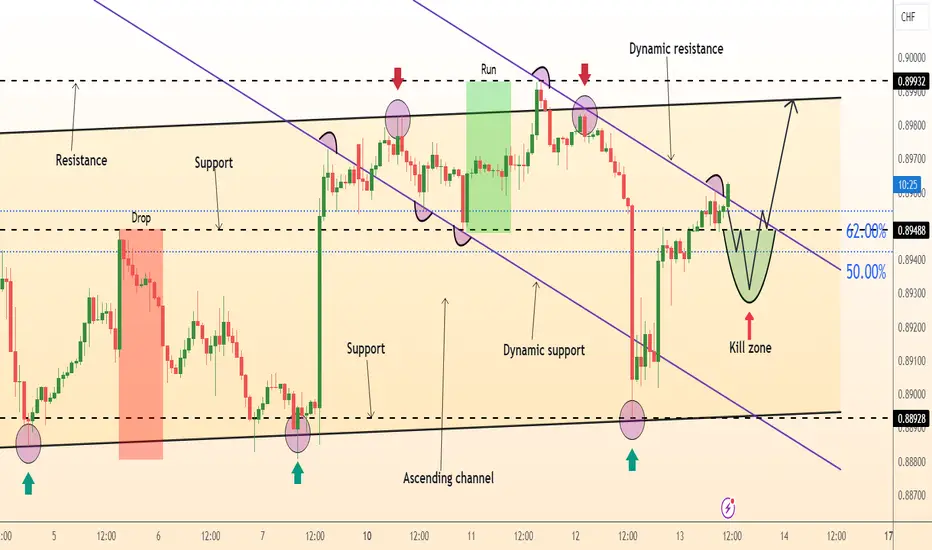
DeGRAM | USDCHF between retracement levelsUSDCHF is trading in an ascending channel between the trend lines.
The price is above the support level, which is the midpoint between the 62% and 50% retracement levels of the last bearish impulse.
The current support level has been a pivot point twice recently.
We expect the growth to continue after the support is retested.
-------------------
Share your opinion in the comments and support the idea with like. Thanks for your support!
UCHF, I AM EXPECTING UCHEF TO GO LONG TODAY AHEAD PF CPIGood day followers, am expecting UCHF to go bullish today ahead of today CPI news.
Based on the trend line and market movement, USDCHF is expected to be bullish as we expect DXY to be bullish today

USDCHF Chart AnalysisStrong Bearish trend in Daily chart. Wait on level breaks and pull backs for my swing traders

USDCHFUSDCHF:BUY
OPEN: 0.89614
SL: 0.86963
TP: 0.9761
==================
Disclaimer: Any content in this text does not constitute investment advice. This text provides an objective description of the market situation and should not be considered an offer to sell or a solicitation to buy.
Any decisions made based on the information provided in this text are your personal responsibility. Any investments made or to be made should be analyzed based on your financial situation and personal goals.

pullback-Entery Short- 90 Pips!!!!Dear Traders,
Price Start Retest Resistance Area as specified in chart,
i Expect price will start downward movement to 0.89000 Area ,
what you think about my Idea?
dont Forget like&Comment please !
Regards,
Alireza!

USDCHF - 4hrs ( Buy Trade Target Range 150 PIP ) ☑️Pair Name : USD/CHF
Time Frame : 4hrs Chart / Close
Scale Type : Large Scale
------
🛡 spreading knowledge among us and to clarify the most important points of entry, exit and entry with more than 5 reasons
We seek to spread understanding rather than make money
⌛ Key Technical / Direction ( Long )
Type : Mid Term Swing
———————————
Bullish Break
0.89750 Area
Reasons
- Major Turn level / M
- Visible Range HVn
- Pattern Break
- FIxed Range lvn
- Quarter's Area
- Fibo Golden Zone
Bearish Reversal
0.91250
reasons
- Major Turn level / D
- Visible Range Lvn
- Channel middle Band
- Day low Break
- week low Break
- Fibo Break Out / Golden
- Choch / Daily

USDCHF H1 | Bearish Drop Based on the H1 chart analysis, we can see that the price is currently at our sell entry at 0.8950, an overlap resistance close to 78.6% Fibonacci retracement.
Our take profit will be at 0.8903, a multi-swing low support.
The stop loss will be placed at 0.9005, which is a pullback resistance."
High Risk Investment Warning
Trading Forex/CFDs on margin carries a high level of risk and may not be suitable for all investors. Leverage can work against you.
Stratos Markets Limited (www.fxcm.com):
CFDs are complex instruments and come with a high risk of losing money rapidly due to leverage. 68% of retail investor accounts lose money when trading CFDs with this provider. You should consider whether you understand how CFDs work and whether you can afford to take the high risk of losing your money.
Stratos Europe Ltd, previously FXCM EU Ltd (www.fxcm.com):
CFDs are complex instruments and come with a high risk of losing money rapidly due to leverage. 73% of retail investor accounts lose money when trading CFDs with this provider. You should consider whether you understand how CFDs work and whether you can afford to take the high risk of losing your money.
Stratos Trading Pty. Limited (www.fxcm.com):
Trading FX/CFDs carries significant risks. FXCM AU (AFSL 309763), please read the Financial Services Guide, Product Disclosure Statement, Target Market Determination and Terms of Business at www.fxcm.com
Stratos Global LLC (www.fxcm.com):
Losses can exceed deposits.
Please be advised that the information presented on TradingView is provided to FXCM (‘Company’, ‘we’) by a third-party provider (‘TFA Global Pte Ltd’). Please be reminded that you are solely responsible for the trading decisions on your account. There is a very high degree of risk involved in trading. Any information and/or content is intended entirely for research, educational and informational purposes only and does not constitute investment or consultation advice or investment strategy. The information is not tailored to the investment needs of any specific person and therefore does not involve a consideration of any of the investment objectives, financial situation or needs of any viewer that may receive it. Kindly also note that past performance is not a reliable indicator of future results. Actual results may differ materially from those anticipated in forward-looking or past performance statements. We assume no liability as to the accuracy or completeness of any of the information and/or content provided herein and the Company cannot be held responsible for any omission, mistake nor for any loss or damage including without limitation to any loss of profit which may arise from reliance on any information supplied by TFA Global Pte Ltd.
The speaker(s) is neither an employee, agent nor representative of FXCM and is therefore acting independently. The opinions given are their own, constitute general market commentary, and do not constitute the opinion or advice of FXCM or any form of personal or investment advice. FXCM neither endorses nor guarantees offerings of third party speakers, nor is FXCM responsible for the content, veracity or opinions of third-party speakers, presenters or participants.

USDCHF: Pullback From Support 🇺🇸🇨🇭
USDCHF formed a tiny double bottom pattern
after a test of a wide key intraday horizontal support.
I think that the price may pull back from the underlined blue area.
Goal - 0.893
❤️Please, support my work with like, thank you!❤️

USDCHF (LONG)
We predicting Strong Dollar coming so with this said we have been looking for buy areas
Price has been reacting on the Moving average consistently retesting now to push up

USD/CHF has a strong bearish momentum, could it fall further?Price is rising towards a resistance level which is an overlap resistance that is slightly below the 50% Fibonacci retracement and could reverse to our take profit.
Entry: 0.8998
Why we like it:
There is an overlap resistance level that is slightly below the 50% Fibonacci retracement.
Stop loss: 0.9061
Why we like it:
There is a pullback resistance level.
Take profit: 0.8888
Why we like it:
There is a pullback support level.
Please be advised that the information presented on TradingView is provided to Vantage (‘Vantage Global Limited’, ‘we’) by a third-party provider (‘Everest Fortune Group’). Please be reminded that you are solely responsible for the trading decisions on your account. There is a very high degree of risk involved in trading. Any information and/or content is intended entirely for research, educational and informational purposes only and does not constitute investment or consultation advice or investment strategy. The information is not tailored to the investment needs of any specific person and therefore does not involve a consideration of any of the investment objectives, financial situation or needs of any viewer that may receive it. Kindly also note that past performance is not a reliable indicator of future results. Actual results may differ materially from those anticipated in forward-looking or past performance statements. We assume no liability as to the accuracy or completeness of any of the information and/or content provided herein and the Company cannot be held responsible for any omission, mistake nor for any loss or damage including without limitation to any loss of profit which may arise from reliance on any information supplied by Everest Fortune Group.

USDCHF H4 | Bullish Bounced off Based on the H4 chart analysis, we can see that the price is currently at our buy entry at 0.8886, a multi-swing low support level.
Our take profit will be at 0.8937, a pullback resistance.
The stop loss will be placed at 0.8851, below the 161.8% Fibo extension
High Risk Investment Warning
Trading Forex/CFDs on margin carries a high level of risk and may not be suitable for all investors. Leverage can work against you.
Stratos Markets Limited (www.fxcm.com):
CFDs are complex instruments and come with a high risk of losing money rapidly due to leverage. 68% of retail investor accounts lose money when trading CFDs with this provider. You should consider whether you understand how CFDs work and whether you can afford to take the high risk of losing your money.
Stratos Europe Ltd, previously FXCM EU Ltd (www.fxcm.com):
CFDs are complex instruments and come with a high risk of losing money rapidly due to leverage. 73% of retail investor accounts lose money when trading CFDs with this provider. You should consider whether you understand how CFDs work and whether you can afford to take the high risk of losing your money.
Stratos Trading Pty. Limited (www.fxcm.com):
Trading FX/CFDs carries significant risks. FXCM AU (AFSL 309763), please read the Financial Services Guide, Product Disclosure Statement, Target Market Determination and Terms of Business at www.fxcm.com
Stratos Global LLC (www.fxcm.com):
Losses can exceed deposits.
Please be advised that the information presented on TradingView is provided to FXCM (‘Company’, ‘we’) by a third-party provider (‘TFA Global Pte Ltd’). Please be reminded that you are solely responsible for the trading decisions on your account. There is a very high degree of risk involved in trading. Any information and/or content is intended entirely for research, educational and informational purposes only and does not constitute investment or consultation advice or investment strategy. The information is not tailored to the investment needs of any specific person and therefore does not involve a consideration of any of the investment objectives, financial situation or needs of any viewer that may receive it. Kindly also note that past performance is not a reliable indicator of future results. Actual results may differ materially from those anticipated in forward-looking or past performance statements. We assume no liability as to the accuracy or completeness of any of the information and/or content provided herein and the Company cannot be held responsible for any omission, mistake nor for any loss or damage including without limitation to any loss of profit which may arise from reliance on any information supplied by TFA Global Pte Ltd.
The speaker(s) is neither an employee, agent nor representative of FXCM and is therefore acting independently. The opinions given are their own, constitute general market commentary, and do not constitute the opinion or advice of FXCM or any form of personal or investment advice. FXCM neither endorses nor guarantees offerings of third party speakers, nor is FXCM responsible for the content, veracity or opinions of third-party speakers, presenters or participants.

Bullish bounce?USD/CHF is falling towards the pivot and could bounce to the pullback resistance.
Pivot: 0.8883
1st Support: 0.8840
1st Resistance: 0.8983
Risk Warning:
Trading Forex and CFDs carries a high level of risk to your capital and you should only trade with money you can afford to lose. Trading Forex and CFDs may not be suitable for all investors, so please ensure that you fully understand the risks involved and seek independent advice if necessary.
Disclaimer:
The above opinions given constitute general market commentary, and do not constitute the opinion or advice of IC Markets or any form of personal or investment advice.
Any opinions, news, research, analyses, prices, other information, or links to third-party sites contained on this website are provided on an "as-is" basis, are intended only to be informative, is not an advice nor a recommendation, nor research, or a record of our trading prices, or an offer of, or solicitation for a transaction in any financial instrument and thus should not be treated as such. The information provided does not involve any specific investment objectives, financial situation and needs of any specific person who may receive it. Please be aware, that past performance is not a reliable indicator of future performance and/or results. Past Performance or Forward-looking scenarios based upon the reasonable beliefs of the third-party provider are not a guarantee of future performance. Actual results may differ materially from those anticipated in forward-looking or past performance statements. IC Markets makes no representation or warranty and assumes no liability as to the accuracy or completeness of the information provided, nor any loss arising from any investment based on a recommendation, forecast or any information supplied by any third-party.

Trade Signal for USDCHF: Sell OpportunityDirection: Sell
Enter Price: 0.89376
Take Profit: 0.89188
Stop Loss: 0.89618
Dear Traders,
We have identified a promising sell opportunity for the USDCHF currency pair. Our prediction has been carefully analyzed and generated using the EASY Quantum Ai strategy.
Several key factors contribute to this bearish outlook:
1. Technical Indicators: Recent technical analysis indicates that USDCHF is currently encountering resistance at key levels, which could result in a downward movement. The Relative Strength Index (RSI) is signaling a potential bear market as it approaches the overbought zone.
2. Fundamental Analysis: Current economic indicators for the US and Switzerland show diverging trends. The latest data reveals stronger-than-expected economic performance in Switzerland, alongside concerns over US economic policies affecting the dollar's strength.
3. Market Sentiment: Sentiment analysis suggests that traders are increasingly favoring the Swiss Franc over the US Dollar. This shift in market sentiment aligns with our sell forecast.
Hence, we recommend entering a sell position at 0.89376 with a target profit of 0.89188 and a protective stop loss at 0.89618. This trade setup aims to capitalize on expected downward momentum while managing potential risk.
Happy Trading!
This signal is generated using the EASY Quantum Ai strategy. Always perform your own analysis before making any trading decisions.

USDCHF Set To Grow! BUY!
My dear subscribers,
USDCHF looks like it will make a good move, and here are the details:
The market is trading on 0.8931 pivot level.
Bias - Bullish
Technical Indicators: Both Super Trend & Pivot HL indicate a highly probable Bullish continuation.
Target - 0.8958
About Used Indicators:
The average true range ATR plays an important role in 'Supertrend' as the indicator uses ATR to calculate its value. The ATR indicator signals the degree of price volatility.
———————————
WISH YOU ALL LUCK
