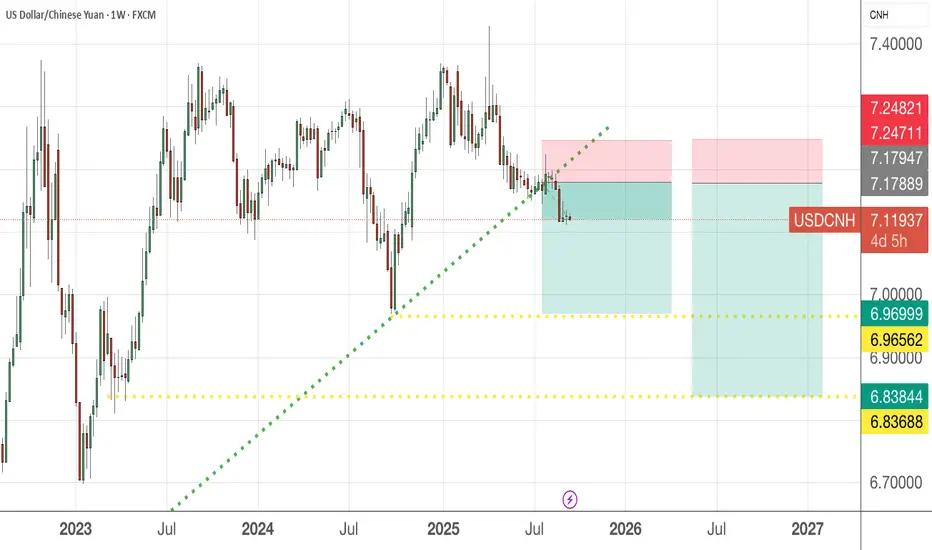
USDCNH -Rising WedgeUSDCNH has shown a breakdown from a rising wedge and am waiting to see if an accelerated move to the downside can occur.
The guideline would be for prices to return to the widest part of the wedge.
The September 2025 breakdown from the lower line saw a rebound to the underside which is a classic textbook application, and it exhibits swing low reinforces the probability of further downside.
The 3 markings are possible projections. Watch how it unfolds to determine the support level.
US Dollar / Chinese Yuan
No trades
Trade ideas

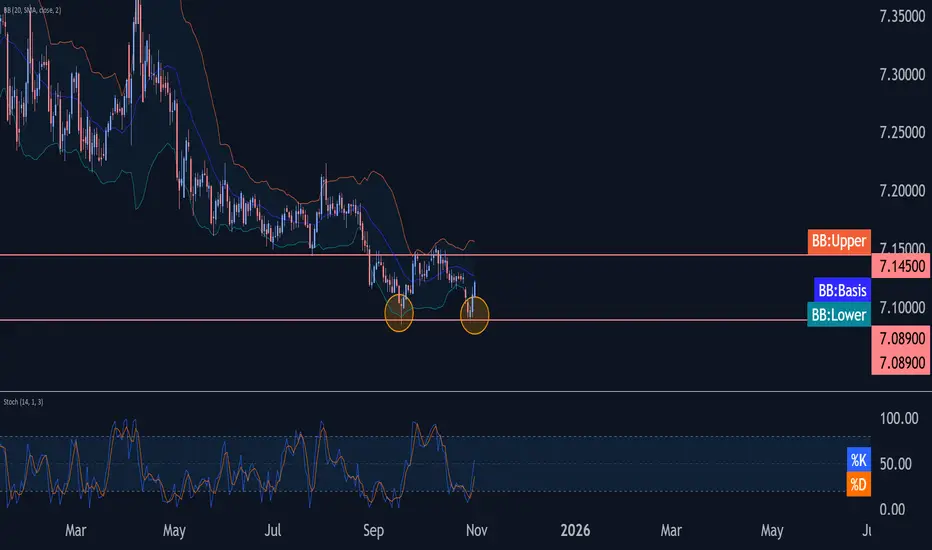
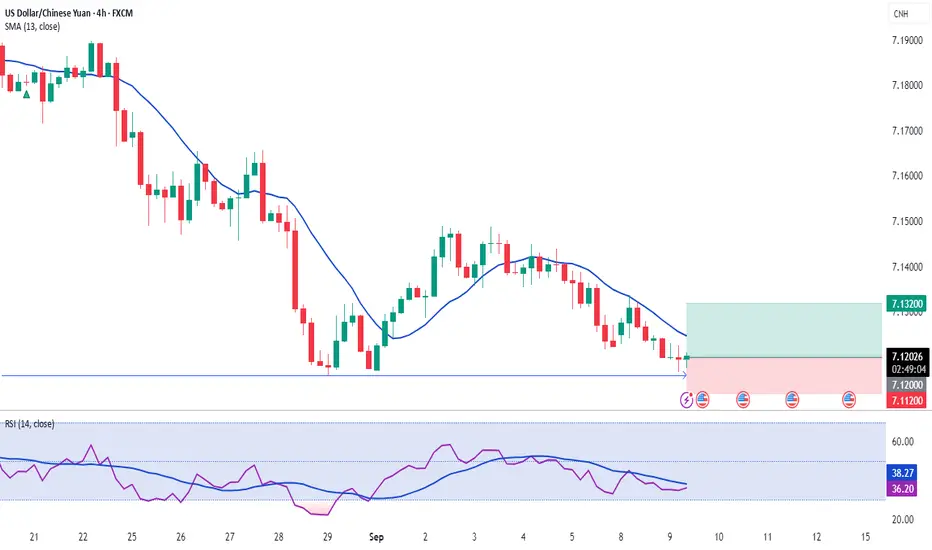
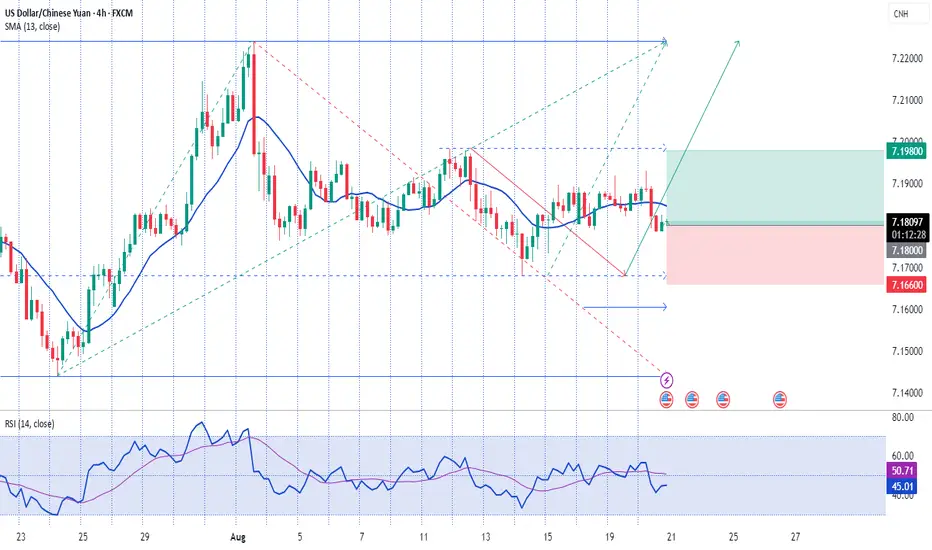
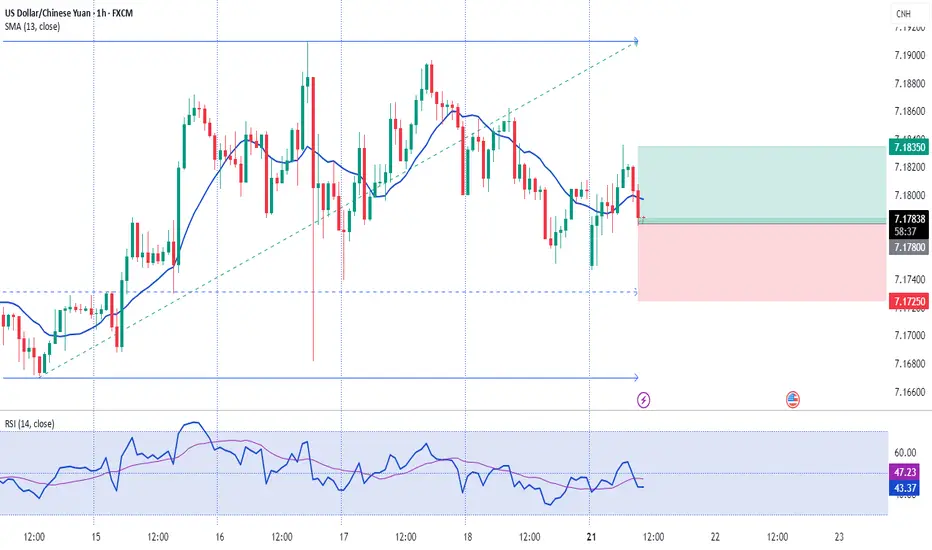
USDCNH Wave Analysis – 31 October 2025- USDCNH reversed from key support level 7.0890
- Likely to rise to resistance level 7.145
USDCNH currency pair recently reversed from the support area between the key support level 7.0890 (which stopped the previous impulse wave 1 in the middle of September) and the lower daily Bollinger Band.
The upward reversal from this support area created the daily Japanese candlesticks reversal pattern Morning Star – strong buy signal for USDCNH.
Given the strength of the support level 7.0890, USDCNH can be expected to rise toward the next resistance level 7.145 (former support from July, which stopped earlier waves iv, a and 2).
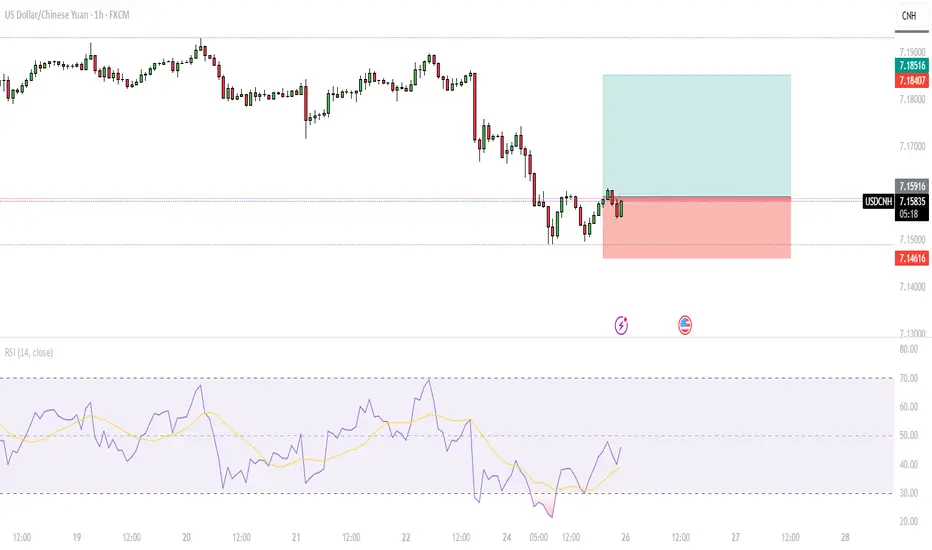
USDCNH⬆️ Buy Entry: 7.10800
⏹️ Stop Loss: 7.09400
*️⃣ Take Profit: 7.12800
🔠 Expectation of price growth from strong levels of medium-term support against the backdrop of fundamental data publications.
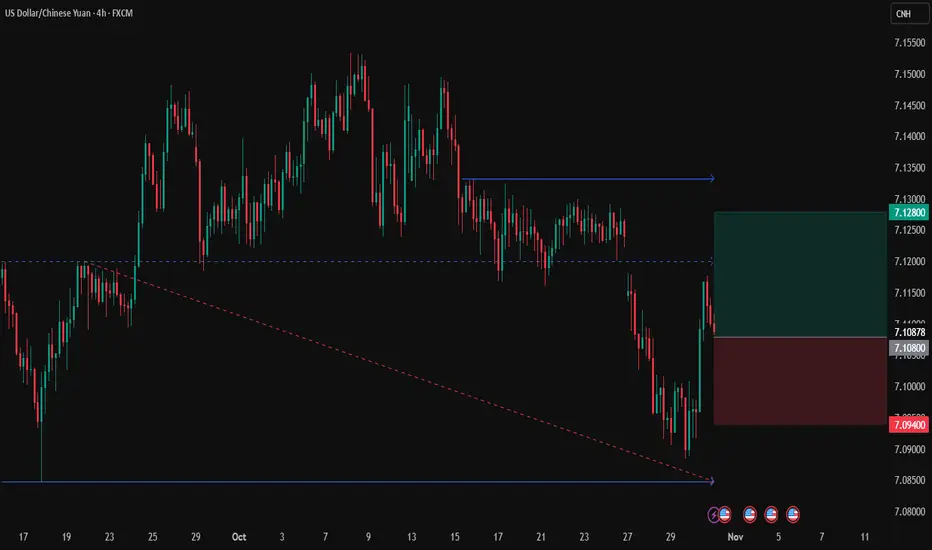
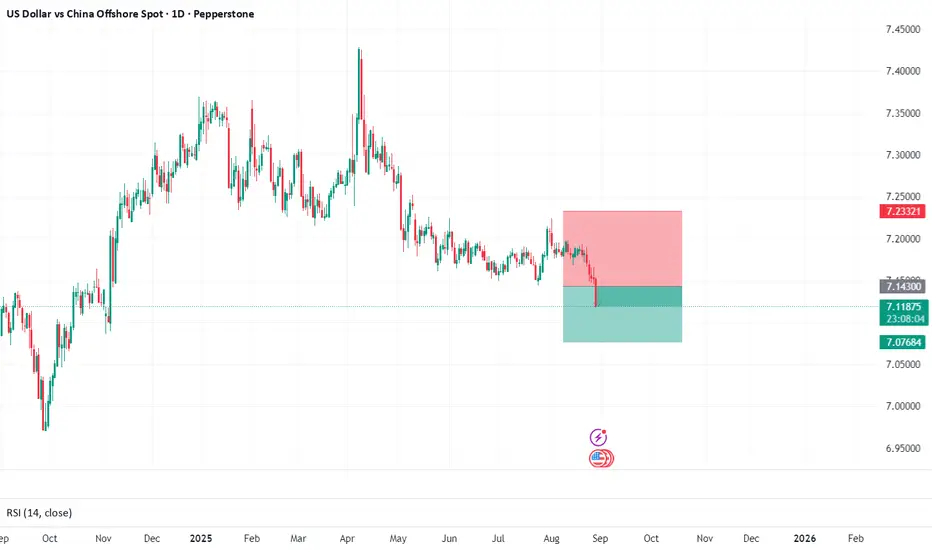
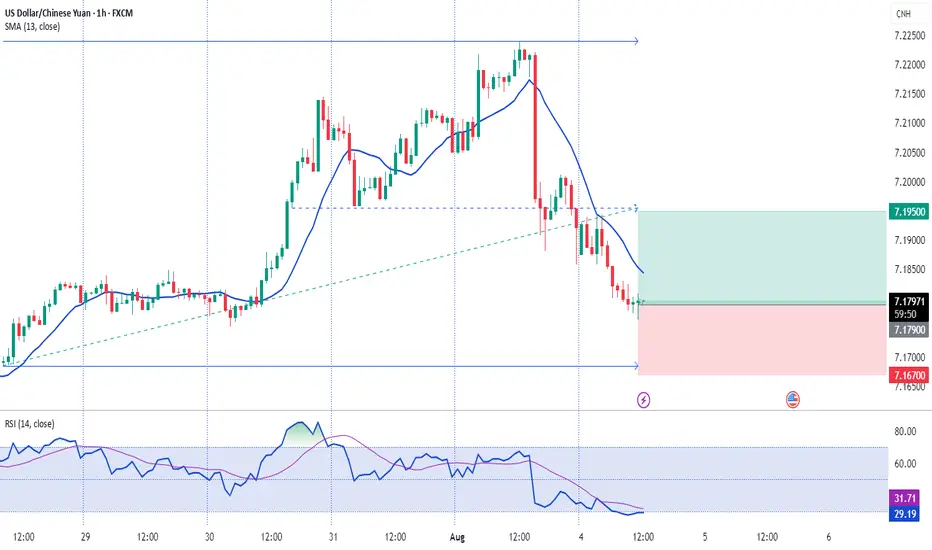
USD/CNH Break Lower Could Target 7.0000Is a possible reset in relations between the world’s two most powerful nations about to see the Chinese yuan strengthen sharply? USD/CNH is coiling in a descending triangle formation, and the risk of a break lower is arguably increasing—even if the reset proves short-lived.
After breaking beneath the 50-day moving average on August 28, USD/CNH tried twice to reclaim the level earlier this month but failed to sustain the move. The pair has since resumed its push lower, leaving it teetering on support at 7.1000 today. The last time USD/CNH attempted to break beneath this level, it triggered a sharp reversal, printing a hammer candle on the daily chart that marked the start of a squeeze higher.
While that move failed, this one may have more success, arriving just before a likely trade deal between the U.S. and China on the sidelines of the APEC summit in South Korea later this week. There’s always the risk the framework could unravel quickly, but the backdrop screens as supportive for the yuan: the Fed is widely expected to cut rates again while retaining a dovish bias, and risk appetite is strong across Asia.
Given the triangle pattern, a close beneath 7.1000 may spark a fresh wave of selling, putting the pair on track for a possible move toward the psychologically important 7.0000 level, based on the height of the triangle.
Shorts could be considered below 7.1000 with a stop above, targeting the September 17 low of 7.0850 initially. Beneath that, price action at 7.0600 and 7.0400 may provide clues as to whether the ultimate target of 7.0000 is likely to be reached.
Momentum indicators are generating strengthening bearish signals. RSI (14) is trending lower below 50 but is not yet oversold. MACD has confirmed by staging a bearish crossover of the signal line in negative territory, indicating downside pressure is building.
Good luck!
DS

China Yuan Direction & Critical Dollar SupportThe US dollar is still the leading global payment currency, holding a significant share of 49% compared to all other currencies.
However, the Chinese yuan is on the rise. Although it currently accounts for only 3.5%, its growth over the past two years has drawn my attention.
The yuan’s share increased from 2% in 2023 to 3.5% this year, representing a 75% increase in just 2 years.
And for global commerce, the growth is even more striking:
“In trade, 6% of global commerce was financed in RMB last year, up from under 2% in 2023.”
This represents a 200% increase in the use of the yuan for trade in also just 2 years.
If the yuan continues to grow at the same pace — at a 75% increase every 2 years —
it would take roughly 11 to 12 more years to reach 49%, i.e., around the year 2036.
Video version for the statistics:
Offshore Chinese Renminbi Futures and Options
Ticker: CNH
Minimum fluctuation:
Outright:0.0005 per USD increment = 50 CNH
Disclaimer:
• What presented here is not a recommendation, please consult your licensed broker.
• Our mission is to create lateral thinking skills for every investor and trader, knowing when to take a calculated risk with market uncertainty and a bolder risk when opportunity arises.
CME Real-time Market Data help identify trading set-ups in real-time and express my market views. If you have futures in your trading portfolio, you can check out on CME Group data plans available that suit your trading needs www.tradingview.com

Bulls Coiled at Proven Support - Divergence Spring LoadsUSDCNH: Bulls Coiled at Proven Support - Divergence Spring Loads
**RECOMMENDED EXIT DATE TO AVOID VOLATILITY:** October 17, 2025 (End of Day)
This gives you 8-10 trading sessions to capture the technical move while avoiding China's Q3 GDP release (expected October 17-18), which could trigger significant volatility and gap through your stop loss on this 4H/8H timeframe trade.
The Market Participant Battle:
At point 1, bulls initiated a strong rally that peaked at point 3, successfully closing above the initial point 1 high. This price action established the buyers at point 2 as proven market participants who demonstrated their ability to drive price higher. Now, at point 4, price has returned precisely to this validated buyer zone around 7.1234. The logical expectation: these proven bulls, who successfully pushed price from point 2 to point 3, will defend their territory and drive another bullish leg. This is the classic "return to proven participants" setup where institutional memory creates predictable reactions.
Confluences:
Confluence 1: Triple Hidden Bullish Divergence with Oversold Conditions
From point 4 onward, price action creates higher lows in the actual price structure. However, examining the RSI, MFI, and CVD candles reveals lower lows forming simultaneously - textbook hidden bullish divergence across three independent indicators. This triple confirmation signals that despite price making higher lows, the underlying selling pressure is weakening dramatically. Additionally, both RSI and MFI have entered oversold territory, indicating exhaustion of the current downward pressure. The CVD (Cumulative Volume Delta) piercing the lower Bollinger band adds another layer of confirmation - extreme selling exhaustion often precedes sharp reversals. This confluence strongly supports the bullish thesis, suggesting the market is coiled for an upward expansion.
Confluence 2: Volume Profile Concentration at Point 4 Low
Using volume profile analysis from the point 2 to point 3 swing, a clear pattern emerges: the majority of bullish volume is heavily concentrated at the point 4 low around 7.1234. This volume concentration represents institutional conviction - large players who accumulated significant positions at this level have a vested interest in defending it. When price returns to areas of high volume accumulation, those participants typically act to protect their positions, creating strong support. This volume-based confluence validates that point 4 isn't just a technical level but a genuine zone of institutional interest and commitment.
Confluence 3: Linear Regression Channel Pullback Precision
Overlaying a linear regression channel from the point 2 low through the point 3 high reveals remarkable precision: the channel's lower boundary intersects exactly at the point 4 turning point. This geometric and statistical confluence adds mathematical validation to the setup. Linear regression channels identify the mean and standard deviation boundaries of price movement, and when price touches the lower boundary, it suggests a statistically probable reversion toward the mean. The precise intersection at point 4 isn't coincidence but confirmation that this level represents both geometric symmetry and statistical significance.
Web Research Findings:
- **Technical Analysis:** Current USDCNH price around 7.13, with mixed technical sentiment. Some analysts identify inverse H&S pattern suggesting upside breakout potential above 7.15. Support levels identified at 7.1782, 7.1754, and 7.1730. RSI showing overbought conditions on some timeframes (70.7 on daily), but your 4H/8H setup shows oversold divergence. ADX at 34.46 indicates strong trend presence.
- **Recent Economic Data:** China Q2 2025 GDP grew 5.2% YoY (beat 5.1% forecast), demonstrating economic resilience. Industrial output rose 6.8% in June (beat 5.6% forecast), showing manufacturing strength. However, retail sales grew 4.8% (missed 5.2% forecast), indicating consumer spending weakness. China PMI data mixed with manufacturing at 49.4 (August), showing contraction.
- **Analyst Sentiment:** MIXED outlook on USDCNH. Some analysts see potential breakdown toward 7.15 or lower if risk sentiment improves. Elliott Wave analysts project long-term targets of 7.48-7.76 for continued dollar strength. Shorter-term technicals show coiling pattern awaiting direction. Overall sentiment is NOT overwhelmingly one-sided, creating opportunity for contrarian technical plays.
- **Data Releases & Economic Calendar:**
- **CRITICAL:** China Q3 GDP release expected October 17-18, 2025 (Friday) - this is your primary volatility risk
- China PMI releases early October (already past)
- US FOMC meeting October 28-29, 2025 (less immediate concern for your timeframe)
- China retail sales and industrial production data alongside GDP on October 17-18
- **Monetary Policy Impact:** PBOC maintaining "moderately loose" monetary policy stance with supportive measures for growth. Rate cuts and reserve requirement reductions remain on the table. The central bank is focused on stabilizing the yuan while supporting domestic economy. Fed cut rates by 0.25% in September to 4.00-4.25%, with another cut expected at October 28-29 meeting. The divergence between easing Fed and supportive PBOC creates complex dynamics for USDCNH.
Layman's Summary:
Here's what all this research means for your trade: China's economy is showing resilience with better-than-expected growth, which typically strengthens the yuan (bearish for USDCNH). However, the PBOC is deliberately keeping policy loose to support growth, which prevents excessive yuan strength (supportive for USDCNH stability). The Fed is cutting rates, which usually weakens the dollar, but the market has already priced in much of this expectation.
The key insight: while fundamentals are mixed, your technical setup is capturing a potential counter-move against the recent yuan strength. The market has pushed USDCNH down to proven support levels where institutional buyers previously showed conviction. The critical risk is the October 17-18 GDP release - if China reports much stronger or weaker than expected growth, it could gap through your technical levels. Your best play is to let the trade work for 8-10 sessions and exit before this binary event.
Machine Derived Information:
- **Image 1 (Narrative Setup - Points 1→4):** Chart shows 4H/8H timeframe with USDCNH forming higher highs from point 1 through point 3, establishing point 2 buyers as proven participants. Price returns to point 4 at proven support around 7.1234. Trend indicators visible at bottom showing multiple timeframe analysis with sideways/uptrend signals. Multiple US flag icons indicate economic data release dates throughout the timeframe. **Significance:** Establishes the core thesis - return to proven institutional support where previous buyers demonstrated ability to push price higher. **AGREES ✓** - The narrative setup is technically sound with clear structure.
- **Image 2 (Confluence 1 - Divergences):** Multiple oscillator panel showing RSI, MFI, and CVD indicators alongside main price chart. Price action shows higher lows from point 4 onward, while RSI, MFI show lower lows. RSI in oversold territory below 30. MFI also oversold. CVD showing "Bear" and "Bull" labels with declining pattern hitting lower Bollinger band. **Significance:** Triple hidden bullish divergence across independent indicators is powerful confirmation. Oversold conditions on multiple oscillators suggest exhaustion of selling pressure. CVD piercing lower BB indicates climactic selling. **AGREES ✓** - Strong technical confluence supporting bullish reversal potential.
- **Image 3 (Confluence 2 - Volume Profile):** Chart displays volume profile histogram overlay on price action from point 2 to point 3 swing. Heavy volume concentration (pink/red coloring) visible at the point 4 low region around 7.1234. Horizontal support line clearly marked at this level. **Significance:** Institutional volume concentration at point 4 validates this as genuine support, not just technical line. Large players accumulated here and have incentive to defend. **AGREES ✓** - Volume-based confirmation adds conviction to the support thesis.
- **Image 4 (Confluence 3 - Linear Regression Channel):** Broadening channel structure overlaid on price chart with blue/red shaded areas showing regression boundaries. Channel originates from point 2 low, expands through point 3, and lower boundary precisely intersects point 4. **Significance:** Statistical and geometric confluence confirming point 4 as both mean reversion target and structural support. **AGREES ✓** - Mathematical precision adds weight to setup quality.
- **Image 5 (Conclusion - Risk/Reward Setup):** Zoomed out 4H chart showing full trade structure with numbered points 1-4. Target zone shown in teal/cyan at 7.21 area. Stop loss zone in pink/red below 7.11. Entry around current 7.13 level. Risk/reward visually demonstrates approximately 2:1 to 2.5:1 ratio. **Significance:** Clear visualization of trade mechanics with defined entry, stop, and target levels. Risk management is appropriate for the setup. **AGREES ✓** - Trade structure shows proper risk/reward framework.
Actionable Machine Summary:
The AI analysis of all provided charts reveals a technically coherent bullish setup with multiple independent confirmations. The narrative structure (proven participants returning to support), combined with triple hidden divergences, volume concentration, and regression channel precision, creates a compelling technical case. All five images align to support the bullish thesis - there are no contradictory technical signals visible in the provided charts. The setup quality is high with clear entry, stop, and target zones defined.
Key machine-derived insight: The convergence of multiple technical factors at the 7.1234 level (point 4) is not coincidental but represents a genuine zone of technical and institutional significance. The hidden divergences suggest that despite the recent downward pressure, the underlying momentum is shifting bullish. Execute this trade with defined risk management and strong awareness of the October 17-18 volatility catalyst.
Conclusion:
**Trade Prediction: SUCCESS**
**Confidence: MEDIUM**
**Risk/Reward Ratio: 2.5:1**
This USDCNH long setup presents a technically sound opportunity despite mixed fundamental backdrop. The trade's strength lies in the convergence of multiple independent technical factors: proven participant theory (return to point 2 buyers), triple hidden bullish divergence across RSI/MFI/CVD, institutional volume concentration, and linear regression channel precision.
The Medium confidence rating reflects the reality that while the technical setup is solid, the fundamental environment shows mixed signals. China's economy is performing better than expected, PBOC policy remains supportive, but analyst sentiment on USDCNH is divided. Some see breakdown potential, others see continued dollar strength. This creates a scenario where your technical edge matters more than usual - you're playing a counter-move against recent yuan strength, betting that the market has pushed too far too fast into proven institutional support.
**Key Reasons for Success:**
1. Multiple proven participants returned to defend the point 2 support zone where they previously demonstrated buying conviction
2. Triple hidden bullish divergence across independent momentum indicators signals underlying strength despite surface weakness
3. Oversold conditions on RSI/MFI with CVD piercing lower Bollinger band indicates climactic selling exhaustion
4. Heavy institutional volume concentration at point 4 low validates genuine support, not just technical line
5. Linear regression channel lower boundary intersection provides statistical confirmation of mean reversion potential
**Key Risks:**
1. China Q3 GDP release October 17-18 could gap through technical levels if data surprises significantly
2. Recent yuan strength trend could continue if risk sentiment improves or China data continues beating
3. Analyst sentiment is mixed with some calling for USDCNH breakdown toward 7.15 and lower
4. Fed rate cuts and dollar weakness could undermine the dollar side of this pair
5. 4H/8H timeframe requires quick execution - less margin for error than daily/weekly setups
**Risk/Reward Assessment:** The 2.5:1 R/R ratio is acceptable for a setup with Medium confidence. Your stop below 7.11 is appropriately placed beneath the point 4 low and institutional volume concentration, while your target around 7.21 represents a return to the proven participant battleground near point 2. This ratio justifies the trade even with mixed fundamentals.
**Final Recommendation: TAKE THE TRADE** with these critical conditions:
- Execute with proper position sizing for Medium confidence (consider 50-70% of normal size)
- Set hard stop loss below 7.11 (below point 4 and volume concentration)
- Monitor closely given 4H/8H timeframe nature
- **MANDATORY: Exit by October 17 EOD to avoid GDP volatility risk**
- If price reaches target before October 17, take profits or trail stop aggressively
- Watch for any unexpected PBOC policy announcements or China data surprises that could invalidate setup
The convergence of technical factors at point 4 creates a high-probability reversal scenario, but the mixed fundamental backdrop and upcoming volatility catalyst require disciplined risk management. This is a tactical technical play, not a fundamental conviction trade. Execute with precision and respect the exit deadline.
**RECOMMENDED EXIT DATE TO AVOID VOLATILITY:** October 17, 2025 (End of Day) - Final reminder: China Q3 GDP release will likely trigger significant volatility that could invalidate technical levels. Protect your capital by exiting before this binary event.
Analysis Methodology:
This analysis employs multiple technical confluences including trend analysis, support/resistance levels, momentum divergences, volume profile analysis, linear regression channels, and proven participant theory to identify high-probability trade setups. The methodology combines price action, indicator analysis, and statistical tools to create comprehensive trade frameworks with defined risk/reward parameters.

USDCNH Inverse Head and Shoulders PatternUSDCNH is forming inverse H&S after finding support from major level.
Wait for the price to break the 7.15 level and establish above to enter.
SL at 7.08

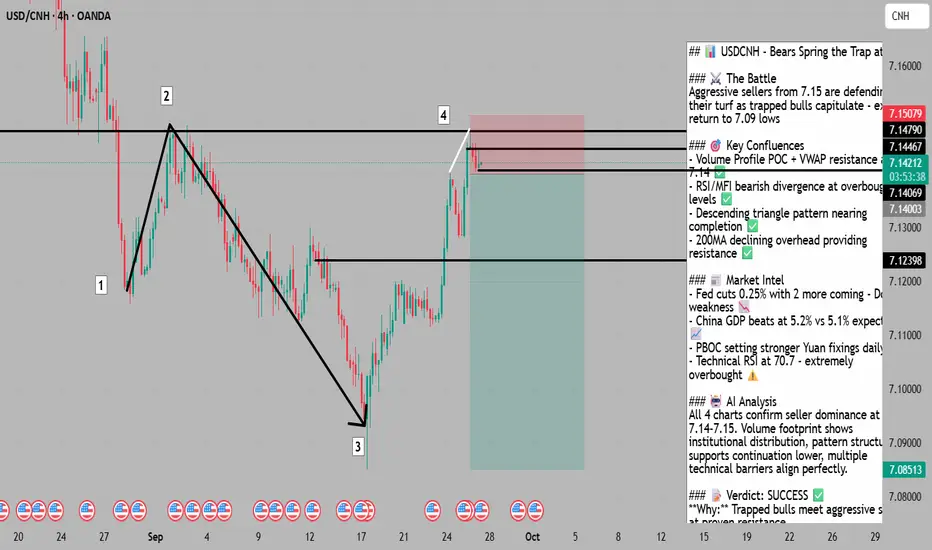
Perfect Storm - Sellers Reload at 7.14📍 To see my confluences and/or linework: Step 1: Grab chart 📊, Step 2: Unhide Group 1 in object tree 🌳, Step 3: Hide and unhide specific confluences 🎯
The Market Participant Battle:
Sellers who dominated at point 2 (7.15) and drove price to point 3 (7.09) proved their control when price broke below point 1. Now at point 4, we're back at this proven seller zone where bears crushed bull hopes before. With fundamentals now massively favoring Yuan strength, these sellers have even more ammunition to defend their territory and push USDCNH lower!
Confluences:
Confluence 1: Volume Profile & VWAP Resistance 📊
Anchored VWAP from point 0 perfectly aligns with the pullback to point 2 and sits above point 4, creating dynamic resistance. Volume profile shows point 4 as a value area low with an empty volume cluster above point 2 that has rejected price twice. Sellers have the high ground!
Confluence 2: Bearish Divergence & Overbought Indicators 📉
Price made a higher high at point 4, but RSI, MFI, and CVD all printed lower highs - textbook bearish divergence! RSI at 70.7 and MFI scream overbought. The micro candle structure shows a lower low forming at point 4 where a candle closed below another - sellers are already attacking!
Confluence 3: Descending Triangle & Moving Average Resistance 🔻
4-hour chart shows a clean descending triangle with lower highs and horizontal support at 7.12398. Price is testing the upper boundary near 7.14467 while the 200-period MA declines from above, adding another layer of resistance.
Web Research Findings:
- Technical Analysis: RSI at 70.7 overbought, ADX 34.46 strong trend, support levels at 7.1782/7.1754/7.1730 📊
- Recent News/Earnings: China Q2 GDP 5.2% beat 5.1% expected, industrial output +6.8% beat 5.6% expected 💪
- Analyst Sentiment: Goldman Sachs/Citigroup bullish China, capital flowing to Chinese assets 🎯
- Data Releases: PBOC setting stronger Yuan fixings daily, China stimulus boosting consumption 📈
- Interest Rate Impact: Fed cut 0.25% Sept 17th with 2 more cuts projected 2025 - Dollar toast! 💵
Layman's Summary:
Perfect alignment! Technical sellers at 7.14 resistance now have fundamental rocket fuel. Fed is cutting rates (weakening dollar), China's economy is outperforming (strengthening Yuan), and PBOC is actively supporting their currency. It's like sellers at 7.14 just got reinforced by an entire army. When technicals and fundamentals align this strongly, powerful moves follow!
Machine Derived Information:
- Image 1: Volume footprint showing heavy selling at 7.14790 - Significance: Institutional distribution confirmed - AGREES ✔
- Image 2: 4H descending triangle with numbered points - Significance: Bearish pattern structure intact - AGREES ✔
- Image 3: 4H with MAs showing resistance confluence - Significance: Multiple technical ceilings align - AGREES ✔
- Image 4: Volume profile POC acting as resistance - Significance: High volume node rejection zone - AGREES ✔
Actionable Machine Summary:
Complete technical alignment! All four charts confirm seller dominance at 7.14-7.15. Volume footprint reveals aggressive distribution, descending triangle approaching completion, moving averages providing dynamic resistance, and volume profile POC acting as ceiling. With fundamentals also supporting the short, this is a rare perfect setup!
Conclusion:
Trade Prediction: SUCCESS ✅
Confidence: Very High
Technical resistance at proven seller zone + overwhelming fundamental Yuan support = explosive short opportunity. Fed easing cycle beginning, China outperforming, PBOC supporting Yuan - everything aligns for USDCNH decline. Entry at 7.14-7.15 with stops above 7.16, targeting 7.09 initially then 7.07-7.08. This is what high-conviction setups look like!
It will not be a fast short for USDCNHIf you want to short this pair, you got to be patient, probably months for it to hit the first target before we consider the 2nd target. Patience!
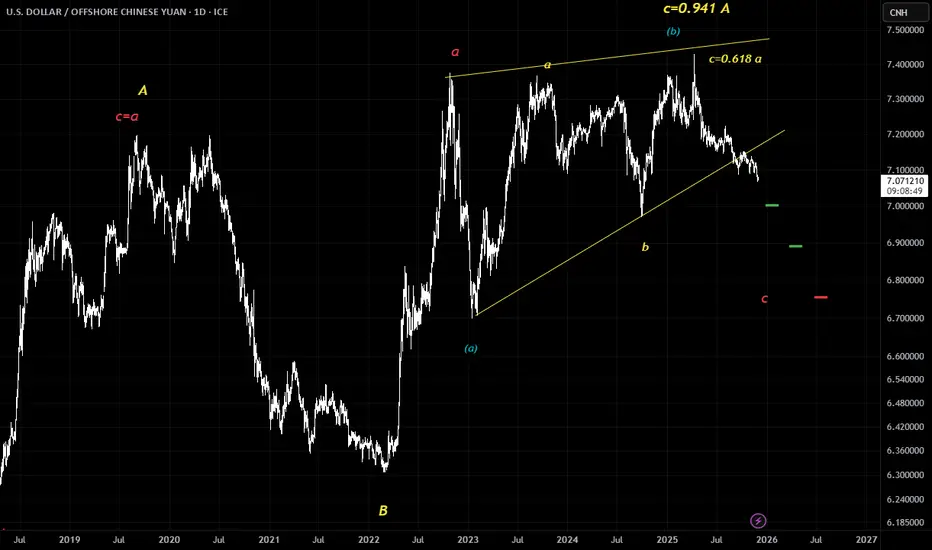
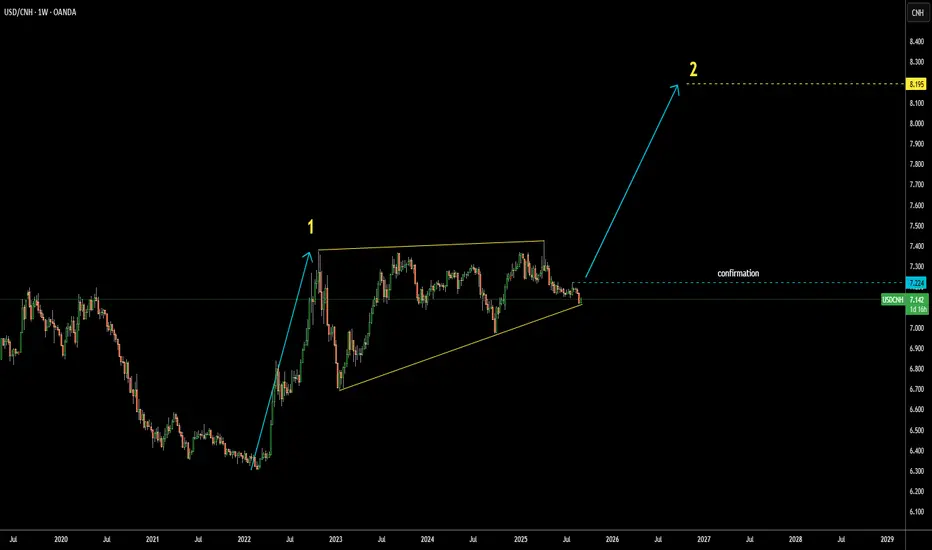
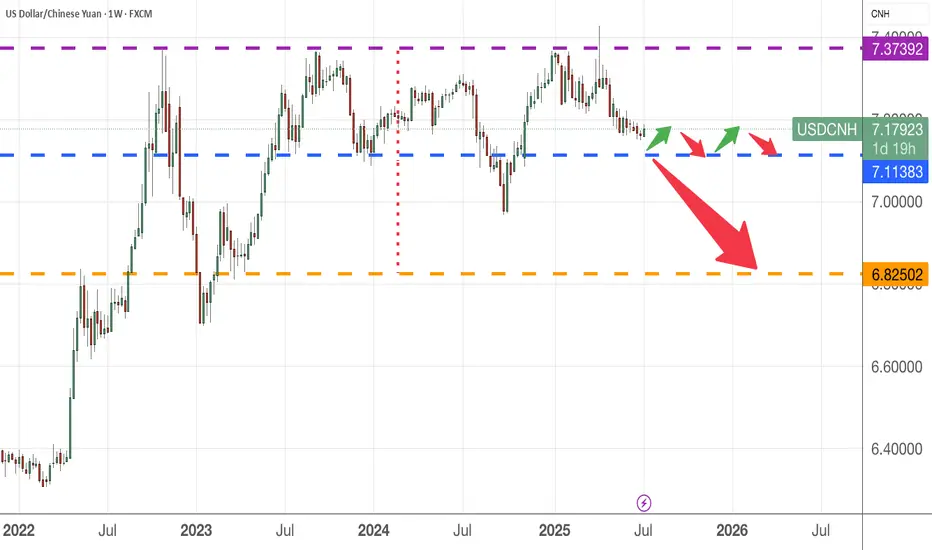
USDCNH: Consolidation Could Be Over, Target 8.195Current strength of Chinese yuan vs US dollar could soon lose momentum
USDCNH shows a classic two-leg move with a large consolidation in between.
The first leg unfolded rapidly in 2022, with the pair rocketing more than 1 yuan — from 6.30 to 7.37 — marking a huge depreciation.
That move was followed by a large, three-year consolidation, which now looks close to completing.
If leg two mirrors the distance of leg one, USDCNH could shoot past 8.00 and potentially reach 8.195.
The confirmation trigger is set at 7.224 — the peak of the most recent minor consolidation.
What could trigger such a massive yuan drop?
-New tariffs
-A major clash with the US
-A sharp economic downturn
What’s your take? Drop it in the comments below.
USDCNHHoping to wait for the pullback on USDCNH, and to get better entry as overall sentiment on USD is bearish. maybe as per technical insight it will retest the support again and i get the better entry to my bearish position.

USDCNHprice appears to be oversold, I'm expecting USD to find some strength this week, I will be taking longs on this pair risking 1:2 RR.
Time to load up on more YUAN - USDCNHThis is not a short term trade , in fact it should be a mid to longer term investment instead !
I believe the chinese yuan, RMB will continue to strengthen against the USD in the mid to longer term. Short term, we may find some sideway movements before it eventually breaks down from the 7.11 price level.
The target is 6.825. Please don't expect it to be a linear movement , there will be ups and down before it gets there.
As usual, please DYODD
Smart Money Concept Sell to Buy via Quasimodo EntriesPrice has swept upside liquidity above a key level and tapped perfectly into our supply zone (Discount) for a sell on the higher timeframe. When price gets to the demand zone (Discount), where we have a sweep (SWE) of sell-side liquidity, A break of structure (BOS) confirming bullish momentum and Price rallying into the supply zone, grabbing liquidity, then our buy will trigger.
Trade Ideas:
Look for confirmation to enter the sell or wait for the buy entry.
Take a buy from the order block marked on my POI.

29.06.2025 #USDCNHBUY 7.16250 | STOP 7.14850 | TAKE 7.17950 | The US dollar is likely to rise against the yuan amid political factors and the publication of data on business activity in the non-manufacturing sector (PMI) in China. Technically, the pair has approached and is consolidating around medium-term support levels.

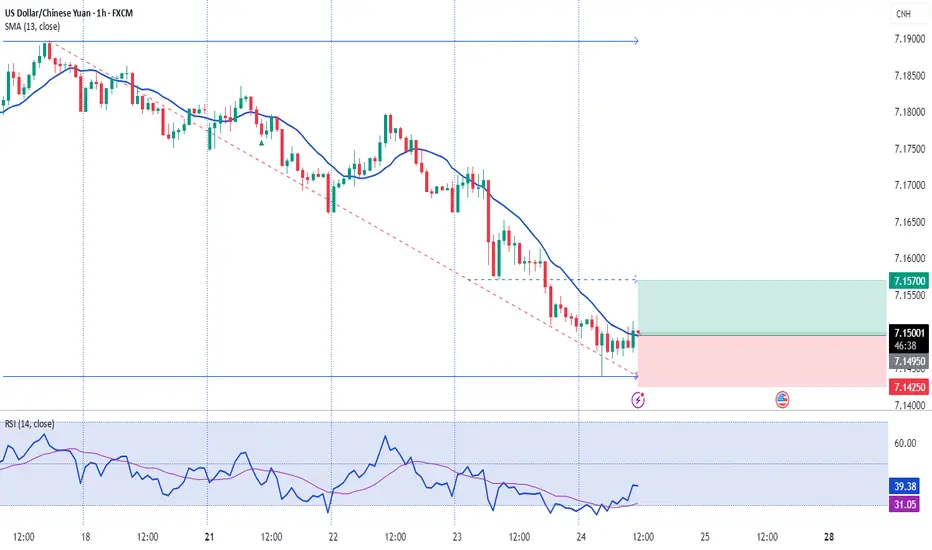
USDCNH short outlook weekly chartlook like we are breaking support levels and heading to the down side on weekly chart.
what do you guys think? any thoughts?
