Trade ideas

USDT.D 3D Chart: Retest and Bounce ScenarioHere is my analysis for USDT.D on the 3-Day (3D) timeframe.
I am expecting a pullback to retest the key support level at 4.978%. This looks like a classic S/R (Support/Resistance) flip.
If this support holds, I anticipate a bounce from this level towards the 6.480% resistance target.
This is not financial advice (NFA). Trade safely.

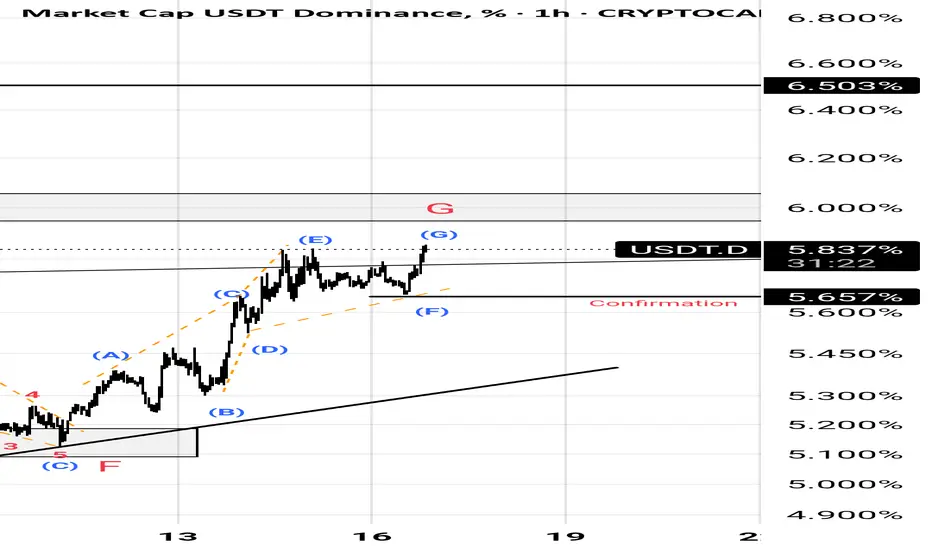
Usdt.d(based on NEo wave)Now 95% of wave G is recognizable and its a bow tie.
Waiting for post pattern confirmation.
USDT.D OUTLOOKYou can clearly see a descending structure here, but the sideways movement between 3.74% and 6.37% is also quite notable. The 6.24% level stands out as the first key resistance target.
If 6.24% fails to break and hold above, a pullback may occur.
So this region is crucial for determining whether USDT Dominance will continue higher or reject and reverse.
Also, the 6.24% level in USDT.D corresponds approximately to a $90,500 BTC price, making this zone even more important to watch.

USDT Dominance is a metter of time....CRYPTOCAP:USDT.D is a mater of time that it reverses back to 4% area, and this time I suspect that liquidity will be rotating from Bitcoin into majors caps.
Few days left for the unwind.
If not, bear market starts and USDT.D goes back to 9%
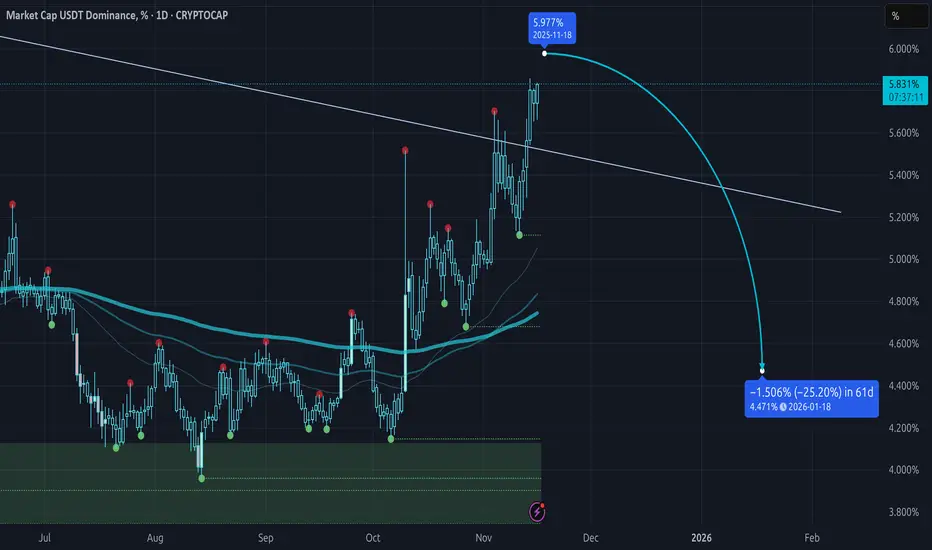
Chance is on our side.To me we can very much be topping here and money will return into assets for next few weeks..

usdt.d 4dHello
I am Mehdi with 4-hour analysis
Based on the analysis, we expect the cryptocurrency market to start a new upward trend
Reasons
1. We are at the ceiling of the daily timeframe channel
2. Accurate harmonic ratios
3. Price action pattern
4 MACD divergence
5 RSI divergence
Resistance level 5.7
Finally, thank you for supporting me by liking, sharing and commenting

#USDT_Dominance (Comparing USDT Dominance with Crypto market)This is simple can't go above the invalidation level.
Expecting a weekly time fame hidden bearish divergence

BTC and USDT.D - Marco Harmonic PatternsHere you can see a marco harmonic pattern forming where the Gartley could print on a large macro, and smaller Deep Crab to get us there. BTC will pump while USDT.D goes down, but that will be the final move for a, potentially, cycle top. Let see...

If USDT.D Breaks 6.2%, Say Goodbye to AltsUSDT.D is now heading toward a key resistance zone. Until it reaches that level, altcoins could continue to face selling pressure.
If USDT.D breaks and holds above the marked zone, it could signal the start of a broader bearish phase for the market. However, historically, this level has acted as a strong rejection zone, so a pullback from around 6.2% could once again bring relief for altcoins.
Keep a close eye on how dominance reacts here, the next move could decide the short-term trend for the entire market.
DYOR, NFA

#USDT This is the most Crucial Level for ALTCOINS!CRYPTOCAP:USDT is hitting a crucial level right now. How the price reacts here will decide the next market direction.
The blue trendline has been acting as resistance since January 2024, and this level is far more important than most realise.
For now, the best move is to wait and watch how the index behaves over the next few days.
A close above this level could make things ugly, but honestly, I think it’ll get rejected, and the market could go insane in the coming days or weeks.
We’ve already seen maximum pain and liquidation. This is that phase where people are bored and rekt, just before something big happens.
This is just my view; always do your own research.
Invalidation: Close above 5.70%
Let me know what you think in the comments, and don’t forget to hit that like 👍
Peace ✌️
#Altcoins

USDT.D(based on NEo wave)I think wave G is showing the pattern.
wave G might be a triangle or a diametric.
Im ready for both scenarios.

Is USDT.D About to Cool Off?USDT.D is moving within a rising wedge pattern. After bouncing from the lower boundary and retesting the zone.
It’s now approaching the upper boundary, where a potential rejection could take place.
DYOR, NFA

Market Sentiment Shifts: Fear & Greed, Liquidity & Next Cycle🌍 A truly global look at the market!
😱 The Fear & Greed Index has been sitting at 29 for the second day in a row, after recovering from 22–23 — even though the market has been trying to bounce for two days
That means all euphoria is dead — no more 10–15 random spikes a day.
📉 Short-term — not great.
📈 Long-term — that’s actually good.
⚠️ The index trying “get the bottom,” but historically major trend reversals happened around 10–15 points — keep that in mind.
💰 Meanwhile, index USDT.D looks ready for another big downward wave, which usually means stablecoins start flowing back into crypto 🐸
(Which ones? That’s the mystery for all, will see soon 😉)
🪙 A short bullish phase might last until spring 2026, or, if the cycle stretches, even until late 2026 – early 2027 😉
⁉️ But here’s the key question — where will the new money come from?
Because liquidating traders for $30–50B and then handing out “cashbacks” of $400–500M… that’s laughable 🐔
And expecting a March 2020-style buyback again? Unrealistic.
👉 Back then, people were locked at home, got freshly printed $, and instantly sent them to exchanges 💵
That was a real injection of fresh blood into the market — hundreds of billions.
Now? Nothing like that… or not yet 😉
🤔 What do you think — will a new wave of liquidity appear soon, or does the market still need more pain before the next leg up?
______________
◆ Follow us ❤️ for daily crypto insights & updates!
🚀 Don’t miss out on important market moves
🧠 DYOR | This is not financial advice, just thinking out loud

USDT Dominance at Key Resistance – Crypto Reversal Ahead?One of the key indices we can use to gauge the direction of the cryptocurrency market is USDT Dominance ( CRYPTOCAP:USDT.D ) .
In this analysis, let's look at USDT.D% on the weekly timeframe .
Currently, USDT.D% is moving in a Resistance zone(6.77%-5.25%) , Time Reversal Zone(TRZ) , and is near a Potential Reversal Zone (PRZ) .
From a classic technical analysis perspective, it seems that USDT.D% is inside a Symmetrical Triangle and is currently near the upper lines of this triangle.
In terms of Elliott Wave theory, USDT.D% looks like the corrective wave B of the main wave Y is completing.
So we might expect USDT.D% to move downwards again, at least towards the lower lines of the symmetrical triangle .
Note: This is purely a technical analysis. USDT.D% is at a sensitive area, and if it breaks above the upper lines of the triangle, we should anticipate a decline in Bitcoin and other tokens.
What do you think? Can USDT.D% break the upper lines of the symmetrical triangle and push the crypto market down again, or will the market bounce back? Let me know your thoughts!
Please respect each other's ideas and express them politely if you agree or disagree.
Market Cap USDT Dominance% Analyze (USDT.D%), Weekly frame.
Be sure to follow the updated ideas .
Do not forget to put a Stop loss for your positions (For every position you want to open).
Please follow your strategy and updates; this is just my Idea, and I will gladly see your ideas in this post.
Please do not forget the ✅' like '✅ button 🙏😊 & Share it with your friends; thanks, and Trade safe.

USDT Dominance and a Crucial Decision for Start of the New Week👋🏻 Hey everyone! Hope you’re doing great! Welcome to SatoshiFrame channel.
✨ Today we’re diving into the 4-Hour Tether Dominance analysis. Stay tuned and follow along!
💵 On the 4-hour timeframe, USDT dominance has formed a lower high compared to its previous peak, as well as a lower low, confirming a bearish market structure. A new key support has emerged around the 5.33% area, which — from a price action perspective — is weaker compared to the marked resistance zone in the analysis. This further strengthens my bearish bias.
↗️ USDT dominance has had a significant rally recently, but personally, I’m expecting a corrective move soon. It’s also important to pay attention to the confluences forming across multiple zones. The resistance at 5.57% aligns perfectly with the local bottoms of Bitcoin and altcoins — breaking above this level could be tough, as it’s quite a strong resistance.
⚖️ If we analyze the candlestick structure more closely and consider direct supply-demand dynamics, we can see that USDT dominance could drop sharply, with any potential pullbacks likely being bearish corrections (and I have reasons for this!). Why bearish corrections? Because we see strong downward candles on the 4H chart, followed by weak upward retracements. This indicates a clear bearish bias forming on USDT dominance.
🧮 Looking at the RSI oscillator, we can identify two important static zones — 70 and 46 — which currently act as key levels. Once RSI breaks through either of these areas, it could confirm a strong momentum shift, triggering a decisive move for USDT dominance.
💡 From a supply-demand and price action perspective, the coming week may unfold as follows: recent altcoin pumps give the total market cap (TOTAL) a bullish bias, while reinforcing a bearish bias for USDT dominance. If the new support at 5.33% breaks down, it could mark the beginning of another bullish wave across altcoins, potentially stronger than the previous one, and push the crypto market further into the bull cycle.
📊 From an index correlation point of view — if both Bitcoin dominance and USDT dominance decline, the overall market could move upward strongly. However, pay close attention: if Bitcoin dominance drops along with Bitcoin’s price, while USDT dominance fails to break its resistance and moves downward, it could create a perfect setup to open long positions on altcoins ready to pump. These could even be mid- to long-term longs worth holding.
❤️ Disclaimer : This analysis is purely based on my personal opinion and I only trade if the stated triggers are activated .

USDT Dominance (USDT.D) – 4H Technical AnalysisUSDT Dominance (USDT.D) – 4H Technical Analysis
Current Level: 5.36% (+0.49%)
Trend: Bullish with short-term correction
Technical Overview
USDT Dominance has been maintaining a bullish market structure, supported by a strong recovery from the 5.0%–4.9% equilibrium zone. The recent candle shows a short-term retracement after rejecting from the 5.45% resistance area (PDH zone).
Price is currently holding above the 50 EMA (white) and 200 EMA (yellow) — a signal that the overall market sentiment remains risk-off, favoring stablecoins over risk assets like BTC or altcoins.
Key Levels
Resistance:
5.45% → Previous Day High (PDH) and Supply Zone
5.50%–5.55% → Major resistance, previous liquidity zone
Support:
5.20% (Equilibrium) → Key structural support, aligns with PWH
4.95% → Dynamic support near 200 EMA
4.70%–4.75% → Strong Low / Demand Zone
Indicators
Stochastic RSI shows a recovery from the oversold area but still below 50, suggesting momentum is cooling down — a possible range or minor pullback before another push up.
The price is consolidating after a strong bullish impulse, indicating accumulation before potential continuation higher.
Market Implication
Rising USDT Dominance means traders are moving capital out of risk assets (BTC, ETH) into stablecoins — a bearish signal for crypto prices.
If dominance breaks above 5.45%, expect further downside in BTC and altcoins.
Conversely, if it drops below 5.20%, it could trigger a short-term crypto relief rally.
Summary
Bias: Bullish but in consolidation
Short-Term Expectation: Pullback to 5.20%–5.25%, then potential bounce
Invalidation: Close below 4.95% would shift structure to neutral

USDT.D MARKET ANALYSIS The USDT.D has been moving on an uptrend in the past day until formed a double top which is often a reversal pattern which often forms mostly in uptrend often signaling downtrend which has already been confirmed, then there is the break of structure which happened when the price closed below the previous high low into lower low also confirming the continuation of the down trend if the market breaks down we might see the continuation of the trend

Altseason Setup? Dominance Charts Flash Key Confluence!BTC.D & USDT.D Combined Outlook 🧩
BTC Dominance is approaching the 61.8%–62.6% Fibonacci zone, a strong resistance where Bitcoin usually cools off, often leading to a liquidity shift toward altcoins.
USDT Dominance is also heading into the 6% resistance zone, which has historically acted as support for altcoins. A rejection here would signal funds rotating from stablecoins into risk assets, favoring alts.
In short:
If both BTC.D and USDT.D get rejected from their current resistance zones, we could see a strong rebound in altcoins soon. But continued strength in both would keep pressure on alts for now.
DYOR, NFA
Thanks for reading! Appreciate your support and engagement

USDT.D 06.11.25I'm watching USDT.D closely here for potential reaccumulations or a distribution into the extreme supply. If it keeps the demand intact i will remember it for later, since this can simply just go higher.

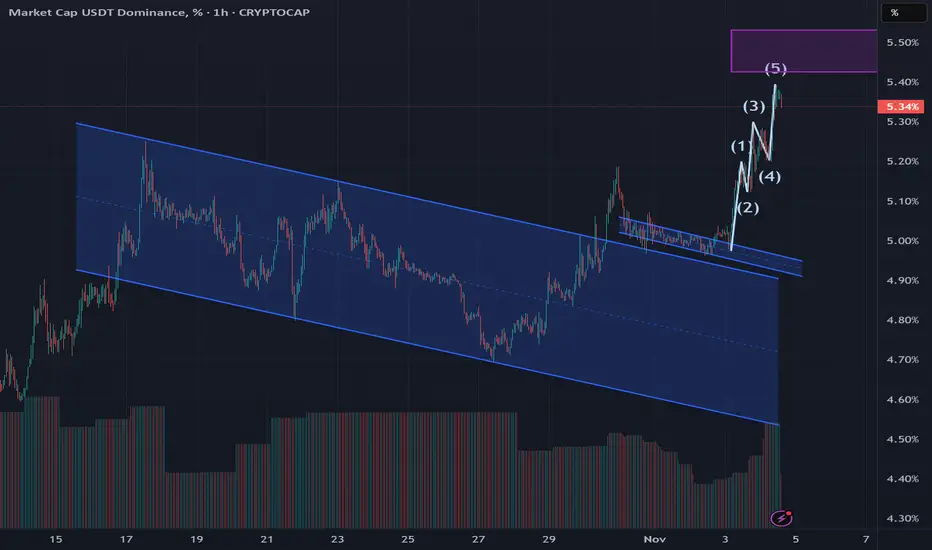
USDT Dominance AnalysisOn the USDT dominance chart, two bullish flags clearly formed and were fulfilled
Following this, a five-wave Elliott wave formed at the breakout. The length of the five waves almost matches the height of the flagpole from the larger bullish flag, meaning there's a chance we could reach the purple area, and only then will corrective waves form
As is well known, when USDT dominance rises, the price of BTC falls, and vice versa, when USDT dominance falls, the price of BTC rises
More detailed analysis, additional charts, and key levels to watch are available on our site
USDT Dominance - Wyckoff AccumulationCRYPTOCAP:USDT.D could be mirroring Tesla’s 2022–2024 Wyckoff structure. From 2022 to late 2024, NASDAQ:TSLA formed a clear Wyckoff Accumulation on the weekly chart: a Selling Climax set the range, an Automatic Rally confirmed resistance, and a brief Spring in early 2023 shook out bears before prices recovered on strong volume. The stock then established a Last Point of Support, followed by a Sign of Strength breakout in late 2024, signaling institutional accumulation and the start of a new uptrend.

$USDT.D Cycle Top Indicator HIT !A THIRD CYCLE TOP INDICATOR HAS FLASHED ⚠️
YES this chart is complete chicken scratch, and my mad scientist approach to viewing different trends in USDT Dominance.
I’ve had this November 3rd intersection mapped out for years now.
NO, I do not believe we are anywhere close to the top (see pinned tweet).
Bulls REALLY need to step up big this week with a rally.
We cannot afford two consecutive weeks above 5.5%
