UsOil longUsoil looks for more buy momentum use Stop-loss we have entered after confirmation only in this pair so it may slow process but sure process
USOIL.F trade ideas

Oil latest analysis and advice, hope to help you!Crude oil latest market trend analysis:
Crude oil news analysis: On Friday (May 31) in the US market, international oil prices rose and fell, and US crude oil is currently trading at $77.15 / barrel. In the past week, the crude oil market has experienced a series of volatility, with investors' eyes on the OPEC+ decision to cut production and the ups and downs of U.S. economic data. Investors are awaiting the OPEC+ meeting on Sunday, which will decide the future of the producers' alliance's production cuts. On Friday, WTI crude futures closed down $0.92 a barrel, or 1.18%, at $76.99 a barrel, while Brent futures fell $0.24 a barrel, or 0.3%, to $81.62 a barrel. For the week, Brent is down 0.6% and WTI is down 1%, WTI is down 4.8% in May and Brent is down 7.2%.
OPEC+ is widely expected to extend its production cuts, an expectation that dominated jitters heading into the weekend. There is currently no appetite to add more oil to the market, however a final decision from OPEC+ has yet to be revealed and the news that Saudi Arabia has invited ministers to attend the June meeting in person has added to the uncertainty. Investors are awaiting the OPEC+ meeting on Sunday, which will decide the future of the producers' alliance's production cuts. The crude oil market has experienced volatility this week caused by the OPEC+ decision to cut production and U.S. economic data. While OPEC+ is widely expected to continue its production cuts, the final outcome is still up in the air. At the same time, uncertainty about the pace of economic recovery in the United States and demand also put pressure on oil prices. The analysts' views and technical analysis provide us with an in-depth understanding of the market dynamics. With the release of more key data next week, volatility and trading opportunities in the crude oil market are expected to increase further.
Crude oil technical analysis: crude oil daily line, last Friday hit a low of 76.15 US dollars/ounce after the recovery, on Tuesday sharply rose above the 80 mark, and then fell back for two consecutive trading days, the overall trend is weak, is expected to continue to downward test support. From the point of view of the four-hour line, after reaching a high of 80.6 line on Wednesday, it began to fall sharply lower, and has now fallen to near the lower track of the Bollinger band, KDJ is running downward after the dead fork, MACD is running after the dead fork, the green energy column is released, and the short-term trend is weak. Overall, crude oil in the high 80.6 after falling down, you can see that want to stand still 80 mark is relatively difficult, it is expected that before the Opec meeting will not have too strong trend, the current or bearish, so this week's operation can refer to 78.6-79 region short, see 76.4-76.8 region. In summary, crude oil Monday's operation ideas suggested to rebound high altitude, back to the low more than supplemented, above the short-term focus on 78.5-79.0 line resistance, below the short-term focus on 76. 0-75.5 First-line support.

USOIL (Continuation falling)Oil prices increased early as we mentioned, recovering from a six-week low after a significant 4.3% fall the previous day, which was the lowest point since mid-March. This drop was attributed to an unexpected surge in U.S. stockpiles, indicating softer demand than anticipated.
At the same time, market observers have pointed out that the Federal Reserve has kept interest rates steady, diminishing earlier expectations for a rate cut. PVM Oil Associates commented, "The reduction in borrowing costs may not occur as soon or as quickly as previously thought. It is similar to peak oil demand—consistently anticipated yet never realized."
Technically:
The price has stabilized within the bearish zone, having already breached the pivotal range between 80.73 and 82.24. This suggests a continuation of the bearish trend, with potential targets at 76.80 and 75.35. A further break below 75.35 could lead the price down to 69.78.
Conversely, if the price stabilizes above 82.24, it may indicate a bullish trend, potentially reaching up to 86.86.
Pivot line: 78.00
Support lines: 76.80, 75.35, 69.78
Resistance lines: 80.73, 82.24, 86.86

Should we wait for lower oil prices?
In the analysis of the oil chart, the main trend line of the upward movement (blue line) has been broken, and the broken candle is marked with an arrow. It seems that we have to wait for lower prices for oil.
Do you agree with my opinion?

USOil moving lower**Monthly Chart**
Last month candle closed bearish after testing the low of key reversal candle of the previous month and started moving lower. The next target on monthly is around 71 level and then 63 level respectively.
**Weekly Chart**
Last week's candle closed as a bearish key reversal suggesting a continuation of the downtrend move.
**Daily Chart**
USOil broke the relative equal high of the range with the creation of manipulation candles at around 80 levels. The next target is to break the soft level of supports around 75.50 level and move aggressively lower. A corrective move around 78.00 level is required to push the price lower. The next target is around the 72 to 70 level.

WTI Crude Oil: LONGToday's session marks the beginning of the bullish move higher to test the April 2024 WTI highs. The ultimate target seems to be around the 85.00 - 87.00 region. This move begins now and may possibly extend to the end of June or early July.
The stop loss should be around the at least be 77.90.
Stay tuned for updates.

USOIL: Short-term oil prices are on the way to recovering to $80USOIL: Short-time period oil fees are at the manner to convalescing to BSE:EIGHTY because the marketplace is presently watching for the subsequent OPEC+ meeting. However, the chance of a lower is fantastically excessive due to the fact OPEC+ nations have nearly all showed the growth in production. This will probably reason oil fees to drop even lower. Consider ready to promote with USOIL around BSE:EIGHTY with the anticipated goal to go back to $75-76

WTI Oil Price Unchanged After OPEC+ MeetingWTI Oil Price Unchanged After OPEC+ Meeting
The OPEC+ meeting over the weekend did not have a substantial impact on the price of crude oil. As the chart shows, WTI oil opened today at $76.72 per barrel, while on Friday it closed at $76.57 – indicating that the decision made by oil producers is ambiguous.
The bullish argument is that restrictions on oil production to maintain its price will continue. According to Reuters, on Sunday, OPEC+ members agreed to extend the production cuts of 3.66 million barrels per day until the end of 2025.
The bearish argument is that eight OPEC+ countries have already signalled plans to gradually phase out voluntary cuts of 2.2 million barrels per day from October 2024 to September 2025.
Goldman Sachs analysts overall assessed the results of the meeting as more bearish for the market. "The communication of a gradual unwind reflects a strong desire to bring back production of several members given high spare capacity," they wrote.
The WTI crude oil chart shows that the market is breaking the upward trend (shown in blue), which we mentioned in our review on 10 May.
Since then, bulls attempted to resume the upward trend, but this only resulted in a false breakout of the psychological level of $80 per barrel on 29 May (indicated by an arrow).
Afterwards, bears regained control and sharply pushed the price below the lower boundary of the blue upward channel, making the downward channel (shown in red), which began in April, more relevant.
According to the technical analysis of the oil chart:
→ the price is near the median line of the red channel – a sign of temporary equilibrium between supply and demand;
→ below the current WTI crude oil price is an important level of $75.75, which provided support back at the end of winter.
If the bulls attempt a comeback (which would require fundamental drivers), the upper boundary of the downward channel may resist the price.
If the geopolitical situation in the Middle East does not escalate, the bears may continue to exert pressure aiming to break the $75.75 level – which would likely slow inflation and benefit the current U.S. administration ahead of the upcoming presidential elections.
Start trading commodity CFDs with tight spreads. Open your trading account now or learn more about trading commodity CFDs with FXOpen.
This article represents the opinion of the Companies operating under the FXOpen brand only. It is not to be construed as an offer, solicitation, or recommendation with respect to products and services provided by the Companies operating under the FXOpen brand, nor is it to be considered financial advice.

US/UK OILClear descending wedge on a weekly/daily structure, looking for a retest of previous resistance for entry. Break on trend line or 8 daily ema may mean a change of trend

Crude bouncesCrude oil has put in quite a turnaround over the last couple of trading sessions. At the end of last week, Brent and WTI had sliced through support and looked as if they were set to head lower. Both had broken down through the lower ends of their respective trading ranges that had been building since the beginning of this month. But prices suddenly turned higher and Brent and WTI are now comfortably back within their ranges once again. This has seen front-month WTI head back towards $80 per barrel, a level which has held as resistance this month. The daily MACDs on both contracts have been in oversold territory since early this month. But these had flattened out recently and turned higher, suggesting a rally could be on the cards. Well it has now happened, but not before support there was a break of significant support. There are meetings between OPEC and OPEC+ members this coming weekend. The expectation is that the group will extend its current production cuts from June through to the end of September. Before then, there’s an update on the Fed’s preferred inflation measure, Core PCE. This has the potential to upset investors if it were to come in above expectations, and thereby reduce the possibility of Fed rate cuts this year.

USOIL Downtrend Line Rejection At $78.11 31.05.2024- USOIL downtrend line rejection at $78.11 on 30-minute chart
- If rejection holds, likely drop to $77.44
- Break below $77.44 could lead to $75.53
- If rejection fails, potential rise to $78.63
- Break above $78.63 could push price to $79.00
- Apply Risk Management
_____________________________________________________________________________
Risk Warning: Trading in CFDs is highly speculative and carries a high level of risk. It is possible to lose all of your invested capital. These products may not be suitable for everyone, and you should ensure that you fully understand the risks taking into consideration your investment objectives, level of experience, personal circumstances as well as personal resources. Speculate only with funds that you can afford to lose. Seek independent advice if necessary. Please refer to our Risk Disclosure.
BDSwiss is a trading name of BDS Markets and BDS Ltd.
BDS Markets is a company incorporated under the laws of the Republic of Mauritius and is authorized and regulated by the Financial Services Commission of Mauritius ( FSC ) under license number C116016172, address: 6th Floor, Tower 1, Nexteracom Building 72201 Ebene.
BDS Ltd is authorized and regulated by the Financial Services Authority Seychelles (FSA) under license number SD047, address: Suite 3, Global Village, Jivan’s Complex, Mont Fleuri, Mahe, Seychelles. Payment transactions are managed by BDS Markets (Registration number: 143350)

Crude oil prices resumed their rise,Yesterday said that as long as yesterday's rising market did not break the starting point of the main fall of 3 waves 83.63 US dollars, it can be regarded as 4 waves rebound, currently is not broken 83.63 US dollars, but broke 80.11 US dollars, that is, broke the starting point of 5 waves of our previous number of waves, but now it can also be looked at as the abc three waves after the main fall of 5 waves. That is, the rise of the market from $76.15 to $80.62 is a wave, and the current pullback is a wave b, then the wave b will be back to $78.20-78.50 this range and then rise to $80.63 in order to walk out of a complete wave c, as long as it does not break $83.63 we can look at 4 waves rising. Breaking $83.63 is abc three waves after five waves, not breaking $83.63 is three sub-waves of four waves.
1, below $78.25 long, stop a loss of 30 points, stop a profit of about $80.25 (more aggressive can be long at $78.70).
2, short above $80.55, stop loss 35 points, stop profit of $78.50.
3, if the strategy 2 short is stopped, go short again at $81.70, stop a loss of 30 points, and stop a profit of $79.70.

Crude oil continues to run in the 77~80 rangeCrude oil continues to run in the 77~80 range, waiting for a breakthrough, continue to sell high and buy low
Crude oil technical analysis
Daily resistance 79-80, lower support 76.8
Four-hour resistance is 79-80, and support below is 77-76.8
Crude oil operation advice: Crude oil was under pressure at the 79.2 mark yesterday and ushered in a weak and volatile downward breakthrough. The Asian and European prices fluctuated sideways and came under pressure near the 79 mark, then fell back and fell rapidly, falling back to a weak rebound near 78.2. NY time was under pressure at the 79 mark and ushered in an accelerated decline. Finally, the price fell to around 77.6 and stabilized.
The overall price appears to be suppressed at the 79 mark. Short-term oil prices continue to show a daily red-green cycle rhythm. Today, the lower support focuses on 77.2-77, and the upper pressure focuses on 79.5-80. The day will continue to rely on this range to maintain a wide range of long and short shocks. The watershed between short-term long and short strength still focuses on the 80 integer mark. Before the daily level reaches 80, it will continue to maintain long and short shocks between 77 and 80.
BUY:77.0 near SL:76.70
BUY:76.8 near SL:76.40
BUY:79.6 near SL:79.30
Technical analysis only provides trading direction!

Maybe you could use this analysis and advice!Hello, guys
WTI Crude Oil turned bearish on its 1D technical outlook (RSI = 39.681, MACD = -1.020, ADX = 30.568) but remains neutral on 1W (RSI = 46.231) as it is approaching again the 1W MA200. That is a critical Support as not only it is untouched since February 5th but is the long term level that Oil has been bouncing aggressively on since March 2023. We look towards a Rectangle consolidation-accumulation as the last two times that the 1W MA200 was tested. We will buy on S1 and target the R1 level (TP = 80.60). Until we close over the 1D MA50, our strategy is to scalp this range.
Happy trading

CRUDE OIL LONG FROM SUPPORT|LONG|
✅CRUDE OIL is going down now
But a strong support level is ahead at 75.55$
Thus I am expecting a rebound
And a move up towards the target at 78.17$
LONG🚀
✅Like and subscribe to never miss a new idea!✅


Clean up on Isle 6All ideas are strictly my interpretation of price action. I am not a professional trader nor is this
professional advice.

Crude Oil (WTI) may rise to 80.90 - 81.35Pivot
79.35
Our preference
Long positions above 79.35 with targets at 80.90 & 81.35 in extension.
Alternative scenario
Below 79.35 look for further downside with 78.95 & 78.50 as targets.
Comment
The RSI advocates for further upside.
Supports and resistances
81.90
81.35
80.90
80.23 Last
79.35
78.95
78.50
Number of asterisks represents the strength of support and resistance levels.

WTI TO GO BULLISH!Price may go bullish if we can get a price offer at 78.450. Following the upcoming U.S. pce news coming up, price surged higher today & made 0.25% increase. A buy opportunity is envisaged when price drops to 78.450
Target is 79.00

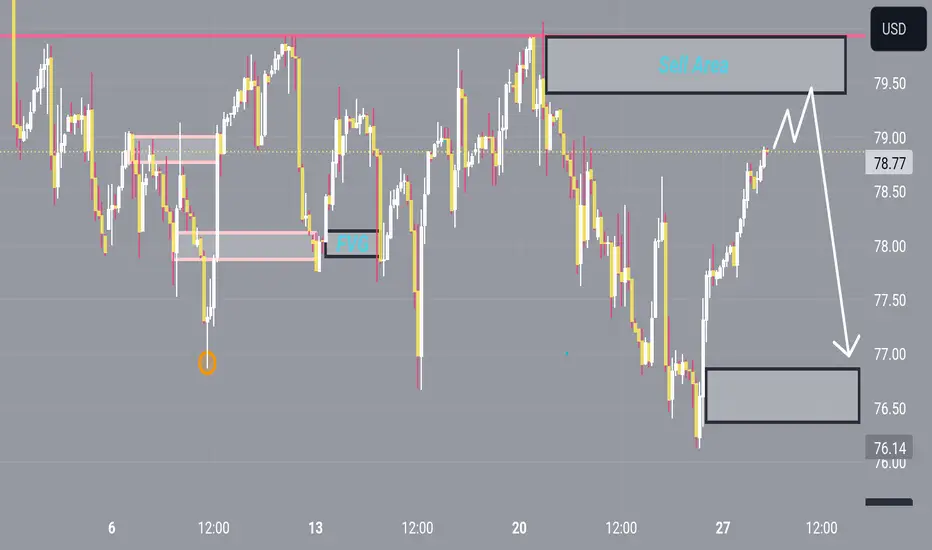
USOIL sell side Hey there on 2hTF the USOIL has looking today sell scenario can be retest from 79.00
79.50 can there again slip downside continue will looks for next support 77.50
Wti ( UsOil ) thats my idea about Wti
up trend first , then going to down trend
but if price break 95.5
its going to need an update ..

USOIL: Bullish Forecast & Outlook
Remember that we can not, and should not impose our will on the market but rather listen to its whims and make profit by following it. And thus shall be done today on the USOIL pair which is likely to be pushed up by the bulls so we will buy!
❤️ Please, support our work with like & comment! ❤️

Crude Oil: Long Position Amidst Support and SeasonalityWe are considering a long position on crude oil, given that the price has reached a significant support area. This support level is reinforced by a divergence observed on the Relative Strength Index (RSI), suggesting a potential reversal in the current trend. Additionally, seasonality data supports the likelihood of a bullish movement during this period.
The convergence of these technical indicators and historical trends strengthens our conviction for a long setup. The RSI divergence indicates that the recent downward momentum may be waning, while the support area provides a strong foundation for a potential price rebound. Furthermore, seasonality data, which highlights recurring patterns in price behavior during specific times of the year, suggests that crude oil prices are poised for an upward movement.
In light of these factors, we are looking to establish a long position on crude oil, capitalizing on the technical setup and historical data that align to suggest a favorable entry point for a bullish trade.
