USOIL again looking for upside Hey there on 1htF the USOIL has been touched our previous target 84 and now also moved some downside and again looking for buy side
USOIL trade ideas
oil patternsOil price is managed.
It trades in a range for decades until high inflation forces it to break out of that range.
Should the oil price break out of the current range. it will form a new range.

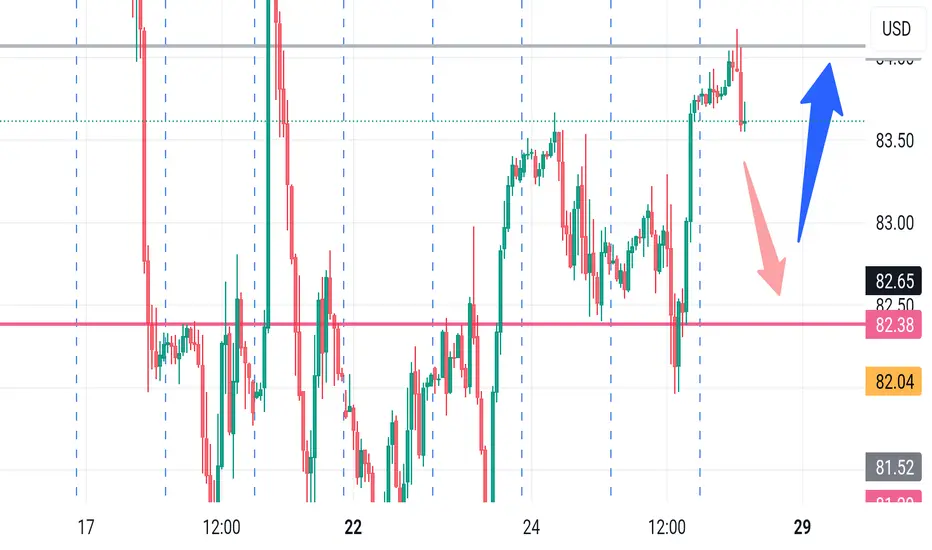
USOIL.. where is market top? What's next?#USOIL.. well guys market very well bounced back from 81 around.
Now we have 83.70 as market current resistance area.
Keep close eit because if market hold it then you can see a drop from here,
Otherwise not at all..
Good luck
Trade wisely

Crude oil trade analysis
The overall trend of crude oil hit the bottom yesterday, and the rebound did not break after testing 80.7 for the second time. It's still going strong. A positive hammer line collected on the daily chart. A close like this meant the market would rebound, and it has now. The key pressure level is 83.6. As long as the market does not break here, the market will continue to fluctuate at a low level. If it breaks through and stands firm, you can rest assured to be bearish and buy up. Friends who are stable can wait patiently after breaking through 83.6 and then buy up when approaching 82. Continue to watch for a breakthrough of 83.6 above!

USOIL BUY (Still valid)USOIL bought then consolidated created a false break out to the down side and went up(accumulation, manipulation, distribution, etc.). We still in strong bulls for USOIL FOREXCOM:USOIL FX:USOIL TVC:DXY . This is only a trade idea, use risk management. Happy trading

🔥🔥🔥100% profit signal!!!✅✅✅After a brief adjustment, crude oil is expected to resume its upward trend. It is advised to wait for opportune moments to continue taking long positions on crude oil, with upside targets focusing on the $88-90 range.
All signals I issued in April have resulted in profits, maintaining a consistent 100% accuracy rate. Weekly profits of at least 200% can be attained. Do not miss out on my accurate signals!

XTIUSD (US OIL/ WTI) : 1800+ Pips Opportunity| Setupsfx_ |Dear Traders,
Hope you are doing great, US OIL still has high chances of touching the 90.00 region and beyond. Price made correction after rejecting at 87.00, price dropped to 80.00 from where we think price is likely to continue the bullish momentum. However, it is crucial to keep next week news in mind as well.
Good Luck

USOIL BEST PLACE TO SELL FROM|SHORT
Hello,Friends!
We are targeting the 80.21 level area with our short trade on USOIL which is based on the fact that the pair is overbought on the BB band scale and is also approaching a resistance line above thus going us a good entry option.
✅LIKE AND COMMENT MY IDEAS✅


OIL TRADE LONH TERM VIEWFollowing the retracement as a result of the calmness in the middle east after the strike from both Iran and Isreali which resulted to little or no damage. Oil has completed a pullback and it has resumed it upward trend which should likely create another high

us oilLiquidity swept on the upside. Imbalance left behind. Entry on the 1 min fvg. Shorts targeting sell side liquidity.

USOIL UNIUE IDEA#USOIL
UPDATE
Hey team hope you all are enjoying our ideas and analysis. Now we are here to discuss about USOIL.USOL is ready for a good in this move we can see drop upto price level 77 to 75 soon. Keep in touch we will update further soon.

USOIL Bearish MomentumUSOIL: The structure exhibits a bearish trend on lower time frames (LTF). Price has retraced to a critical decision point, marking a pivotal juncture. With the market transitioning into a bearish environment, I anticipate further downward pressure, as delineated on the accompanying chart.

CrudeOil Buy SignalWe have bullish signal on USOil H1 chart, Risk reward 1/2. Bulls formation is clear, i think they can renew current resistance...

Potential bullish bounce of 38.2% Fibonacci pullback supportWTI oil (XTI/USD) has made a bullish bounce off the pivot. Could this commodity potentially continue to climb towards the 1st resistance?
Pivot: 83.17
1st Support: 81.86
1st Resistance: 85.42
Risk Warning:
Trading Forex and CFDs carries a high level of risk to your capital and you should only trade with money you can afford to lose. Trading Forex and CFDs may not be suitable for all investors, so please ensure that you fully understand the risks involved and seek independent advice if necessary.
Disclaimer:
The above opinions given constitute general market commentary, and do not constitute the opinion or advice of IC Markets or any form of personal or investment advice.
Any opinions, news, research, analyses, prices, other information, or links to third-party sites contained on this website are provided on an "as-is" basis, are intended only to be informative, is not an advice nor a recommendation, nor research, or a record of our trading prices, or an offer of, or solicitation for a transaction in any financial instrument and thus should not be treated as such. The information provided does not involve any specific investment objectives, financial situation and needs of any specific person who may receive it. Please be aware, that past performance is not a reliable indicator of future performance and/or results. Past Performance or Forward-looking scenarios based upon the reasonable beliefs of the third-party provider are not a guarantee of future performance. Actual results may differ materially from those anticipated in forward-looking or past performance statements. IC Markets makes no representation or warranty and assumes no liability as to the accuracy or completeness of the information provided, nor any loss arising from any investment based on a recommendation, forecast or any information supplied by any third-party.

USOIL BULLISH CANDLE Hey There on 1htF the USOIL has been continue rise upside from on Monday and will recovery upside when slipped highly down on last Friday and now we can see that will Go upside again push upside so here we can see again buy side from 82$ to 84$

Oil slips back into key range Oil futures are struggling to regain their footing this week as traders perceive that risks of the Middle East tensions impacting supply have eased. The lack of damage or casualties following the retaliatory attacks Israel launched on Iran on Friday has led Iranian officials to deny any further retaliation from Tehran, a successful effort from diplomats who have been trying to avoid an all-out war since the attacks began earlier this month.
US crude (WTI) futures have been dropping for the past three weeks as traders price out supply shocks, but Friday’s attack caused traders to re-price some of these risks, pushing WTI back above $85 per barrel. The lack of further developments has left oil traders struggling to consolidate further bullish momentum as risk premiums tend to not last if supply is not actually disrupted. Adding further pressure on oil prices are reports that Russia has downgraded its export price forecasts.
Technically, WTI is facing increased pressure from a key support/resistance range between $80.65 and $82.54 per barrel. This area has proved to attract increased two-way trade, often seeing price venture along this range for a few days before being able to break out on either side. The brief rally from the past two days has stalled just below $83.50 as sellers continue to dominate the short-term momentum. The RSI has started to drop below the mid-line (50) suggesting the bearish pressure continues to consolidate.
That said, buyers attempted to reverse the daily losses on Wednesday afternoon as the latest US inventory data showed the first drawdown in a month. Inventories dropped by 6.37 million barrels in the week to April 19th after four weeks of increases totalling 15 million barrels. So far the impact seems to be limited with WTI still down 0.7% on the day at the London close.

Oil ScenarioThis is a simple project that is looking for two possible scenarios in the unfolding of events. The most important phenomenon that will be relevant in analyzing and possibly trading this instrument using the elements in the snapshot, is the price action at the shapes. If coincidences of price action near the shapes or icons occur, we can treat them as potential pivot points, reversal signals.
This is very straight forward and easy to trade when a potential Japanese Candlestick reversal pattern forms. You trade in the direction of the signal candlestick, using stop loss below its low, or above its high, and my personal preferred method of trailing stop loss, is to use the highs and lows of newer longer candlesticks in the wave that we are riding, that provide new lower lows or higher highs. /This method is highlighted with purple in the past price action as an example, but other methods can be used, as this is likely to get us out of the position, earlier than the actual end of the wave we are riding. This is a discretionary approach and anyone should use their own knowledge and wisdom of the markets to trade accordingly with their preferred and suitable strategy for their trading account.
One other option would be to stay in the position until a tradable reversal signal occurs, reversing the position, but this could encounter duds, where signals are not successful, a case in which you are left out of the market, leaving money on the table.
Leaving the position managing aspect aside (which could actually be more relevant than entry points), this project is considering two main scenarios: a short at the green rectangle with relevant price action that might signal a reversal, or a long position taken somewhere at the red rectangle after a bullish engulfing or other candlestick pattern. The rectangles are potential support and resistance zones. The target above 96 might be too bold, but it is important to acknowledge that price action, many times, is much more important than our perception of what should or could happen. What is happening, is much more important than our imagination. /That is why I prefer the Japanese Candlesticks type of analysis, because they tell their own story of reality: highs, lows, momentum, sentiment, etc.

CRUDE OIL (WTI): Bullish Move From Key Support 🛢️
On a today's live stream, we spotted a very bullish pattern on WTI Crude Oil:
inverted head and shoulders formation after a test of a key horizontal support.
We see a confirmed neckline breakout of the pattern.
It increases the probabilities that the market will go up now.
Target - 84.5
❤️Please, support my work with like, thank you!❤️

CRUDEOIL / USOIL / WTI Bullish Analysis Robbery PlanDear Oil Robbers,
This is our master plan to Heist Bullish side of OIL Barrels. My dear Robbers U can enter at the any point above my entered area MA Pullback, Our target is Red Zone Snake Trap Zone. My dear Robbers please book some partial money it will manage our risk. Be safe and be careful and Be rich.
Loot and escape near the target 🎯
support our robbery plan we can make money take money 💰💵 Join your hands with US. Loot Everything in this market everyday.

Does the rise of oil continue?📊 According to the upward movement momentum of the price, if the range of 83.20 units is broken and the price stabilizes above it, the price may increase to the range of 84.00 units🎯, and in case of strength, the range of 85.00 units🎯🎯.
📊 Otherwise, the price may drop to the range of 82.00 units.

USOIL-bias long Bullish indications:
Major support respected at 80.76
Double bottom formation in 1 hr time frame.
Bullish divergence in 4 hr time frame.
Inverted hammer in 4 hr time frame.
Fib level 0.618 respected.
Bearish indications:
LLLH
Trade plan bias long @ 81.48
SL:80.58
TP1:82.42
TP2:82.91
