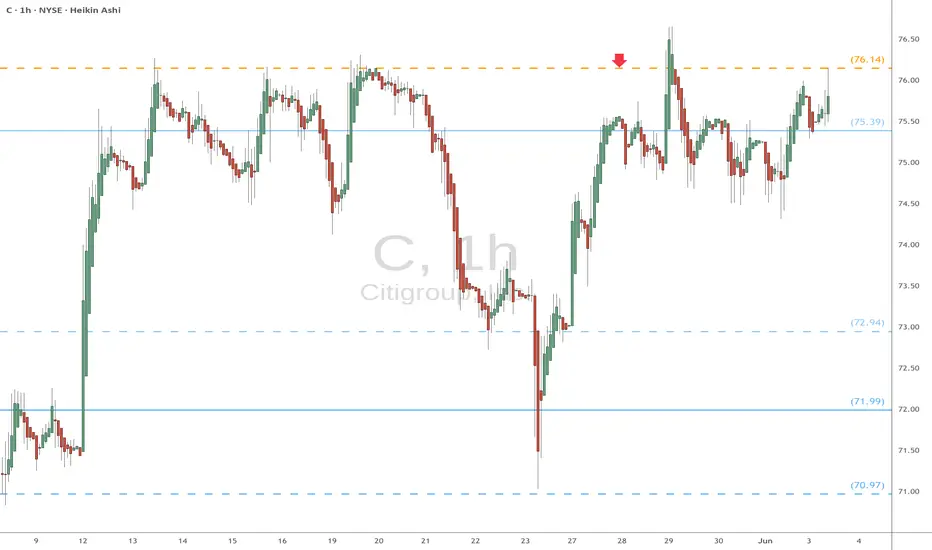
C - Bullish continuation likely=======
Volume
=======
- neutral
==========
Price Action
==========
- Latest dip sustained on uptrend line and support
=================
Technical Indicators
=================
- Ichimoku
>>> price above cloud
>>> Red kumo sustained
>>> Tenken - Above clouds
>>> Chiku - Above clouds
>>> Kijun
Key facts today
Next report date
—
Report period
—
EPS estimate
—
Revenue estimate
—
6.16 EUR
12.09 B EUR
165.16 B EUR
1.84 B
About Citigroup, Inc.
Sector
Industry
CEO
Jane Nind Fraser
Website
Headquarters
New York
Founded
1812
ISIN
US1729674242
FIGI
BBG00KTDTSS2
Citigroup, Inc. is a holding company, which engages in the provision of financial products and services. It operates through the following segments: Services, Markets, Banking, Wealth, U.S. Personal Banking (USPB), and All Other. The Services segment includes Treasury and Trade Solutions (TTS) which provides an integrated suite of tailored cash management, trade, and working capital solutions to multinational corporations, financial institutions and public sector organizations, and Securities Services, which offers cross-border support for clients, providing on-the-ground local market expertise, post-trade technologies, customized data solutions, and a wide range of securities services solutions that can be tailored to meet client needs. The Markets segment provides corporate, institutional, and public sector clients around the world with a full range of sales and trading services across equities, foreign exchange, rates, spread products, and commodities. The Banking segment offers Investment Banking and Corporate Lending services. The Wealth segment includes Private Bank, Wealth at Work, and Citigold and provides financial services to a range of client segments through banking, lending, mortgages, investment, custody, and trust product offerings. The USPB segment includes Branded Cards and Retail Services, which have proprietary card portfolios and co-branded card portfolios within Branded Cards, and co-brand and private label relationships within Retail Services. The All Other segment consists of activities not assigned to the reportable operating segments, including certain unallocated costs of global functions, other corporate expenses, and net treasury results. The company was founded in 1812 and is headquartered in New York, NY.
Related stocks


Breakout With Follow-Through – Target $106The price has broken out of an ascending triangle pattern formed between $95 and $98, showing strong follow-through. This breakout signals continuation of the prevailing uptrend.
Technical Setup: Clear series of higher lows, resistance around $97.50–$98 finally broken with a strong bullish candle.
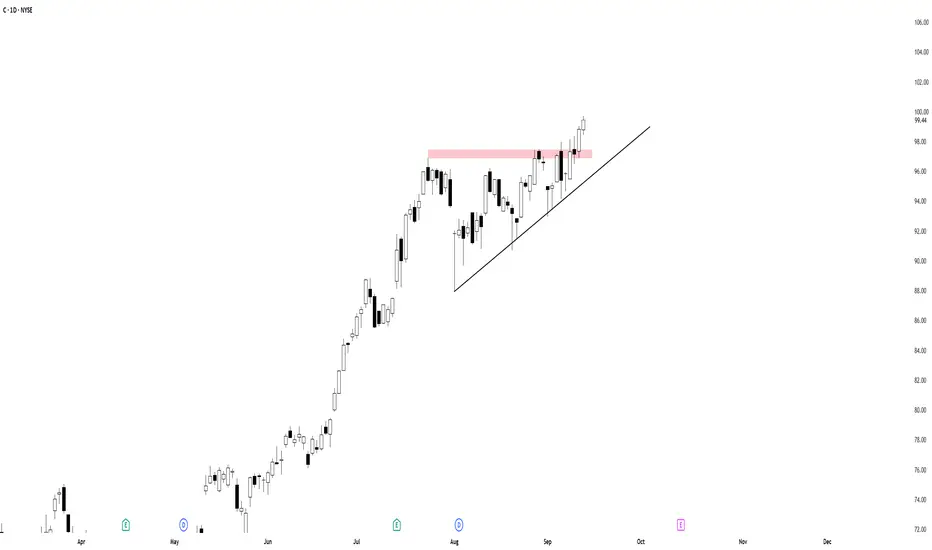
C BUY SET UPC has broken out of a triangle pattern and the price is surging. The rally is supported by the company’s focus on enhancing digital banking services, expanding its global footprint, and favorable analyst ratings
TARGET 150
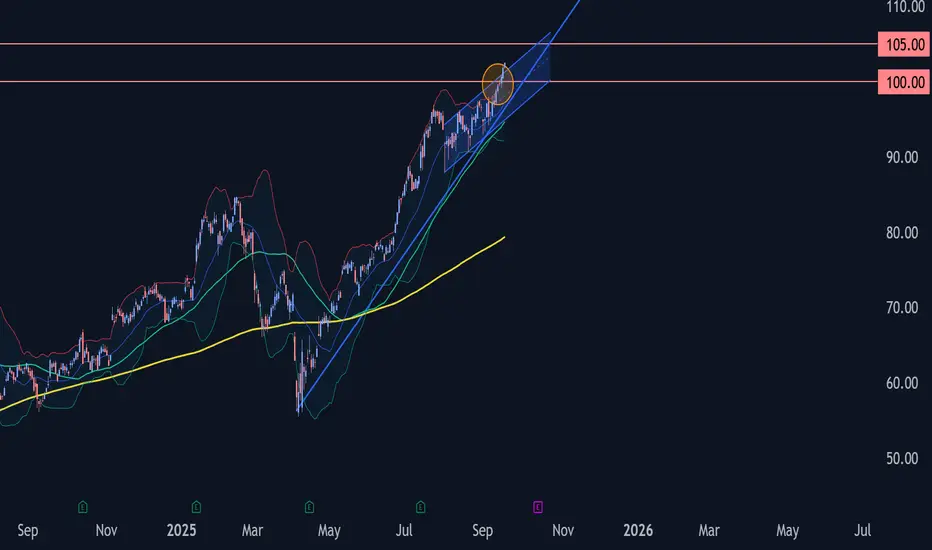
Citibank Wave Analysis – 18 September 2025- Citibank broke the daily up channel
- Likely to rise to resistance level 105.00
Citibank recently broke the resistance trendline of the daily up channel from the end of July coinciding with the round resistance level 100.00.
The breakout of these resistance levels continues the active impulse wa
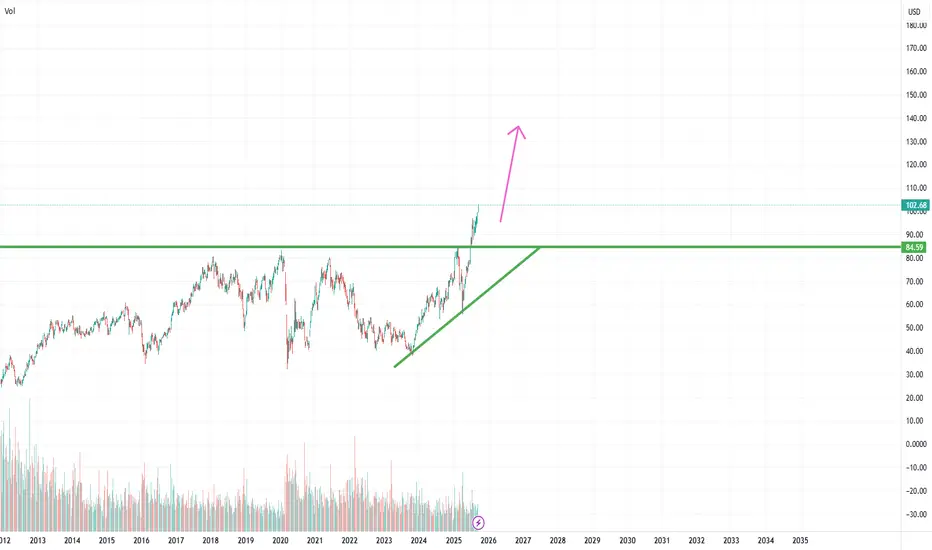
City Group LongCity Group is now net long on the regression break.
I am following the trend and put an limited risk EA on this share.

Citibank Wave Analysis – 20 August 2025- Citibank reversed from support zone
- Likely to rise to resistance level 95.60
Citibank recently reversed from the support area between the round support level 90.00 (which has been reversing the price from July) and the lower daily Bollinger Band.
This support zone was further strengthened by t

Watching for Pullback Below $84 in Citigroup (C)Over the past month, Citigroup shares have appreciated 8.58%, outperforming both the Finance sector's 1.91% gain and the S&P 500's 3.92% increase. This relative outperformance may signal strength, but short-term positioning and market structure suggest a potential shift.
Expecting a Sharp Move Belo

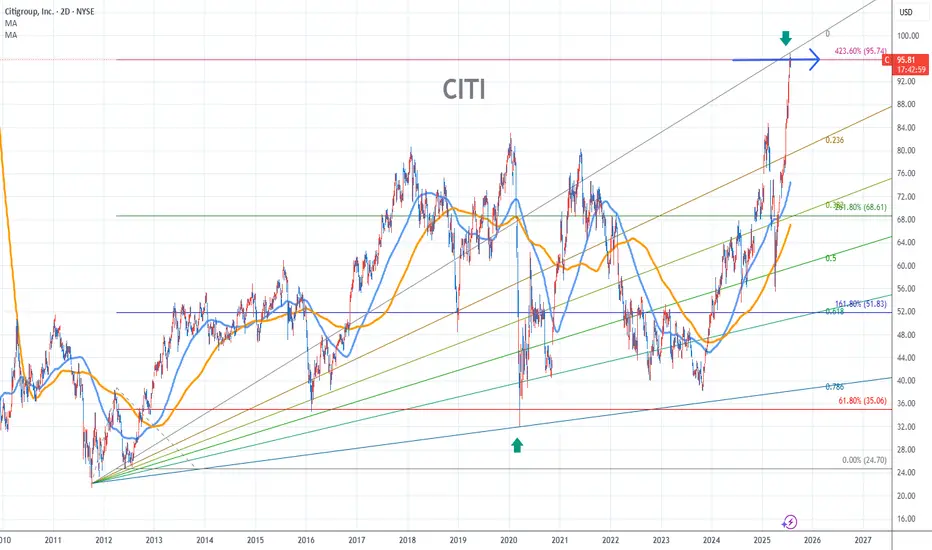
Citigroup Stock Chart Fibonacci Analysis 073025Hit the 96/423.60% resistance level.
Chart time frame:D
A) 15 min(1W-3M)
B) 1 hr(3M-6M)
C) 4 hr(6M-1year)
D) 1 day(1-3years)
Stock progress:E
A) Keep rising over 61.80% resistance
B) 61.80% resistance
C) 61.80% support
D) Hit the bottom
E) Hit the top
Stocks rise as they rise from support and f
C (Citi) eyes on $76.14: Golden Covid ready to launch BreakOutC with all banks has recovered to pre-tariff levels.
It has pierced a proven Golden Covid fib at $76.14
Look for a Retest (preferably with a Ping) for entry.
See all ideas
Summarizing what the indicators are suggesting.
Neutral
SellBuy
Strong sellStrong buy
Strong sellSellNeutralBuyStrong buy
Neutral
SellBuy
Strong sellStrong buy
Strong sellSellNeutralBuyStrong buy
Neutral
SellBuy
Strong sellStrong buy
Strong sellSellNeutralBuyStrong buy
An aggregate view of professional's ratings.
Neutral
SellBuy
Strong sellStrong buy
Strong sellSellNeutralBuyStrong buy
Neutral
SellBuy
Strong sellStrong buy
Strong sellSellNeutralBuyStrong buy
Neutral
SellBuy
Strong sellStrong buy
Strong sellSellNeutralBuyStrong buy
Displays a symbol's price movements over previous years to identify recurring trends.
C
C4368290
Citigroup Global Markets Holdings Inc. 0.0% 29-MAY-2026Yield to maturity
377.33%
Maturity date
May 29, 2026
C
XS1574962046
Citigroup Global Markets Funding Luxembourg SCA 0.0% 12-MAY-2027Yield to maturity
94.91%
Maturity date
May 12, 2027
C
C5380865
Citigroup Global Markets Holdings Inc. 0.0% 04-APR-2029Yield to maturity
82.98%
Maturity date
Apr 4, 2029
C
C5334020
Citigroup Global Markets Holdings Inc. 0.0% 12-JAN-2032Yield to maturity
38.62%
Maturity date
Jan 12, 2032
C
XS1574931751
Citigroup Global Markets Holdings Inc. 0.0% 26-OCT-2027Yield to maturity
32.17%
Maturity date
Oct 26, 2027
C
XS3045697862
Citigroup Global Markets Holdings Inc. 17.0% 06-MAY-2026Yield to maturity
16.74%
Maturity date
May 6, 2026
C
XS2907338128
Citigroup Global Markets Funding Luxembourg SCA 0.0% 02-NOV-2026Yield to maturity
14.98%
Maturity date
Nov 2, 2026
C
XS2936071179
Citigroup Global Markets Holdings Inc. 12.5% 27-NOV-2034Yield to maturity
12.49%
Maturity date
Nov 27, 2034
C
C6027093
Citigroup Global Markets Holdings Inc. 0.0% 13-APR-2026Yield to maturity
12.44%
Maturity date
Apr 13, 2026
C
XS2106673424
Citigroup Global Markets Holdings Inc. 0.0% 04-MAY-2040Yield to maturity
11.70%
Maturity date
May 4, 2040
See all CITI bonds
Curated watchlists where CITI is featured.


Frequently Asked Questions
The current price of CITI is 88.32 EUR — it has increased by 0.11% in the past 24 hours. Watch Citigroup Inc. stock price performance more closely on the chart.
Depending on the exchange, the stock ticker may vary. For instance, on VIE exchange Citigroup Inc. stocks are traded under the ticker CITI.
CITI stock has risen by 2.96% compared to the previous week, the month change is a 5.44% rise, over the last year Citigroup Inc. has showed a 42.43% increase.
We've gathered analysts' opinions on Citigroup Inc. future price: according to them, CITI price has a max estimate of 116.15 EUR and a min estimate of 86.68 EUR. Watch CITI chart and read a more detailed Citigroup Inc. stock forecast: see what analysts think of Citigroup Inc. and suggest that you do with its stocks.
CITI reached its all-time high on Sep 29, 2025 with the price of 88.84 EUR, and its all-time low was 31.91 EUR and was reached on Mar 19, 2020. View more price dynamics on CITI chart.
See other stocks reaching their highest and lowest prices.
See other stocks reaching their highest and lowest prices.
CITI stock is 0.11% volatile and has beta coefficient of 1.64. Track Citigroup Inc. stock price on the chart and check out the list of the most volatile stocks — is Citigroup Inc. there?
Today Citigroup Inc. has the market capitalization of 161.81 B, it has decreased by −1.20% over the last week.
Yes, you can track Citigroup Inc. financials in yearly and quarterly reports right on TradingView.
Citigroup Inc. is going to release the next earnings report on Jan 14, 2026. Keep track of upcoming events with our Earnings Calendar.
CITI earnings for the last quarter are 1.59 EUR per share, whereas the estimation was 1.47 EUR resulting in a 7.55% surprise. The estimated earnings for the next quarter are 1.58 EUR per share. See more details about Citigroup Inc. earnings.
Citigroup Inc. revenue for the last quarter amounts to 18.82 B EUR, despite the estimated figure of 17.97 B EUR. In the next quarter, revenue is expected to reach 18.25 B EUR.
CITI net income for the last quarter is 3.16 B EUR, while the quarter before that showed 3.37 B EUR of net income which accounts for −6.14% change. Track more Citigroup Inc. financial stats to get the full picture.
Yes, CITI dividends are paid quarterly. The last dividend per share was 0.52 EUR. As of today, Dividend Yield (TTM)% is 2.26%. Tracking Citigroup Inc. dividends might help you take more informed decisions.
Citigroup Inc. dividend yield was 3.10% in 2024, and payout ratio reached 36.68%. The year before the numbers were 4.04% and 51.45% correspondingly. See high-dividend stocks and find more opportunities for your portfolio.
As of Nov 6, 2025, the company has 229 K employees. See our rating of the largest employees — is Citigroup Inc. on this list?
Like other stocks, CITI shares are traded on stock exchanges, e.g. Nasdaq, Nyse, Euronext, and the easiest way to buy them is through an online stock broker. To do this, you need to open an account and follow a broker's procedures, then start trading. You can trade Citigroup Inc. stock right from TradingView charts — choose your broker and connect to your account.
Investing in stocks requires a comprehensive research: you should carefully study all the available data, e.g. company's financials, related news, and its technical analysis. So Citigroup Inc. technincal analysis shows the buy rating today, and its 1 week rating is strong buy. Since market conditions are prone to changes, it's worth looking a bit further into the future — according to the 1 month rating Citigroup Inc. stock shows the buy signal. See more of Citigroup Inc. technicals for a more comprehensive analysis.
If you're still not sure, try looking for inspiration in our curated watchlists.
If you're still not sure, try looking for inspiration in our curated watchlists.