WLD Coin Strong buy WLD coin is ready to go Straight up if $12 is broken We could lunch to $18, this is a Solid Trade %100 will not fail Be careful of your leverage and enjoy the ride, %100 win it will not fail. AI is the future
WLDUSDT trade ideas
$WLD make or breakNice wedge on the MIL:WLD chart.
One of the coins to keep an eye on for the next few days.

Channel Breakout + Retest = Best entry !!!WLD is trading in a large parallel ascending channel on the daily timeframe. The price broke out above the upper trendline of the channel and retested it from the outside. This confirms the bullish breakout and suggests that the price is likely to continue to rise in the near future.
The parallel ascending channel:
The parallel ascending channel is a bullish pattern that is characterized by two parallel trendlines, one connecting higher lows and the other connecting higher highs. The price typically breaks out above the upper trendline, signaling a continuation of the uptrend.
The breakout:
The price broke out above the upper trendline of the channel on March 14, 2023. This breakout was confirmed by the increase in volume.
The retest:
The price has since retested the broken trendline and held. This retest confirms the bullish breakout and suggests that the price is likely to continue to rise in the near future.
The support level:
The support level is a price level at which the price is likely to stop falling and start rising. This is because there are a large number of buy orders at this level.
The bullish target:
The first bullish target is the $7.50 level, which is the top of the previous ascending channel. Further upside could see the price reach $8.00 or even higher.
Conclusion:
The WLD chart shows a bullish pattern. The price has broken out of a parallel ascending channel and retested the broken trendline. This suggests that the price is likely to continue to rise in the near future. Investors should always do their own research before investing in any cryptocurrency.

WLD / USDT = HnS, no volume, btc.d pumping, btc dumping = shortWe've seen all alts are dumping, then i just saw this one on a 4hr TF with head and shoulder pattern, no volume with big divergence. #TAYOR #DYOR waiting for good news for pump.
Big time frame

WLDUSDTmy entry on this trade idea is taken from a point of interest ABOVE an inducement.. I extended my stoploss area to cover for the whole swing as price can target the liquidity there before going as i anticipate.. just a trade idea, not financial advise

Unveiling a New WLD: Charting the Crypto FrontierIn the vibrant and ever-changing cryptocurrency sector, the WLD coin has emerged as a noteworthy entity, particularly due to its meteoric rise from a trading stance of $0.9850 to an impressive peak at $11.
This analysis delves into the intricacies of WLD's market behavior, with a keen focus on a specific 3-hour trading window. It methodically dissects the coin's historical pricing patterns, leverages a spectrum of technical analysis tools, and contemplates the broader market forces that have been instrumental in sculpting WLD's path.
Background Overview:
WLD coin's journey began with its release on July 24, 2024, marked by the innovative introduction of 11 ORB locations across the United States, with an ambitious roadmap extending to 35 more ORBs globally. The coin's debut saw an initial 8.5% price increase, subsequently experiencing a 35% decline from its peak, setting the stage for a complex market trajectory
Analytical Perspective:
This analysis adopts a personal viewpoint, acknowledging the subjective nature of technical analysis and inviting diverse perspectives to enrich the discussion. Despite a bullish outlook on WLD, a potential overvaluation and expected price correction are considered, with analysis extending beyond the 3-hour timeframe to encompass broader market trends.
Technical Analysis:
The technical journey of WLD began post its initial rally and subsequent decline, finding support at the $1.8599 level, which held for approximately 16 days.
A breach of this support level led to a further decline, establishing $0.9850 as a significant support area, indicative of strong buying levels.
A minor Area of Interest (AOI) was identified at $1.2335, with frequent interactions over a month, highlighting its importance in WLD's price dynamics.
The downtrend witnessed on a shorter 1-hour timeframe and the oscillator's indication of a potential reversal at this stage underscored the nuanced interplay of market forces on the 3H timeframe.
The emergence of a new uptrend was marked by a significant pattern on the oscillator, with WLD establishing new AOIs at $2.7365 and $4.3, leading to a remarkable 333% price rally.
However, this rally faced resistance, initiating a corrective phase that saw a 50% price reduction over 36 days, highlighting the cyclical nature of market trends.
A pivotal moment in WLD's trading history was observed around the grey dotted Area of Interest (AOI) line at $2.1850. On February 9, 2024, as the market opened (8:00 AM AUS GMT+8), buyers initiated a strong entry, effectively challenging and breaking through the prevailing downtrend. This bullish momentum was clearly confirmed on the 3-hourly chart, marking a significant turning point in WLD's market dynamics
In the subsequent 30-day trading period, an extraordinary price surge ensued, with WLD's value escalating by over 384%. This period was characterized by the establishment of new AOIs at critical levels: $5.1205, marking the investor's take-profit point, followed by successive peaks at $7.2215, $9.4795, $9.500, and ultimately reaching an all-time high at $11.8954.
This phase not only underscored the robust bullish sentiment in the market but also highlighted the strategic significance of these newly established AOIs in WLD's trading landscape.
Current Market Dynamics:
Diving deeper into the intricate landscape of WLD's price action, we now pivot our focus towards the horizon, contemplating the path that lies ahead based on the meticulous analysis of the 3-hour chart.
Navigating Future Waters: A Detailed Forecast
The symphony of price levels previously highlighted has not only shaped the historical narrative of WLD but now converges to orchestrate a symmetrical triangle pattern on the 3-hour timeframe. This geometric alignment, as observed below,
suggests a delicate balance between bullish hopes and bearish realities, typically indicative of a bullish continuation pattern.
However, the plot thickens as the oscillator reveals signs of capital withdrawal alongside a bearish cross, marked distinctly by a highlighted white dot
This is hinting at potential volatility with a predisposition to break downward before possibly catapulting upwards with renewed vigor, especially around the $6.81 - $6.3455 AOI zones or upon retesting the $8.5 AOI.
Anticipating strategic entry points, the levels at $7.2215 and $6.8101 emerge as beacons for potential investment opportunities, potentially setting the stage for WLD to eclipse its previous zeniths if these levels hold firm.
Leveraging ERAI's Insights:
Employing ERAI, an AI-driven beacon in the tumultuous seas of cryptocurrency trading, we delve into a simulation rich with historical candle data. This predictive odyssey suggests pivotal levels at $15.72, with notable clusters around $11.985, $8.57, $7.78, and $6.81, painting a cautious tapestry of potential downturns, with the minor level at $5.1205 offering a glimmer of optimism to hold price up.
ERAI's bearish posture, amplified by a SELL signal at a power rating of 2.4 on the 3-hour timeframe, further accentuates the narrative of caution.
The Duel of Indicators:
Amidst this analytical maelstrom, the 200 daily EMA and the HODL line stand as sentinels on the chart, their red and white hues demarcating the battleground of buyers and sellers. This dynamic duo suggests a close-knit struggle for dominance, offering a strategic axiom: the positioning of the HODL line relative to the 200 DEMA could signal the opportune moments to buy or sell.
Oscillatory Perspectives:
Lastly, the oscillator, with its HYPER WAVE and MONEY FLOW, warns of negative cash influxes and descending price actions, suggesting a march towards the oversold domain, with eyes keenly set on the $7.2215 and $6.81 levels for potential rebounds.
In Summary:
This foray into WLD's technical realm, grounded in empirical evidence and enriched by predictive analytics, paints a tapestry of cautious optimism, underscored by strategic vigilance.
Will be closely monitoring WLD for the next coming weeks.
~Axie

WLD/USDT Break the bullish flag, Bullish continuation for WLD!💎 WLD has recently encountered notable market dynamics. After breaking out of the bullish flag pattern, WLD is currently in a retesting phase.
💎 There's potential for the price to resume its upward movement, targeting the resistance area around $9.45. However, for this continuation to occur, WLD must successfully breach the resistance level.
💎 In the event of another failure to break the resistance, there's a possibility of price rejection, leading to a retracement towards the support trendline. Should the support trendline fail to hold, the next significant support area lies around $7.4.
💎 The demand area holds critical importance, as a failure to bounce from this level could signal further downside potential. A breakdown below the support level would confirm a return to bearish sentiment for WLD. Monitoring price action around these key levels will be essential for assessing WLD's future trajectory.

WLDUSDTmy entry on this trade idea is taken from a point of interest BELOW an inducement.. I extended my stoploss area to cover for the whole swing as price can target the liquidity there before going as i anticipate.. just a trade idea, not financial advise

WLD potential 60% pump 🐺Hello my friend 🐺 .
before I start ; I like to mention that my 2 previous TA about BINANCE:FILUSDT AND BINANCE:BOMEUSDT , are in the considerable profit and they are still running and all of this happen in just a 3 days ! so don't forgot to follow me to don't miss any of this potential movement in the market .
So let's began , as you can see in the chart we have a very obvious bull flag pattern which now price is trading above it and we could consider it as a logic break out from the pattern so in my opinion and based my personal TA I consider 3 target for the WLD : first is around 10.8
second one is somewhere around the ATH price and the last one is 60% higher than the current price .
Have nice trade my friends 🐺 .

WLD Growth Explosion: Buy Your Ticket to Success!Worldcoin (WLD) in a Nutshell:
Goal: Create a massive, privacy-focused digital identity and financial network accessible to everyone.
World ID: Their system revolves around a privacy-preserving digital ID obtained through the World App and verified by a device called the Orb.
WLD Token: Serves as a utility token with some governance rights, allowing users to influence the network's future.
Recent News (as of March 26, 2024):
WLD is currently priced around $9.27 USD, experiencing a rise of roughly 7.85% in the last 24 hours.
Disclaimer:
Investing in cryptocurrency involves a significant amount of risk. Prices can fluctuate considerably, and there's always the possibility of losing your entire investment. This information is for educational purposes only and should not be considered financial advice.

Worldcoin (WLDUSDT) at $11.00 Resistance BreakoutWorldcoin (WLDUSDT) is currently facing resistance at $10.50. A breakout above this level could see the price surge to new all-time highs of $18 to $22 or even higher.
On the downside, immediate support lies at $8.00, with a key support level at $5.30. Traders should closely monitor the price action around these levels to determine the coin's next move.

#WLD $WLD #WLDUSDTWLD about to get wild here with breaking out the bullish flag! will expect to see minimum11$!

Wld/Usdt Idea WLD/USDT Chart Analysis:
The WLD/USDT price is currently showing signs of a potential breakout on the 8-hour time frame. If this breakout successfully occurs, it may lead to a significant bullish rally in the market. I anticipate a bullish move of approximately 80-140% in the upcoming days.
Please note that this analysis is not financial advice and should be used for informational purposes only. Trading or investing in the financial markets carries risks, and it is important to conduct thorough research and consider all factors before making any decisions.

WLD/USDT Breakout Alert | 👀🚀WLD Ready to Rally? 💎Heads up, Paradisers! #WLDUSDT is on the verge of a bullish pivot, anchored at the critical support level of $7.14.
💎If MIL:WLD can maintain its stance at this threshold, there's a strong chance for a bullish surge, underscored by the price's historical adherence to this support on three occasions, underscoring its reliability.
💎However, if the upward journey of #Worldcoin begins to falter and dips below $7.14, we'll then set our sights on a lower demand zone at $5.56. With substantial liquidity awaiting at this level, we anticipate a necessary drop to this more probable level for a rebound.
💎Vigilance remains crucial: a breach beyond this subsequent support could suggest a deeper bearish trend as market sentiments lean toward a sell-off. Stay on high alert, traders, as we navigate the shifting tides of the #WLD market.

WLD: Manipulation SetupWLD (Wild) is a decentralized exchange (DEX) that allows users to trade cryptocurrencies without the need for a centralized intermediary.
WLD has been trading in a bullish pattern on the 1-hour time frame, which suggests that it is currently in the manipulation phase of an accumulation, manipulation, and distribution (AMD) cycle.
The AMD cycle:
The AMD cycle is a popular technical analysis model that describes the three phases of a market cycle:
Accumulation: During this phase, large buyers accumulate tokens at low prices, often creating a bullish chart pattern.
Manipulation: In this phase, the price is manipulated to create the illusion of a strong uptrend, attracting retail buyers.
Distribution: In this phase, the large buyers sell their tokens at high prices, causing the price to dump.
WLD is currently in the manipulation phase:
Volume increase: The trading volume has been increasing over the past few days, which is a sign of manipulation.
Social media hype: There has been a lot of hype surrounding WLD on social media, which is also a sign of manipulation.
Price movement: The price has been moving up in a parabolic fashion, which is another sign of manipulation.
Why this is a good time to buy:
Early entry: The market is still in the manipulation phase, which means that there is still time to get in before the price dumps.
Strong support: The price is currently trading above a strong support level, which could provide a good entry point.
Potential for a big move: The AMD cycle suggests that the price could move significantly higher in the distribution phase.
Conclusion:
WLD is currently in the manipulation phase of an AMD cycle. This could be a good time to buy, as the price has the potential to move significantly higher in the distribution phase. However, investors should always do their own research and exercise caution before investing in any cryptocurrency.

#WLD/USDT Long
#WLD
We have been in a descending triangle since the beginning of the month on a 4-H frame
After the previous rise, it is expected to continue rising
Supported by stability above moving average 100
We have upward momentum and support from a good area
Current price 3.58.
The first goal is 3.818.
The second goal is 4.039
Third goal 4.284

WLD: trade by trend📊Analysis by AhmadArz:
🔍Entry: 9.47
🛑Stop Loss: 9.18
🎯Take Profit: 9.79-10.23-10.76
🔗"Uncover new opportunities in the world of cryptocurrencies with AhmadArz.
💡Join us on TradingView and expand your investment knowledge with our five years of experience in financial markets."
🚀Please boost and💬 comment to share your thoughts with us!

WLDUSDT AnalysisCurrently, I'm maintaining a neutral position on the WLDSUDT currency pair, preferring to wait for a price decline before entering the market. My entry threshold is around 7.20, which corresponds to a significant order block level.
Technical Analysis:
Key Support: 7.20
First Profit Target (TP1): 10.25
Second Profit Target (TP2): 11.77
Trading Strategy:
Entry: I plan to initiate a long position when the price reaches or approaches the 7.20 level. This level represents a potential turning point where an upward reversal could occur.
Stop-loss: I will place my stop-loss below the order block level to limit losses in case of an unexpected market reversal.
Profit Targets: My first profit target (TP1) is set at 10.25, while my second profit target (TP2) is at 11.77. These levels are determined by thorough technical analysis and represent points where I expect the uptrend to intensify.
Conclusion:
In summary, my strategy involves waiting for a price decline to the 7.20 level to initiate a long position on the WLDSUDT currency pair. My profit targets are set at 10.25 and 11.77, with a cautious stop-loss to manage risks. However, it's essential to closely monitor market developments and adjust the strategy based on changes in trend and new information.
Best of luck with your trades!

Wld Short Term Plan Wld/Usdt
Breaout of triangle pattern is confirmed, 15-30% bullish move is expected
Let's see
This is not financial advice


Keep an eye on $WLD/USDTDid you find this crypto market analysis helpful? Stay updated about the latest crypto market update.
Please continue to follow my analysis and feel free to ask any queries, you may have. I am here to assist you.
TradingView: @FarmanBangashh

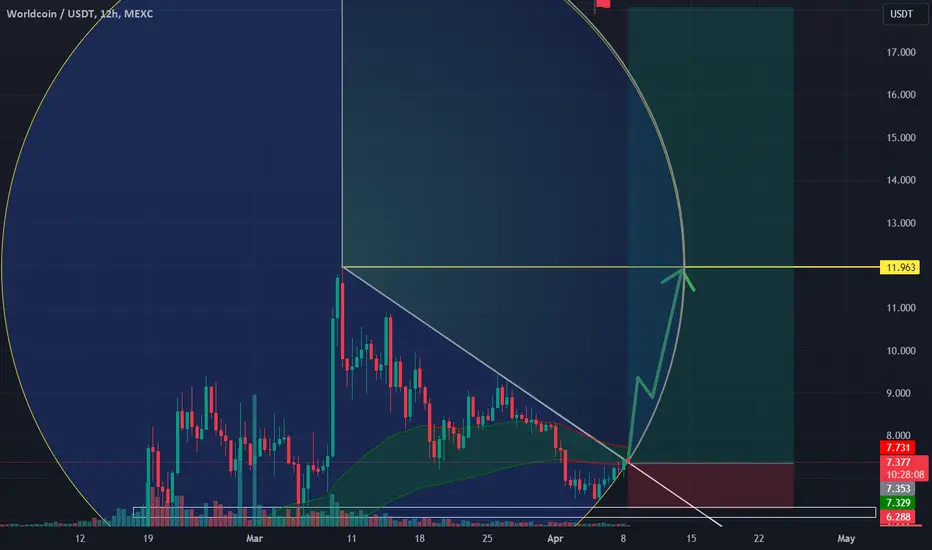
WLDUSDT - Strong Trend Line ContinuationPrice I expect to continue upwards above the channel that has been broken
This continuation is allowed to occur along this strong green trend line
Bullish AI coin

Can WLD Break Resistance as Technicals Send Mixed Signals?A closer inspection of moving averages reveals a nuanced story. The 9 Exponential Moving Average (EMA) trajectory, progressing from $9.763 to $9.865, indicates a gentle upward momentum, aligning closely with recent price actions. This near-term bullish signal is further complemented by the 20 EMA, which has steadily risen from $9.490 to $9.641, underscoring a broader consensus of bullish sentiment in the market.
However, the Moving Average Convergence Divergence (MACD) presents a contrasting narrative. Despite the MACD line moving in the vicinity of the signal line, it has remained below it in recent sessions, signaling a bearish divergence with a negative histogram. This suggests that while the momentum has been upward, caution is warranted as potential reversal signs emerge.
The Relative Strength Index (RSI), oscillating between 55.17 and 58.85, stays in the neutral territory, hinting at neither overbought nor oversold conditions. This gives room for the asset to either continue its current trend or reverse, depending on market dynamics and external factors influencing trader sentiment.
The Worldcoin price currently faces a critical resistance level at $10.094, with further barriers at $11.692 and a more immediate support at $9.294. A decisive breakout above this resistance could signal a stronger bullish momentum, aiming for higher targets. Conversely, failing to breach this level might see the pair seeking support at $8.04 and, in a more bearish scenario, at $7.798.
Given the mixed signals from technical indicators, traders might consider long positions on a successful breakout above $10.094, with stop-loss orders placed just below the immediate support level to mitigate potential losses. For those eyeing short opportunities, a rejection at the current resistance level or a breakdown below support could serve as an entry point, with targets set near the subsequent support levels.
