Inverse head and shouldersThe price has completed the formation of an inverse head and shoulders pattern, closing Friday above the neckline ($212), marked in blue.
The breakout occurred on very low volume, so caution is advised due to the risk of a potential reversal.
The stock has already reached a P/E ratio of 135, so I’
Next report date
—
Report period
—
EPS estimate
—
Revenue estimate
—
1.50 EUR
993.25 M EUR
8.08 B EUR
670.78 M
About Palo Alto Networks, Inc.
Sector
Industry
CEO
Nikesh Arora
Website
Headquarters
Santa Clara
Founded
2005
ISIN
US6974351057
FIGI
BBG0037SZ782
Palo Alto Networks, Inc. engages in the provision of network security solutions to enterprises, service providers, and government entities. It operates through the following geographical segments: the United States, Israel, and Other Countries. The company was founded by Nir Zuk in March 2005 and is headquartered in Santa Clara, CA.
Related stocks

$PANW all time highs break now looking for $225 and $240PANW - stock finally breaking and holding above $210 level, Stock hitting all time highs today. looking for bigger move here. Stock has next resistance at $225 and $240. looking for those price targets to hit. Stock is decent at the indicator level.
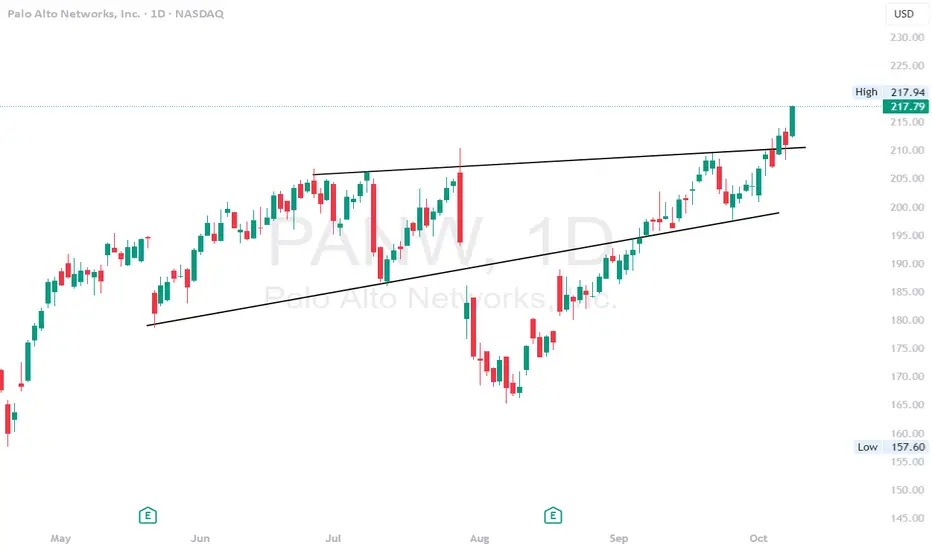
PANW - all time highs break here more upside possiblePANW - Stock hitting all time highs today after finally holding trendline resistance breakout on the daily. calls above $213.50 looking good here for a move towards $225 and higher. Stock needs to hold $210 critical support level. on high watch this week

$PANW next big mover $250+?If you look at the chart, you can see that PANW has formed a large inverse head and shoulders, a move above the resistance line should produce a huge move to the upside.
I have no clue what causes the move, but breaking $207.50 should trigger a move to the upper resistance levels.
Let's see if it

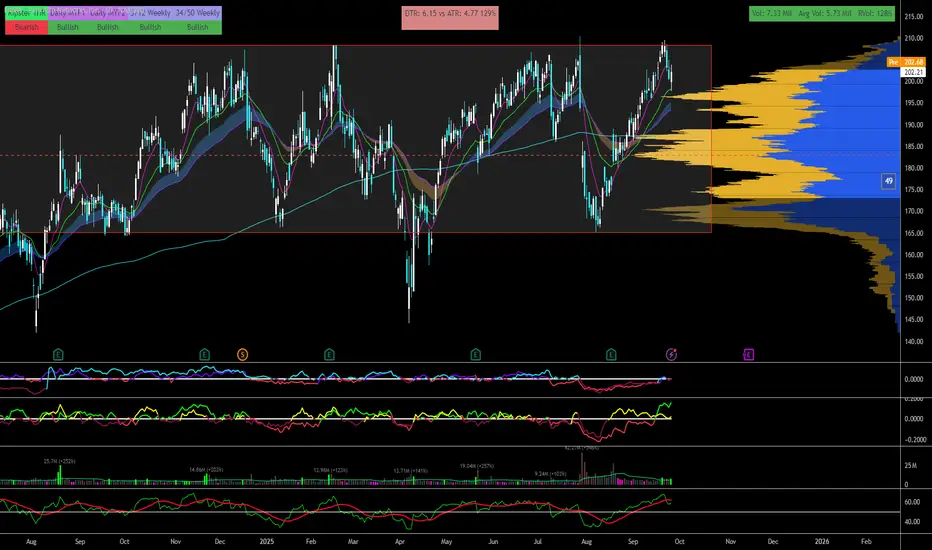
ATH Breakout Setup with Psych 200 and 2 year consolidationThe last breakdown from ATH happened before their earnings for some acquisition news.
It recovered quite quickly since August and tested ATH again in September. Now sitting at 21ema
Whats good here?
+200 Psych level under us
+Big Volume shelf VRVP and Support $196.75
+Above all significant MAs
+2 y
PANW eyes on $191: Dual-Fibs may give dip to catch the TrainPANW got a nice boost from the last earnings report.
Secondary Wave just hit a resistance zone $191.26-191.72
Look for a Dip-to-Fib or Break-n-Retest to catch the train.
.
See "Related Publications" for other PRECISE and TIMELY charts
======================================================
.

PANW Probabilistic Outlook (30D Horizon)🔮 PANW Probabilistic Outlook (30D Horizon)
Current Price: $190.16
📉 Forecast Models
WaverVanir DSS → 15D: $182.44 (-4.5%), 30D: $191.78 (+0.4%)
Institutional Model → Target: $179.18 (-5.8%), Signal: Strong Sell
📊 Options Flow
Heavy put sweeps at 185 (Sep 5) = bearish bias
Light call activity
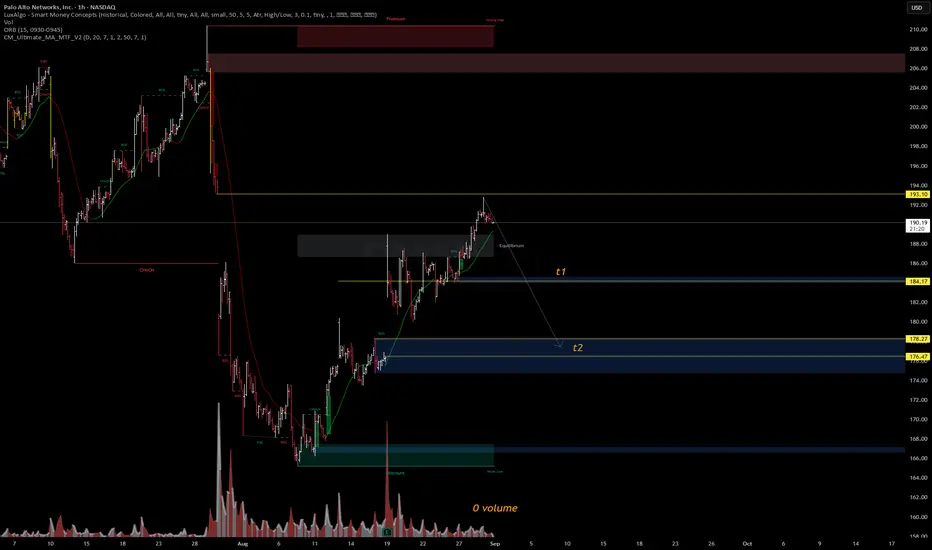
PANW Long to close the gap after earnings next Aug 18Because of the fall of NASDAQ:PANW was due to the acquisition of CyberArk and as sympathy fall from NASDAQ:FTNT but not because of fundamental reasons or sector/market issues, I used 1 year Fib Retracement to see what would be the worst bottom and best probability bounce taking in consideration

A Move Up For $PANWHere you'll see two projected paths for $PANW. #1) If price can stay above 186.92 it should continue to fill gap up to 193.68. Now there is a small gap below at 178. #2) if it can't break above these moving averages then it has potential to retrace, fill lower gap before a move up.
My short term

PANW Earnings Surge Incoming: 180C Call Targeting 300%
# 🛡️ PANW Earnings Options Play – 8/22 AMC
📊 **Market Context**
* Revenue Growth: +15.3% YoY 📈
* Gross Margin: 73.6%, Operating Margin: 9.8%
* Forward EPS: \$7.20 → historically beats 8/8 quarters
* Sector Tailwinds: Cybersecurity demand surging, favorable macro trends
📈 **Options Flow**
* Cal

See all ideas
Summarizing what the indicators are suggesting.
Neutral
SellBuy
Strong sellStrong buy
Strong sellSellNeutralBuyStrong buy
Neutral
SellBuy
Strong sellStrong buy
Strong sellSellNeutralBuyStrong buy
Neutral
SellBuy
Strong sellStrong buy
Strong sellSellNeutralBuyStrong buy
An aggregate view of professional's ratings.
Neutral
SellBuy
Strong sellStrong buy
Strong sellSellNeutralBuyStrong buy
Neutral
SellBuy
Strong sellStrong buy
Strong sellSellNeutralBuyStrong buy
Neutral
SellBuy
Strong sellStrong buy
Strong sellSellNeutralBuyStrong buy
Displays a symbol's price movements over previous years to identify recurring trends.
Curated watchlists where 5AP is featured.

Software stocks: US companies at our finger tips
49 No. of Symbols
See all sparks
Frequently Asked Questions
The current price of 5AP is 189.48 EUR — it has decreased by −0.67% in the past 24 hours. Watch Palo Alto Networks, Inc. stock price performance more closely on the chart.
Depending on the exchange, the stock ticker may vary. For instance, on XETR exchange Palo Alto Networks, Inc. stocks are traded under the ticker 5AP.
5AP stock has risen by 2.11% compared to the previous week, the month change is a 10.68% rise, over the last year Palo Alto Networks, Inc. has showed a 14.58% increase.
We've gathered analysts' opinions on Palo Alto Networks, Inc. future price: according to them, 5AP price has a max estimate of 215.02 EUR and a min estimate of 112.67 EUR. Watch 5AP chart and read a more detailed Palo Alto Networks, Inc. stock forecast: see what analysts think of Palo Alto Networks, Inc. and suggest that you do with its stocks.
5AP stock is 1.29% volatile and has beta coefficient of 1.36. Track Palo Alto Networks, Inc. stock price on the chart and check out the list of the most volatile stocks — is Palo Alto Networks, Inc. there?
Today Palo Alto Networks, Inc. has the market capitalization of 128.88 B, it has increased by 4.08% over the last week.
Yes, you can track Palo Alto Networks, Inc. financials in yearly and quarterly reports right on TradingView.
Palo Alto Networks, Inc. is going to release the next earnings report on Nov 13, 2025. Keep track of upcoming events with our Earnings Calendar.
5AP earnings for the last quarter are 0.83 EUR per share, whereas the estimation was 0.78 EUR resulting in a 7.32% surprise. The estimated earnings for the next quarter are 0.77 EUR per share. See more details about Palo Alto Networks, Inc. earnings.
Palo Alto Networks, Inc. revenue for the last quarter amounts to 2.22 B EUR, despite the estimated figure of 2.19 B EUR. In the next quarter, revenue is expected to reach 2.13 B EUR.
5AP net income for the last quarter is 222.32 M EUR, while the quarter before that showed 231.43 M EUR of net income which accounts for −3.94% change. Track more Palo Alto Networks, Inc. financial stats to get the full picture.
No, 5AP doesn't pay any dividends to its shareholders. But don't worry, we've prepared a list of high-dividend stocks for you.
As of Nov 3, 2025, the company has 16.07 K employees. See our rating of the largest employees — is Palo Alto Networks, Inc. on this list?
EBITDA measures a company's operating performance, its growth signifies an improvement in the efficiency of a company. Palo Alto Networks, Inc. EBITDA is 1.76 B EUR, and current EBITDA margin is 21.37%. See more stats in Palo Alto Networks, Inc. financial statements.
Like other stocks, 5AP shares are traded on stock exchanges, e.g. Nasdaq, Nyse, Euronext, and the easiest way to buy them is through an online stock broker. To do this, you need to open an account and follow a broker's procedures, then start trading. You can trade Palo Alto Networks, Inc. stock right from TradingView charts — choose your broker and connect to your account.
Investing in stocks requires a comprehensive research: you should carefully study all the available data, e.g. company's financials, related news, and its technical analysis. So Palo Alto Networks, Inc. technincal analysis shows the buy rating today, and its 1 week rating is buy. Since market conditions are prone to changes, it's worth looking a bit further into the future — according to the 1 month rating Palo Alto Networks, Inc. stock shows the buy signal. See more of Palo Alto Networks, Inc. technicals for a more comprehensive analysis.
If you're still not sure, try looking for inspiration in our curated watchlists.
If you're still not sure, try looking for inspiration in our curated watchlists.