Meta at resistanceMeta is at resistance. I doubt it has the momentum to get to the next resistance level at $157, if it did that would be a great place to short. I believe Meta will retest the lows in the near future (3-6 months).
FB2A trade ideas

$META bullish engulfing on the daily. $META bullish engulfing on the daily.
My next Price target is the $135 PL
NASDAQ:META

$META is looking for the Bullish engulfing on the daily. $META is looking for the Bullish engulfing on the daily.
When it breaks out of the ascending triangle on the session hour, it goes to $135.

META 120 gap close Short back to trendline support or 120 gap close.
Still short term bullish as long as trendline support holds.
The October gap has been closed so Meta will most likely move in general direction of QQQ unless company specific news comes out
Stop loss 130

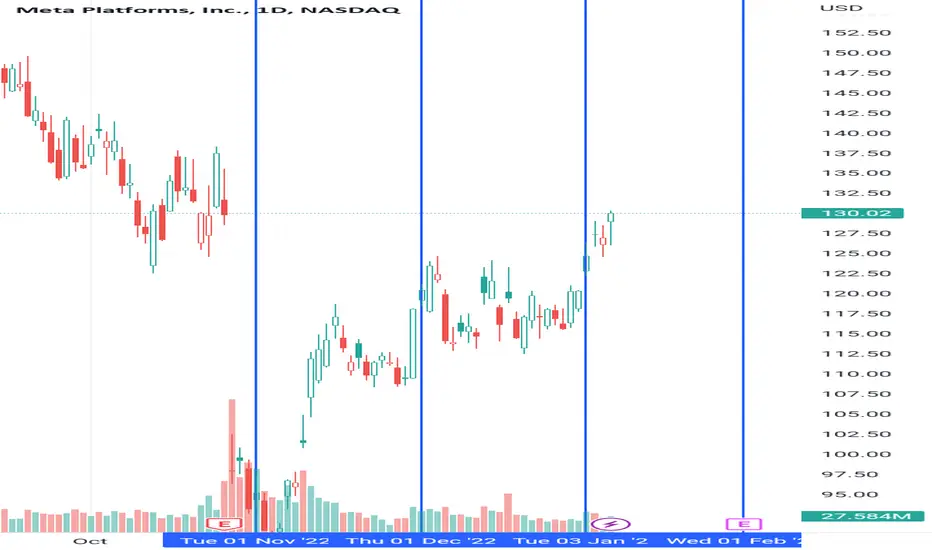
META Closed 2 straight green months, the first time since 2021!Meta Platforms (META) is on a strong January monthly candle (chart on the right) having closed in December two straight green months for the first time since August 2021, which was its All Time High. This alone is a huge bullish development, which along with the 1M RSI being on an Inverse Head and Shoulders pattern (IH&S), it can start staging its long-term bullish reversal.
On the more medium-term 1D time-frame (chart on the left), Meta also made a significant bullish development, as yesterday it clearly broke (but failed to close) above the 1D MA100 (green trend-line), for the first time in one whole year (since December 30 2021). Having turned the 1D MA50 (blue trend-line) into a Support this last month (since December 12), if it manages to close a daily candle above the 1D MA100, the stock's next aim would be the 1D MA200 (orange trend-line).
The 1W RSI also had a major bullish break-out as it broken above a Resistance Zone holding since August 15, that previously had rejected the price a total of three times (Triple Top). In our view we can claim that Meta has a sustainable bullish reversal only if it breaks above the 1D MA200.
-------------------------------------------------------------------------------
** Please LIKE 👍, FOLLOW ✅, SHARE 🙌 and COMMENT ✍ if you enjoy this idea! Also share your ideas and charts in the comments section below! **
-------------------------------------------------------------------------------
💸💸💸💸💸💸
👇 👇 👇 👇 👇 👇

META Potential for Bullish Rise | 10th January 2023Looking at the H4 chart, my overall bias for META is bullish due to the current price being above the Ichimoku cloud, indicating a bullish market. I'm looking for a pullback buy entry at 124.03, where the 38.2% Fibonacci line is. Stop loss will be at 112.47, where the recent low is. Take profit will be at 137.66, where the 50% Fibonacci line is.
Any opinions, news, research, analyses, prices, other information, or links to third-party sites contained on this website are provided on an "as-is" basis, as general market commentary, and do not constitute investment advice. The market commentary has not been prepared in accordance with legal requirements designed to promote the independence of investment research, and it is therefore not subject to any prohibition on dealing ahead of dissemination. Although this commentary is not produced by an independent source, FXCM takes all sufficient steps to eliminate or prevent any conflicts of interest arising out of the production and dissemination of this communication. The employees of FXCM commit to acting in the clients' best interests and represent their views without misleading, deceiving, or otherwise impairing the clients' ability to make informed investment decisions. For more information about the FXCM's internal organizational and administrative arrangements for the prevention of conflicts, please refer to the Firms' Managing Conflicts Policy. Please ensure that you read and understand our Full Disclaimer and Liability provision concerning the foregoing Information, which can be accessed on the website.

Meta ShortNASDAQ:META
Rejecting candle, Gap below, Weak on green days, Meta is on the way to close the gap.
TP - Gap close if reject or cpi will change the results may close trade before.

lovely bounce, can we clear trend resistance now? 🔭dec 15th meta was 115, sitting at multiple support zones and I called for a bounce from there..:)
nice bounce as expected, but now approaching trend resistance that has not broken in months.
rejection from this and dip back to 110-115 is possible, but break and we rally to 175-220 🚀 boost and follow for more, thanks ❤

META pre earnings levels META is back to levels where it was days before it's last earnings call. Earnings season is right around the corner but META isn't looking so strong at least until later in the year (or 2024) along with other big tech companies.
META still in bearish channelNASDAQ:META has rallied since the earnings of late October, but is still in a long-term bearish channel.
It has retraced 78.6% of the the gap (down) made the day of its Earnings report.
I can picture the stock rallying to $130, but not much farther, and then being smacked down around mid-to-late December.

Meta Either OrLooking at both long and short positions for Meta, Long from just above the 85 area and short at below 160.

META is setting up for a breakout.What we are looking at here is META on the Daily TF.
I want to draw your attention to the downward sloping line (yellow), where price action has been attacking since the beginning of April.
The yellow line was acting as resistance until the 5th hit of that line, when a break out occurred (purple box).
Now that we have seen a breakout above that resistance line, the chart is indicating that the price action wants to go a bit higher.
Once the price gets to around the $140 level it will hit the resistance line (green), where we can expect the price to stall out and eventually retrace back down to the blue support line (as it is an up-sloping trend line).
If it breaks through the blue support, it will head back down to the down sloping (yellow) trend line which will now act as major support.
The first hit of the blue line could possibly be a great place to start going long on META, knowing that if it does pierce the blue line, the yellow line will provide some additional support for a major move to the upside.
At the end of the chart you will notice the red arrows, which indicate how price action is expected to go.
META will continue to be monitored for price action and this post will be updated as things change.
In the comments, let me know what you think will happen.
Cheers.

$META Trade Idea - Currently Green on the 4h, D, W and M NASDAQ:META is green on the 4h, D, W and M
Calls over $128.52
Target $130, $135
Puts under $124.54
Target $122.30, 120.40

$META reversal and break out of Descending Triangle on 5m$META reversal and break out of Descending Triangle on 5m with time frame continuity on all time frames
Looking for a gap fill up to the $126.94 PL, then $127.45.

$META Bear flag on 5 min$META Bear flag on 5 min, with TF continuity on the daily, 4h 1h
Price targets: $124.16, $123.67, $122.60

META - Entry. Profit Target, Stop LossThoughts on where I think META could go in the near future. Long Swing Trade on 3 Hour chart SST Strategy based, follow me for more insights and ideas on Stocks !! "Simply Successful Traders"

META Bearish Wedge breakdownFollow through from breakdown today, continuation can drop to low 100s to fill gaps, looking for a longer term put swing on this to handle some chops and drops

$META Approaching Bear Gap Area$META Approaching Bear Gap Area after wedge breakout on 5min chart. If we take out the HOD I'm expecting this to reach the $129.82 PL which closes the bear gap.
NASDAQ:META

META Simple Chart AnalysisMeta - Resistance 124 & 138. Support 112 area. Red chip are appearing more aggressive here. Individual may relook into this.
How to view the guidance via chart ( Refer back to pin message guidance if to trade )
Red Line = Support
Blue Line = Resistance
Light Blue = bullish/bearish pattern
Arrow = Double/Trip top/bottom
Red Chip = $$
Green Chip = XX

META: Breakout of moving averageHello.Trendline breakout + above moving average + RSI in oversold zone

METALONG-TERM: Retesting break back above historical level and downsloping channel breakout. (not financial advice)

META to extend losses even more?Meta - 30d expiry - We look to Sell a break of 107.98 (stop at 115.15)
The primary trend remains bearish.
There is no clear indication that the downward move is coming to an end.
This is curremtly an actively traded stock.
108.32 has been pivotal.
A break of the recent low at 108.32 should result in a further move lower.
Our overall sentiment remains bearish looking for lower levels.
Our profit targets will be 91.04 and 88.04
Resistance: 126.40 / 134.00 / 142.00
Support: 115.00 / 108.50 / 96.00
Please be advised that the information presented on TradingView is provided to Vantage (‘Vantage Global Limited’, ‘we’) by a third-party provider (‘Signal Centre’). Please be reminded that you are solely responsible for the trading decisions on your account. There is a very high degree of risk involved in trading. Any information and/or content is intended entirely for research, educational and informational purposes only and does not constitute investment or consultation advice or investment strategy. The information is not tailored to the investment needs of any specific person and therefore does not involve a consideration of any of the investment objectives, financial situation or needs of any viewer that may receive it. Kindly also note that past performance is not a reliable indicator of future results. Actual results may differ materially from those anticipated in forward-looking or past performance statements. We assume no liability as to the accuracy or completeness of any of the information and/or content provided herein and the Company cannot be held responsible for any omission, mistake nor for any loss or damage including without limitation to any loss of profit which may arise from reliance on any information supplied by Signal Centre.

$META breaking out of Symmetrical Triangle on Daily $META finished inside on the daily with a wedge break and looking for the $123.3 PL. If we can break above $120.4 we can extended to the $121 PL and then $123.3
NASDAQ:META
