NVDA: Power Gap Push — Can Bulls Hold the 182 Zone? Sep 23Price Action & Setup (1-Hour Chart)
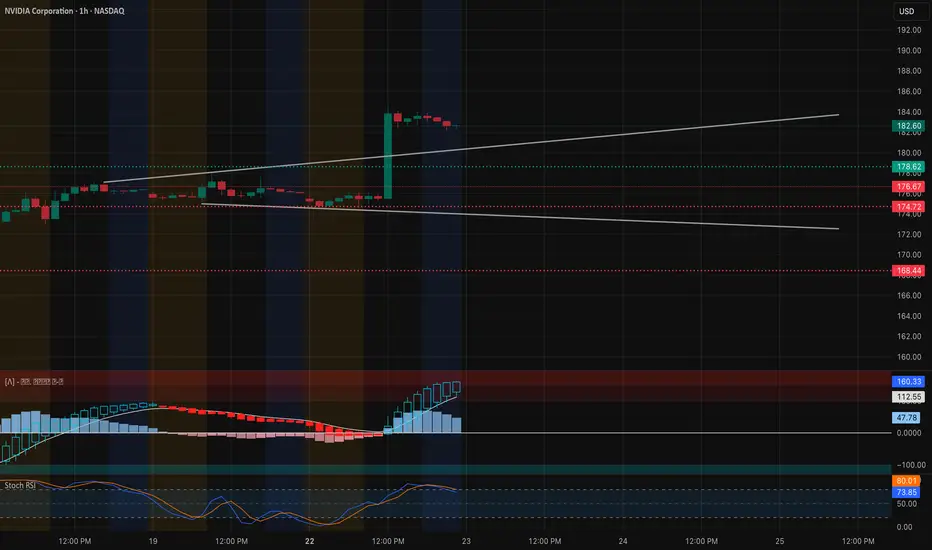
NVDA ripped early in today’s session, blasting through the mid-170s base and tagging 182–184 before cooling off. That surge printed a strong hourly impulse candle and left a shallow flag of lower highs, which often sets up the next leg if demand holds. Immediate intraday support sits around 178.6 and the breakout shelf at 176.6. Below that, 174.7 is a must-defend zone for bulls.
Momentum Check
MACD on the 1-hour flipped positive with expanding histogram but is flattening, signaling short-term digestion. Stoch RSI is still hot (near 80+), so a brief pullback to reset isn’t out of the question. Volume on the breakout was convincing, showing real participation, but follow-through volume on the flag is key.
GEX (Options Flow) Confluence
Gamma exposure backs the bullish case if 182.5 holds:
* Highest positive GEX / Call resistance: near 182.5
* 2nd Call Wall: ~185 (80% call concentration)
* 3rd Call Wall: ~190
* Put defense: 172.5 and 168.4
The dense call walls above mean that if NVDA stays pinned over 182.5, market makers may have to keep hedging upward, opening room toward 185 then possibly 190. A slip under 178–176 would instead drag toward the 172.5 put magnet.
Trading Plan
* Aggressive bull scalp: eye a break & hold above 182.6 → target 185 with tight stop under 180.8.
* Conservative entry: wait for a retest of 178.5–176.5 and a clean bounce before joining.
* Bearish hedge: if 176.5 fails on strong volume, consider a quick put play toward 172.5.
Option Angle
Calls around 182.5–185 strike for this week stay attractive for momentum traders if NVDA grinds above 182.5. For protection or a counter-move, short-dated puts near 172.5 can work if breakdown triggers.
Bottom Line
Bulls control momentum as long as NVDA holds 178–176. A decisive hourly close over 182.5 could spark a gamma-driven push toward 185–190. Lose 176.5 and the party cools fast.
Disclaimer: This is for educational discussion only and not financial advice. Always do your own research and manage risk.
NVD trade ideas
NVDASuccess in forex and stocks comes from a combination of knowledge, discipline, and patience. Understanding market trends, economic factors, and company fundamentals is crucial, but equally important is controlling emotions and sticking to a well-planned strategy. Continuous learning, adapting to changing conditions, and managing risk wisely can turn opportunities into consistent growth over time. Consistency, not luck, separates successful traders from the rest.

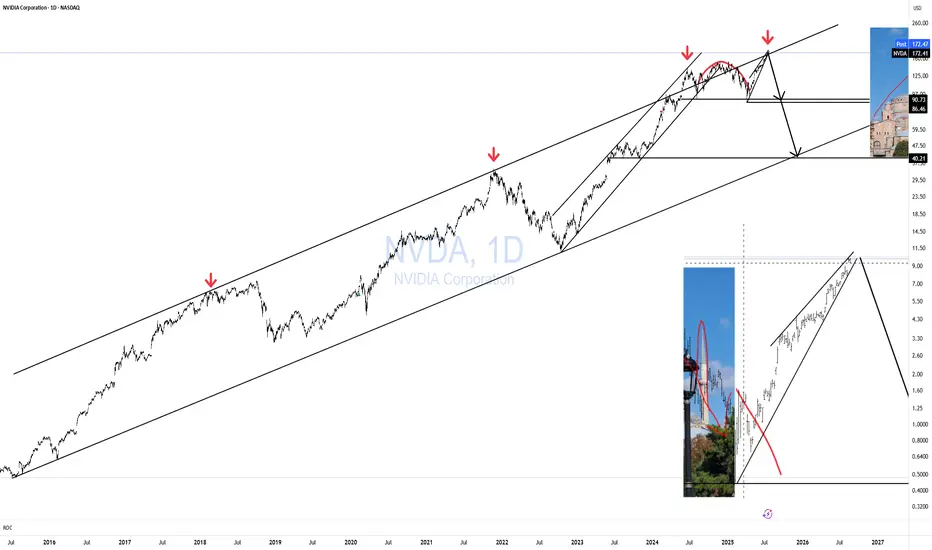
Nvidia - The rally is still not over!🔌Nvidia ( NASDAQ:NVDA ) still heads much higher:
🔎Analysis summary:
For the past decade, Nvidia has perfectly been respecting a major bullish rising channel formation. Currently, Nvidia is still far away from the upper red resistance trendline, which indicates another potential move higher. Just understand that the trend is your closest friend.
📝Levels to watch:
$200
SwingTraderPhil
SwingTrading.Simplified. | Investing.Simplified. | #LONGTERMVISION

Bullish Pullback Attack – NVIDIA Heist Plan for Escape Loot!🚨💻 NVIDIA (NVDA) Stock Heist Plan 🎭 | Swing & Day Trade Robbery 💰⚡
🌟 Hey Money Makers & Market Robbers! 🌟
Welcome back to the Thief Trading Den where we don’t trade… we steal from the market vaults! 🏦💸
🔥 Asset: NVIDIA (NVDA)
🎭 Heist Type: Swing / Day Trade
🔑 Plan: Bullish Pullback Robbery
🗝️ Entry (Breaking into the Vault)
First lockpick entry above 167.00+ 🔓
Retest & pullback = perfect robbery spot
Thief layering strategy: stack multiple buy limit orders (layered entry like robbers tunneling from multiple sides 🛠️).
Any price level? Yes, thieves adapt—grab loot wherever the window cracks open! 🏃♂️💨
🛑 Stop Loss (Escape Route 🚪)
Official Thief SL: @ 161.00 ⚠️
But dear Thief OG’s, adjust based on your risk appetite, loot bag size & startergy 🎭
Remember, no thief survives without an escape route! 🚁
🎯 Target (The Electric Fence Escape ⚡)
The High Voltage Electric Shock Fence is guarding the treasure @ 196.00 ⚡⚡
Snatch your profits before the fence fries the loot 🔥
Escape fast, spend faster, rob smarter 💸🍾
⚠️ Thief Alert 🚨
The market guards (short sellers) are patrolling heavy—don’t get caught in their traps 🕵️♂️
Use layered limit orders, scale out profits, and keep your SL tight!
A true thief never overstays at the crime scene 👀
💥 Boost this Robbery Plan 💥
Every like & comment powers the Thief Trading Family 🏆
Stay sharp, stay sneaky & let’s rob NVIDIA together! 🤑🎭

$200 PTStrong move with Open AI investment announcement. Barely made a new 52 week high, looking for a strong continuation tomorrow; $200 price target as next milestone in price discovery.

NVDA back up - MVP SYSTEMMomentum - RSI broke back to the upside
Volume - Some increase; Not a large increase
Price - Large green volume Candle On the Break to the upside on momentum
That wasn’t much of a pull back. I’ll take a look at the weekly and monthly charts as well.
NVDA SELLIf you have not SELL NVDA, than be prepare to SELL NVDA riding it back down to 93.00 to 77.00 as Profit Targets, Stop Loss will be determine later!
If anyone likes long mumbo jumbo garbage analysis, than this is NOT for you.
Also, if you are afraid of risk, failure, and want only a 100% sure thing, than
run as fast as you can from the market, because the market is NOT a sure thing,
so it is definitely NOT for you.
WARNING: This is just opinions of the market and its only for journaling purpose. This information and any publication here are NOT meant to be, and do NOT constitute, financial, investment, trading, or other types of advice or recommendations. Trading any market instrument is a RISKY business, so do your own due diligence, and trade at your own risk. You can loose all of your money and much more.

$NVDA: The River Changes Course - A Mean Reversion IdeaThe Technical Landscape
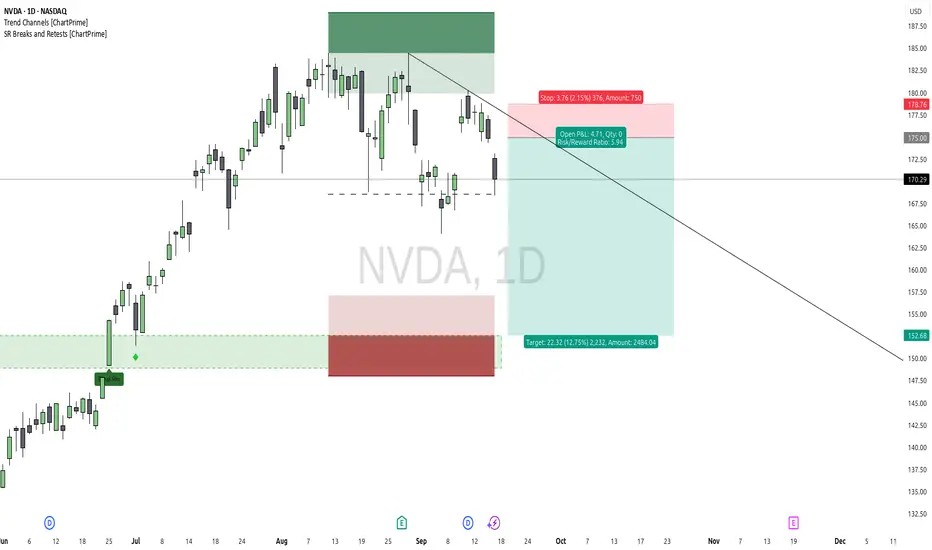
Our prior long setup on NASDAQ:NVDA was invalidated, providing us with the invaluable information that the bullish momentum has stalled. Following the Fed's announcement, the market's breath has changed. We now see a potential downtrend forming on the daily chart, with price creating lower highs and respecting a new descending trendline. The bears, who have been slumbering, appear to be waking up.
Instead of fighting this new current, we look to flow with it. The thesis is no longer about bullish continuation, but about a potential reversion to the mean. Price has a memory, and we are targeting a return to the scene of the previous major breakout, the demand zone around the $152 level. This is simply one piece of the puzzle, viewed without bias or ego.
The Philosophy - Listening When The Market Speaks
The trend is your friend, until it isn't. Our job is not to predict when the friendship will end, but to recognize when the dynamic has changed and act accordingly.
Our previous attempt at a long wasn't a failure; it was the market telling us, at a very small cost, that our hypothesis was incorrect for the current conditions. A limitless trader embraces this information with gratitude, for it protects us from the much greater cost of being stubborn. We are not "flipping" from bull to bear out of emotion. We are simply listening, adapting, and aligning with the price action that is presenting itself right now. Don't be a salmon, stubbornly fighting a new and powerful current. A limitless trader considers all outcomes, and right now, the path of least resistance appears to be pointing down.
An Illustrative Setup
Style: Short / Mean Reversion
Entry: An area of confluence around $175, near the descending trendline resistance.
Stop Loss: A defined stop above recent highs and trendline resistance at $178.75. If price breaks this level, our bearish thesis is invalidated.
Take Profit: Targeting the area of prior breakout, around $152.50.
Risk/Reward: Approximately 1 : 5.9
A safer, more conservative entry could be sought on a break and hold below the $168 support level, but always remember to manage your own risk based on your personal strategy.
Disclaimer: This is not financial advice. It is for educational and informational purposes only. Please conduct your own research and manage your risk accordingly.
$NVDA 15-Min: The God Candle That Spoke Loudest NASDAQ:NVDA exploded on the 15-minute chart today.
One bar, full conviction — the type of move traders call a god candle.
But here’s the truth: it isn’t about chasing candles.
It’s about having a process that makes you ready when they appear.
The groundwork is done before the bell.
Pre-market calculations define the risk, filter the noise, and set the stage for the opening drive.
When the signal aligns, you don’t predict — you execute.
Most of the time, the market is noise.
Occasionally, it speaks clearly.
Your job is to cut the losers fast, let the winners breathe, and keep showing up until the edge reveals itself.

NVDA Sep 22 Game Plan – “Grinding Up or Topping Out?”1️⃣ Big Picture on the 1-Hour Chart
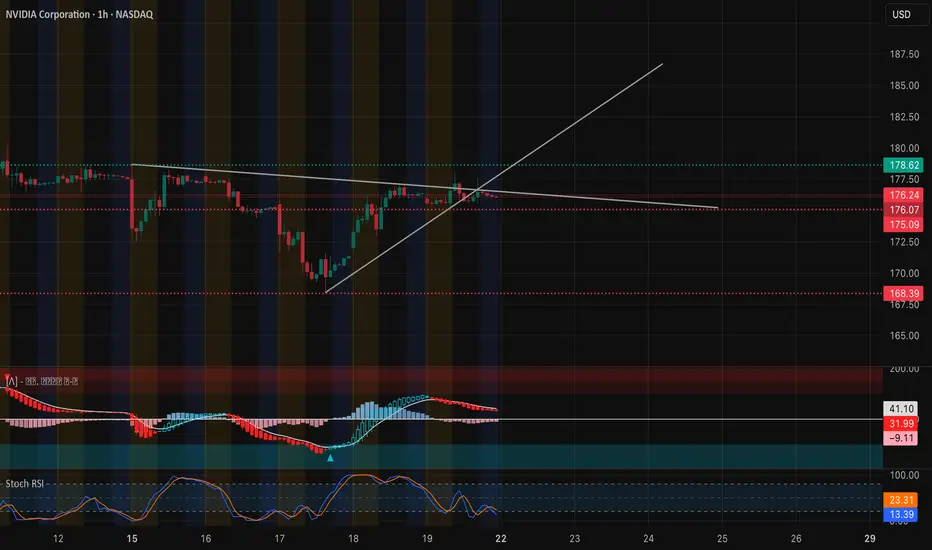
* Price action: NVDA closed Friday around 176.07, sitting right on a short-term rising trend line. Price has been stair-stepping higher off the 172 area, but momentum is flattening.
* Key levels:
* Resistance: 178.60–180 (recent high & big call wall)
* Support: 175–172.5 (trendline & gamma pivot)
* Indicators:
* MACD on the hourly is rolling over – still above zero but losing steam.
* Stoch RSI is down near oversold and trying to curl, so a quick bounce isn’t off the table.
This paints a neutral-to-slightly-bullish short-term picture: the uptrend is alive, but it’s late in the cycle unless buyers step in hard at the open.
2️⃣ GEX / Options Flow
* Call concentration shows heavy walls near 178.6–180.
* HVL (High Volume Level) is sitting near 172.5, which often acts like a magnet if price slips.
* Below that, 167.5 and 165 are the next notable put supports.
* IVR is low (around 3), so options are relatively cheap if you’re looking at quick plays.
This means market makers may want to pin NVDA in the 175–180 zone early in the week. Breaks above 180 could squeeze toward 182.5+ fast, but a fail back under 175 risks a slide to 172.5 and maybe 170.
3️⃣ Trading Thoughts & Suggestions
* Scalp / day trade: Watch for a clean break of 178.6–180 with volume. If it holds, 182–183 is the next scalp target. Tight stop under 177.5.
* Fade setup: If early strength gets rejected hard at 178.6–180 and the trendline breaks, short ideas toward 175 → 172.5 make sense.
* Swing idea: Only interested in swings if we close >180 with confirmation; otherwise, chop is more likely.
4️⃣ Bottom Line
NVDA is at a decision spot. A quick pop above 180 could spark a mini gamma squeeze. Failure there with a trendline break drags it back toward 172.5 or even 170. I’ll let Monday’s first hour dictate the bias.
Disclaimer: This is just market opinion for educational discussion. It’s not financial advice. Always manage your own risk before trading.
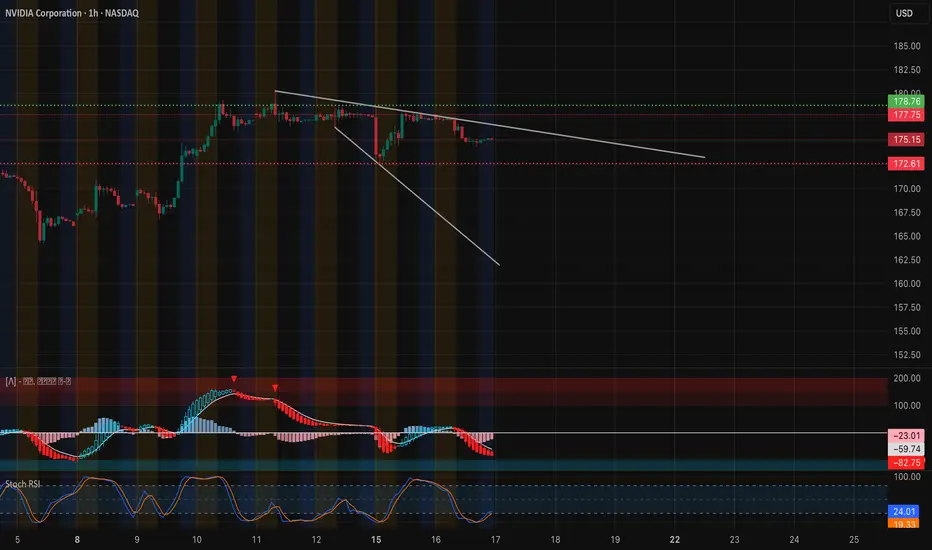
NVDA: Testing Key Support After Sharp Drop –Swing & Scalp Sep 171-Hour Chart Technical View
Nvidia’s 1-hour chart shows clear short-term weakness. After failing near $182.5, price has been trending down and now hovers around $175.15. MACD remains deep in negative territory and Stoch RSI is oversold, hinting at potential for a short-term bounce but no confirmed reversal yet.
* Immediate Support: $172.5 (high-volume node and HVL 09/19)
* Secondary Support: $170 and $166.5
* Resistance: $177.7 and $182.5 are key overhead levels for any rebound
Price is trading under both 9 and 21 EMA, confirming a short-term bearish structure until a clean reclaim above $177.7.
GEX & Options Flow
Options positioning highlights mixed sentiment with cautious call interest:
* Call Walls: $177.5 (2nd call wall), $182.5 (highest positive NET GEX / gamma resistance), and $185.
* Put Walls: $170 and $165 (significant downside hedges).
* GEX Bias: Around 23.5% calls with IVR at 5.7 (IVx ~40.8). This relatively low IVR shows option premiums are moderate despite the pullback.
Dealers may support the $172.5 area, but below that, gamma exposure flips bearish and accelerates downside risk.
Trade Thoughts & Suggestions
* Swing Idea: Aggressive buyers can nibble near $172.5 with a tight stop below $170, aiming for a relief bounce to $177.7–$182.5.
* Scalp Idea: Short bounces into $177.7 resistance if momentum stays weak, or scalp quick long entries off a confirmed double-bottom near $172.5.
* Bearish Scenario: A decisive break under $170 could accelerate selling toward $166.5.
Quick Take
NVDA is in a corrective phase. For Sept 17, all eyes are on $172.5. Holding that level can spark an oversold bounce; losing it could open the door to deeper downside.
Disclaimer: This analysis is for educational purposes only and does not constitute financial advice. Always do your own research and manage risk before trading.
Nvidia or new tulipCan u find 10 differences? i'm can't.
History repeats itself.
Do u still think that future is an tech ?

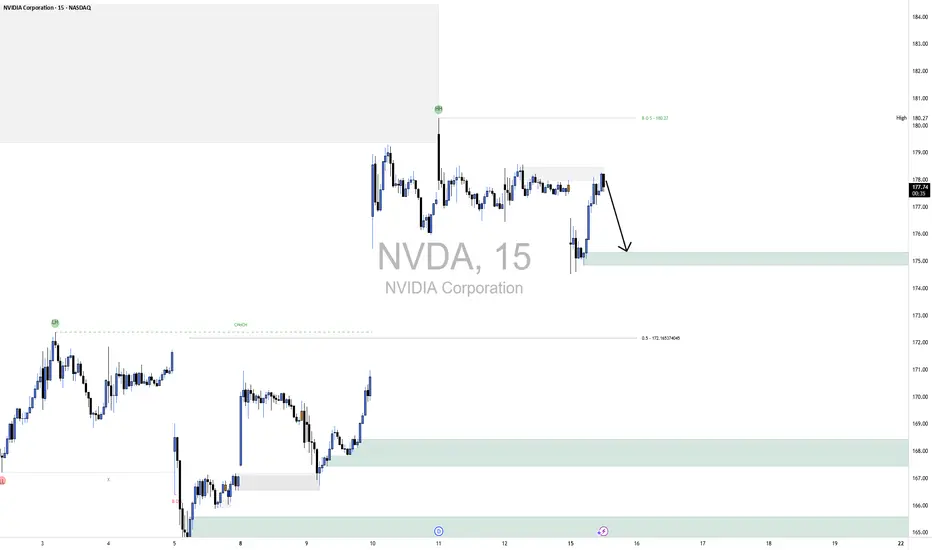
NVDA ShortThe broader market structure on NVDA remains range-bound but with a slight bearish tilt after the recent Break of Structure (BOS) at 180.27, which confirmed sellers pushing price lower from the recent swing high. This BOS indicates short-term momentum favoring the downside, with price unable to reclaim the highs.
Looking at supply and demand, the most recent supply zone near 178–179 caused a sharp reaction and rejection, showing that sellers stepped in with strength. The nearest demand sits at 175–174.5, where buyers previously initiated a strong impulse that led to the most recent rally, making it a valid level to watch for a bounce. Deeper demand exists near 172, which aligns with a 50% retracement level and previously acted as the base of a major move higher.
Price action within the marked region shows that NVDA is currently pulling back from supply, with sellers pushing price lower and momentum slowing on the way down. The most likely next step is a retest of the 175 demand zone. If price reacts bullishly here with strong candles, we could see a bounce back toward 177–178. However, if demand fails to hold and we break below 174.50, continuation toward 172 becomes likely as price seeks deeper liquidity.
The trade bias is currently bearish until we see a strong bullish reaction from demand. Invalidation for shorts would be a clean reclaim and close above 178.50, which would shift structure back toward the upside and likely target 180 again. Momentum currently favors sellers, given the BOS and recent rejection from supply, and candles show lower wicks are minimal—indicating little absorption from buyers yet.
Tech giants ignite the market: NVIDIA — $4.3T, Oracle +40%...As of September 2025, #NVIDIA’s market capitalization is estimated at about $4.313 trillion, making #NVIDIA the most valuable publicly traded company in the world by market cap.
Across big tech, the backdrop has turned decisively positive: #Oracle shares have surged 40% on accelerating cloud revenue and AI contracts; #Apple unveiled a new device lineup led by iPhone 17; and #Google continues to climb on progress in AI tools, ad tech, and cloud services. Together, these catalysts are lifting demand for AI infrastructure and ecosystem services, reinforcing network effects between hardware vendors, platforms, and developers.
Key growth drivers for IT giants in 2025:
#Oracle — faster cloud revenue, major AI contracts, and expanded data-center infrastructure sparked a sharp 40% jump in the stock.
#Apple — the launch of iPhone 17 and an updated device lineup strengthens ecosystem cash flows, driving upgrade cycles and service monetization and supporting a positive re-rating of the shares.
#Google — gains in advertising and cloud alongside the rollout of generative AI, improvements in search and commerce products, and cost optimization for inference.
#NVIDIA — new chips and architectures (including Blackwell) cement leadership in AI compute, while data-center expansion and the MLOps stack support a robust order backlog.
Institutional demand — inflows into AI-themed funds and ETFs, plus strategic partnerships by corporations and governments, are sustaining premium sector valuations and fueling a broadening cycle of spend on AI infrastructure, devices, and platform services.
According to FreshForex, a prolonged AI demand cycle and scaling potential create conditions for further share-price appreciation. The parallel surge in #Oracle , product updates from #Apple , and #Google’s rally keep the spotlight on the sector and bolster expectations for AI-driven earnings — from chips to devices and cloud — while #NVIDIA’s lead in next-gen architectures secures its role as a key beneficiary of the trend.

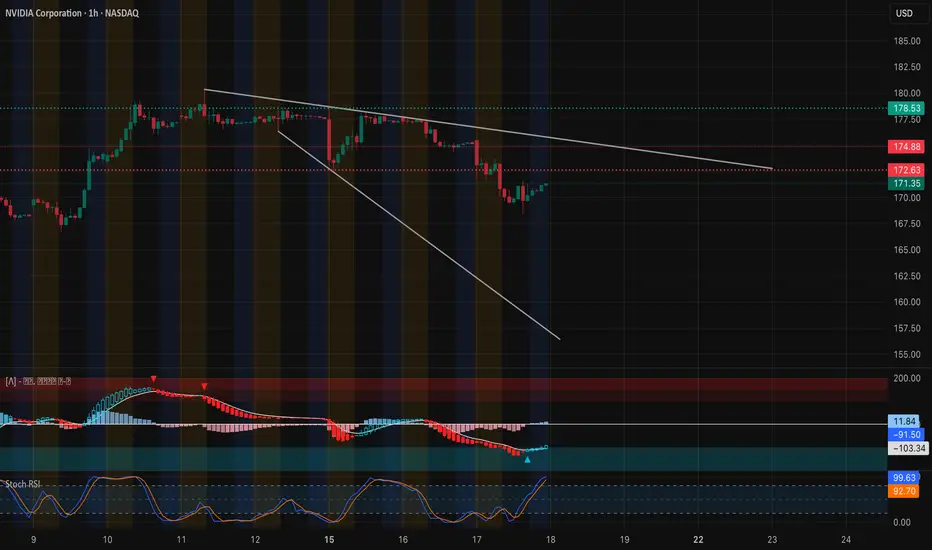
NVDA Trying to Find a Floor – Sept 18 Trade Levels to Watch Here’s my take on Nvidia heading into Wednesday’s session, based on the 1-hour chart and current GEX data.
1️⃣ Price Action & Market Structure
* Trend check: NVDA is still in a short-term downtrend after last week’s selloff, but buyers stepped in near $168–170, which lines up with prior volume support.
* Key level: $172.5 is a near-term pivot. Price is testing it now; a sustained push above could start a relief bounce toward $175–177.
* Resistance overhead: The descending trendline around $174.8–175 is the first real test for bulls. Above that, $178.5 and $182.5 are next supply zones.
2️⃣ GEX (Options Flow) Read
* Call/put balance: Calls only about 25% of flow—puts still dominate, showing cautious sentiment.
* Put walls: Big put interest at $170 and $165 creates a “magnet” if $172.5 fails.
* Call side: Not much until $177.5 and $182.5, where gamma clusters could help a squeeze if buyers surprise.
3️⃣ Trading Thoughts
* Conservative long scalp: If NVDA closes an hourly candle above $172.5–174, a pop toward $177–178.5 is on the table. Tight stop under $170.
* Short setup: If price rejects $172.5 and slips back below $170, expect a quick test of $167.5, maybe $165 on momentum.
4️⃣ Option Angle
* Directional play: Debit spreads (e.g., $175/$180 calls) are fine for a bounce if price confirms over $174.
* Income angle: Credit spreads selling $165 puts or $180 calls fit a range-bound view if you expect more chop.
5️⃣ My View
Nvidia is oversold enough to bounce, but the overall tape is still heavy. I’ll wait for an hourly close over $174 to trust the long side. Otherwise, any fade below $170 keeps the short trend alive.
Disclaimer: This analysis is for educational discussion only and does not constitute financial advice. Always do your own research and manage risk before trading.
NVDA HAGIA SOPHIA!The Hagia Sophia pattern has now fully formed; it just needs the crack! and the Hook!
No matter what your vague hunches and feelings are about AI, the charts will always win.
You can't "buy the dip" unless you know when to "Sell the Rip"!
If you can't see this resistance area, I don't know what to tell you.
Everyone is bullish at the top of a bubbliotious market without exception!
Click boost, Like, Subscribe! Let's get to 5,000 followers. ))
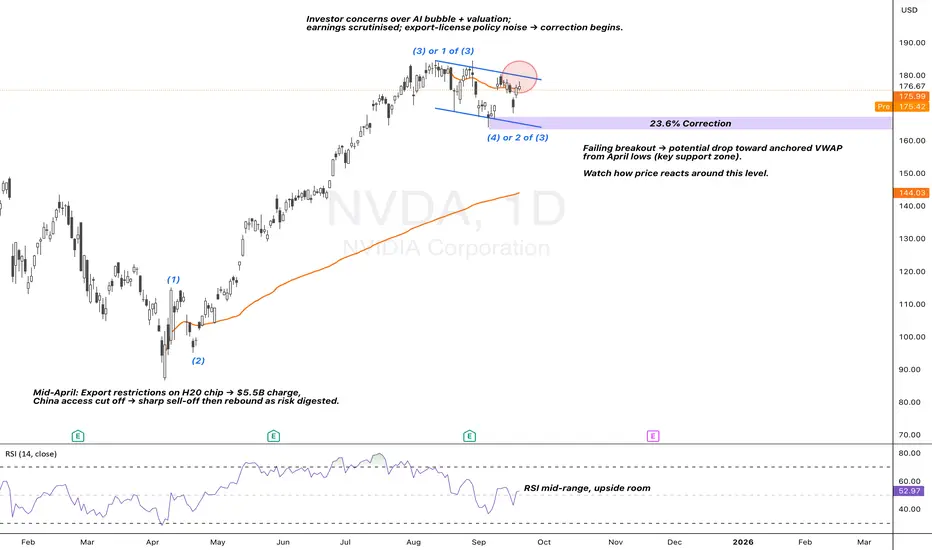
NVDA | Wave (3) in Play at Key Consolidation ZoneNVIDIA’s rally since April was powered by AI infrastructure demand and a rebound in risk sentiment after tariff and export-control concerns were digested. Strong hyperscaler capex and global AI partnerships reinforced the bottom-up story, while a broader tech bid lifted growth equities. Yet, the same catalysts pose risks: valuation stretch, regulatory noise, and questions on AI monetisation timelines leave room for volatility.
Technical Lens:
Price action suggests NVDA is tracking a larger wave (3). However, the sub-wave structure remains unproven, with only a shallow 23.6% retracement, leaving scope for further correction. Current consolidation sits at a decision point, supported by RSI, which remains mid-range with room to extend higher.
Scenarios:
If breakout holds: Momentum can carry into the next impulsive leg of wave (3), supported by structural demand.
If breakout fails: Price could rotate lower toward the anchored VWAP from April 2025 lows, a key support zone.
Catalysts:
Ongoing AI-driven hyperscaler spend and sovereign partnerships (upside).
Renewed U.S.–China export restrictions or capex digestion (downside).
Macro policy shifts and market positioning into year-end.
Takeaway:
This is a consolidation decision point within wave (3). Breakout = continuation, failure = correction toward April VWAP support.
NVDA: A Stoic Approach to a Losing Trade (The Second Breath)As we just discussed, a loss is not a failure; it's information.
This trade on NVDA is a perfect, real-time application of that Stoic and Douglas-inspired philosophy. The first attempt was stopped out for a small "paper cut" loss. The Stoics teach us to focus only on what we can control. We couldn't control the price hitting our first stop, but we can absolutely control our reaction.
Our reaction is not one of frustration, but of calm acceptance. We take the information the market gave us, remain balanced, and execute the next step of our plan.
The New Trade Plan
This second attempt is an action taken with more wisdom and an even better potential reward.
Style: Long / Re-Entry
Entry: Limit Order at $167.75
Stop Loss: A tight, strategically placed stop at $162.25 (3.28% risk)
Target: $192.50
Risk/Reward Ratio: Approximately 1 : 4.5
The #limitlessTrader's Mindset
The first trade was simply an exhale. This second trade is the next breath, taken with more clarity and from a place of balance. This is the process.
Just shine.
Disclaimer: This is not financial advice. It is for educational and informational purposes only. Please conduct your own research and manage your risk accordingly.

$NVDA İS BREAKİNG UPNASDAQ:NVDA After breaking downtrend line sometimes it is like a default move the retest previous downtrend. expecting to get more strengt in this area and test 184.50 ATH. This setup is one of my farovite one.

NVIDIA’s Decisive Battle at the $185 Resistance🔹 Short-Term Outlook (1–3 Weeks)
Current Situation:
NVIDIA (NVDA) is trading around $183.6, right below the critical $185 resistance—a level that has repeatedly capped the stock’s rallies.
Momentum & Pattern:
The price has reclaimed the 50-day moving average ($175.9) with a strong bullish candle, signaling renewed buying interest.
Bullish Scenario:
If NVDA breaks and holds above $185:
🎯 Target 1: $195
🎯 Target 2: $205
Bearish Scenario:
If the stock fails to break $185 and closes below $175:
❌ Short-Term Stop Loss: below $175
🎯 Downside Target: $165
🔹 Long-Term Outlook (2–6 Months)
Overall Trend:
The medium-term trend remains bullish, and a decisive breakout above $185 could ignite a new rally.
Bullish Scenario:
🎯 Medium-Term Target: $220
🎯 Long-Term Target: $250
Bearish Scenario:
If the stock loses the $160 support:
❌ Long-Term Stop Loss: below $160
🎯 Downside Target: $140
✅ Summary:
NVDA stands at a pivotal level. A breakout above $185 could open the door to $200 and higher, while rejection at this level risks a pullback toward $165.

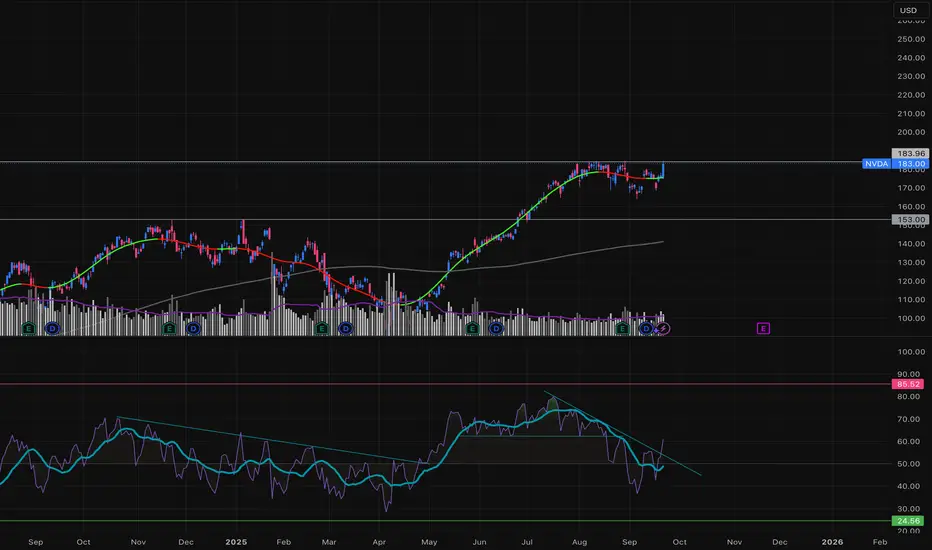
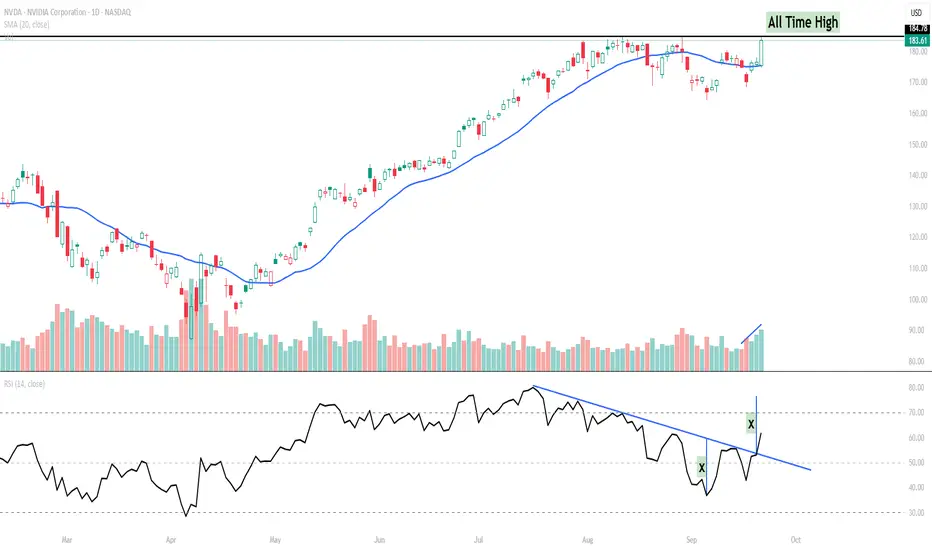
NVIDIA (NVDA) – RSI Trendline Breakout Signals Momentum Shift NVIDIA has staged a sharp move higher, reclaiming momentum after weeks of sideways-to-lower action. What makes this setup notable is not just the price, but the RSI trendline breakout.
Key Points:
RSI Trendline Breakout: The RSI broke above a descending trendline, suggesting momentum is shifting back in favour of buyers.
Volume Confirmation: The breakout coincided with a strong volume spike – often an early tell that institutions are stepping in.
Price Action: Price is now retesting the all-time high zone (~$184–185). A sustained close above this level could open the door for further upside.
Short-Term View: As long as NVDA holds above the $175–177 support zone, the bias remains bullish with potential for acceleration if RSI pushes toward the overbought zone.
Watchlist Levels:
Upside breakout trigger: $185+ (new all-time high)
Immediate support: $175
Momentum invalidation: Below $175
This is a classic case of how RSI trendline analysis can provide an early signal, often before price fully confirms the breakout.
Nvidia plummets ~3% afterhours! Buy the dip or sell the rally?Nvidia delivered another strong quarter, beating expectations on both revenue and EPS. However, shares dropped after hours to around $175, as data centre revenue narrowly missed forecasts and China sales remained absent due to regulatory uncertainty.
Technically, if NVDA breaks below $175, bears may target the $170 double bottom support in a dead-cat-bounce fashion, with a risk of further downside if that level fails. However, if the stock holds above $179 and reclaims $185, bulls could see a rally toward $193 and potentially $220 in the medium term, which could still materialise after a short-term decline toward $170.
This content is not directed to residents of the EU or UK. Any opinions, news, research, analyses, prices or other information contained on this website is provided as general market commentary and does not constitute investment advice. ThinkMarkets will not accept liability for any loss or damage including, without limitation, to any loss of profit which may arise directly or indirectly from use of or reliance on such information.

MARKING LEVELS TO( supply/ demand = trending) BULLISH MARKETS1.Find trend = current market is trending so i MARKed key LEVELS in the
(wkly,dly,1HR,15MIN )
I found the trend in the 15 minute timeframe, Soley focused on that time frame when looking at the next steps
2. wait for a bos {break of structure} in same direction of the trend= looked for a New LL (lower low) to be made= No candle close {real body}
3. waited till price to come to my demand zone
4. entered trade and set my tp to supply zone !
I took a step back to find out in the higher timeframes there was a KEy level of
Resistance so i dragged my tp right to the resistance. Looking to ride the trend.
i need to find a risk to reward
I need to stay patient
I need to stay disciplined
