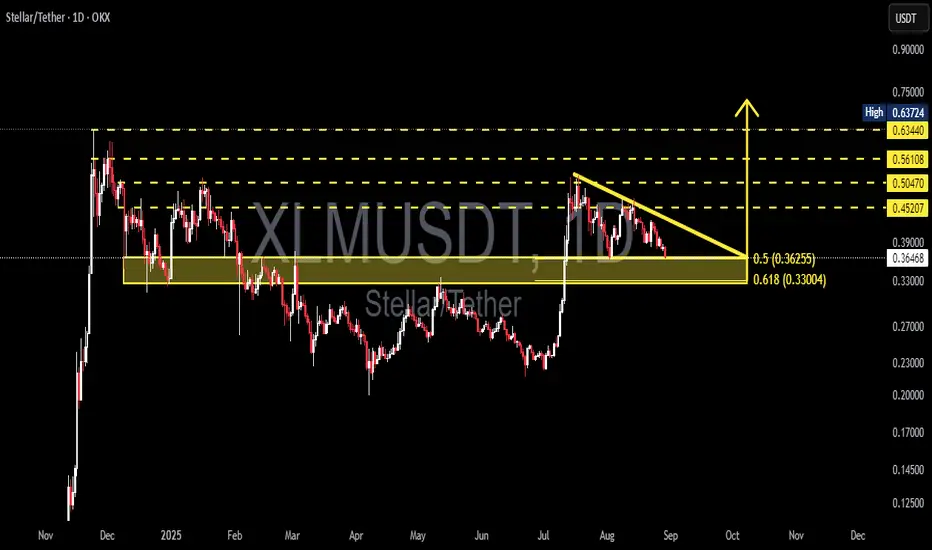
XLM/USDT — Descending Triangle at a Key Fibonacci Zone!🔎 Market Overview
Currently, XLM/USDT (Daily, OKX) is trading around 0.3645, testing the golden support zone between 0.3625 (0.5 Fib) and 0.3300 (0.618 Fib).
This area is highly significant because:
It has acted as a historical demand zone, repeatedly holding the price.
It aligns with the Fibonac
Related pairs
Stellar (XLM) Market Outlook — September 02, 2025Sergio Richi Premium ✅
#Stellar CRYPTOCAP:XLM — Market Outlook — September 02, 2025.
Current price : $0.3620
Charts:
Let’s be real: Stellar isn’t just another alt. It’s got actual utility — fast cross-border payments, cheap fees, and big-name partners (Visa, PayPal, MoneyGram, even Teleg

Long XLMBTC is bouncing from a strong support.
XLM would have another leg up from the local support trendline.
Trade setup is as in chart.

Stellar (XLM): We Will Fall a Little Bit More | Overall BullishXLM seems weak, and the price is looking for any zone of support from which to bounce. We are expecting to see a further downside movement here until the $0.36-0.37 mark, where we will be looking for any kind of reversal or form of MSB.
Once we see signs of a market structure break and trend revers

XLM/USD – Technical OutlookDaily Chart
• Price leaning on 50-day EMA (critical support).
• Holding → could evolve into symmetrical triangle → bullish breakout potential.
• Breakdown → targets $0.35 (confluence of liquidity zone + 200-day EMA).
• Indicators: RSI < 50 (weak momentum), MACD negative.
• Bias: Neutral, depend


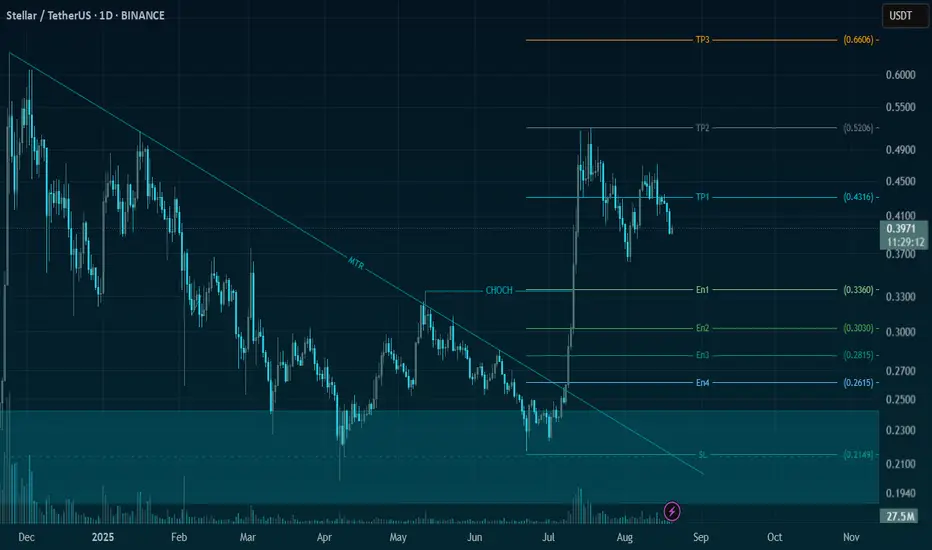
XLM/USDT - Bullish Momentum Gaining Strength🚀 Trade Setup Details:
🕯 #XLM/USDT 🔼 Buy | Long 🔼
⌛️ TimeFrame: 1D
--------------------
🛡 Risk Management (Example):
🛡 Based on $10,000 Balance
🛡 Loss-Limit: 1% (Conservative)
🛡 The Signal Margin: $375.52
--------------------
☄️ En1: 0.336 (Amount: $37.55)
☄️ En2: 0.303 (Amount: $131.43)
☄️ En3: 0
TradeCityPro | XLM: Key Support Holding Amid Seller Pressure👋 Welcome to TradeCity Pro!
In this analysis, I want to review the XLM coin for you. It is one of the RWA projects with a market cap of $12.76 billion, currently ranked 13th on CoinMarketCap.
📅 Daily Timeframe
In the daily timeframe, this coin has reached a Maker Seller zone. So far, it has tested

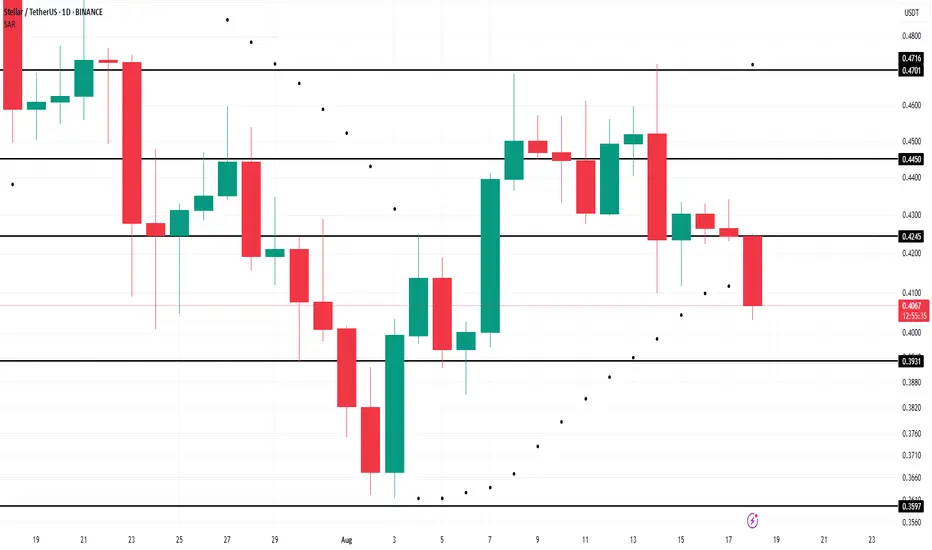
Stellar Falls To $0.40; But Parabolic SAR Flags Deeper DeclineAt the time of writing , BINANCE:XLMUSDT trades at $0.409 and faces a risk of slipping lower. Technical factors point to a potential drop toward $0.393 support, a level that may determine whether bearish control continues to strengthen in the coming sessions.
From a technical perspective, BINAN
XLMUSDT → Consolidation before rally to 0.4700BINANCE:XLMUSDT is recovering after a fairly aggressive decline, the purpose of which was to consolidate potential and retest trend support. The chart shows signs of a bullish movement...
The growth of BTC and ETH and the decline in Bitcoin's dominance index give altcoins a chance. The market

See all ideas
Summarizing what the indicators are suggesting.
Oscillators
Neutral
SellBuy
Strong sellStrong buy
Strong sellSellNeutralBuyStrong buy
Oscillators
Neutral
SellBuy
Strong sellStrong buy
Strong sellSellNeutralBuyStrong buy
Summary
Neutral
SellBuy
Strong sellStrong buy
Strong sellSellNeutralBuyStrong buy
Summary
Neutral
SellBuy
Strong sellStrong buy
Strong sellSellNeutralBuyStrong buy
Summary
Neutral
SellBuy
Strong sellStrong buy
Strong sellSellNeutralBuyStrong buy
Moving Averages
Neutral
SellBuy
Strong sellStrong buy
Strong sellSellNeutralBuyStrong buy
Moving Averages
Neutral
SellBuy
Strong sellStrong buy
Strong sellSellNeutralBuyStrong buy
Displays a symbol's price movements over previous years to identify recurring trends.
Frequently Asked Questions
The current price of XLM3xShort/Tether (XLM) is 0.55735 USDT — it has risen 0.40% in the past 24 hours. Try placing this info into the context by checking out what coins are also gaining and losing at the moment and seeing XLM price chart.
XLM3xShort/Tether price has risen by 19.52% over the last week, the last month showed zero change in price, and as for the last year, XLM3xShort/Tether has increased by 2.43 K%. See more dynamics on XLM price chart.
Keep track of coins' changes with our Crypto Coins Heatmap.
Keep track of coins' changes with our Crypto Coins Heatmap.
XLM3xShort/Tether (XLM) reached its highest price on May 12, 2022 — it amounted to 2.12482 USDT. Find more insights on the XLM price chart.
See the list of crypto gainers and choose what best fits your strategy.
See the list of crypto gainers and choose what best fits your strategy.
XLM3xShort/Tether (XLM) reached the lowest price of 0.00028 USDT on Apr 5, 2021. View more XLM3xShort/Tether dynamics on the price chart.
See the list of crypto losers to find unexpected opportunities.
See the list of crypto losers to find unexpected opportunities.
The safest choice when buying XLM is to go to a well-known crypto exchange. Some of the popular names are Binance, Coinbase, Kraken. But you'll have to find a reliable broker and create an account first. You can trade XLM right from TradingView charts — just choose a broker and connect to your account.
Crypto markets are famous for their volatility, so one should study all the available stats before adding crypto assets to their portfolio. Very often it's technical analysis that comes in handy. We prepared technical ratings for XLM3xShort/Tether (XLM): today its technical analysis shows the strong buy signal, and according to the 1 week rating XLM shows the buy signal. And you'd better dig deeper and study 1 month rating too — it's buy. Find inspiration in XLM3xShort/Tether trading ideas and keep track of what's moving crypto markets with our crypto news feed.
XLM3xShort/Tether (XLM) is just as reliable as any other crypto asset — this corner of the world market is highly volatile. Today, for instance, XLM3xShort/Tether is estimated as 2.20% volatile. The only thing it means is that you must prepare and examine all available information before making a decision. And if you're not sure about XLM3xShort/Tether, you can find more inspiration in our curated watchlists.
You can discuss XLM3xShort/Tether (XLM) with other users in our public chats, Minds or in the comments to Ideas.