XLM/USDT - Reversal Opportunity or Bearish Continuation?XLM/USDT on the Weekly (1W) timeframe is currently in a major corrective phase after failing to continue its previous bullish impulse. Price continues to form lower highs and lower lows, indicating that selling pressure remains dominant.
However, price is approaching a very strong historical demand
Related pairs
Stellar (XLM): Entering Weekends Market | Eyes on The EMAsXLM has been moving in a sideways accumulation area where price has been pressuring the 100 EMA for quite some time now.
As we enter the weekend markets, we are expecting a few scenarios from here. The key point would be the break of the EMAs, which would trigger a movement to the bullish CME gap.
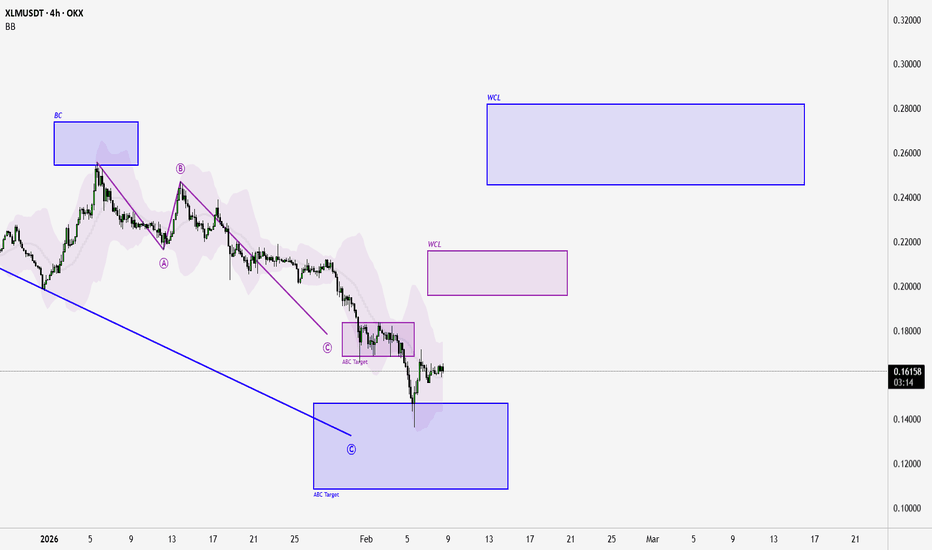
XLM — ABC Delivered, WCLs Now in PlayPrice has reached the bearish ABC C target on the 4H.
That’s a fact, not a forecast.
What happens next is not guaranteed .
Often after a sequence delivers, price looks for relief and retracement toward nearby liquidity — and in this case, the unreached WCL zones above are the obvious magnet
Spring in play? The crypto market just went through another heavy liquidation event, with BTC flushing down to 59k. As expected, altcoins took the brunt of the move with many breaking structural lows and sentiment capitulating.
Even so, a number of alts are now showing tradeable relief‑rally structures. These are
TRADE [5] XLMRecently, the market has gone through a period of shaking out weak hands, with prices dropping by more than 50%. We are now in a reaction phase to that decline, and this represents one of the opportunities currently available in the market. XLM is one of the oldest cryptocurrencies and has a high le
Stellar: bounce ahead or more pain? key levels to watchStellar. Knife catching or discount hunting? Recently the whole alt sector got hit as traders rotated out of risk after fresh macro comments, and according to market news Stellar just rode that same liquidation wave. Price flushed into fresh lows, sentiment is in the gutter... exactly where interest
XLM Is Breaking Out...Are You Ready Before the Real Move Starts?Yello Paradisers! Are you paying close attention to this one? Because #XLM just made a critical structural shift and if you're not watching it closely, you might miss one of the cleanest breakout setups we’ve seen lately. #XLM has officially broken out of its descending resistance, and that same lin
Stellar (XLM): Waiting For Buyers Dominance Over SupportXLM is hovering around a key local support zone and buyers are starting to fight for it, but dominance isn’t fully secured yet. What we’re watching now is simple: we need a proper upside push that gives us a clean break of structure. If that BOS comes in, that’s our confirmation and we can start loo
Buyers are waiting to re-enter XLM (8H)After creating a series of bearish moves, the market maker aggressively pushed the price upward in a sharp impulse move. During this strong rally, it is important to note that price not only formed a Bullish Change of Character (CHoCH), but also reclaimed key levels, confirming a shift in market str
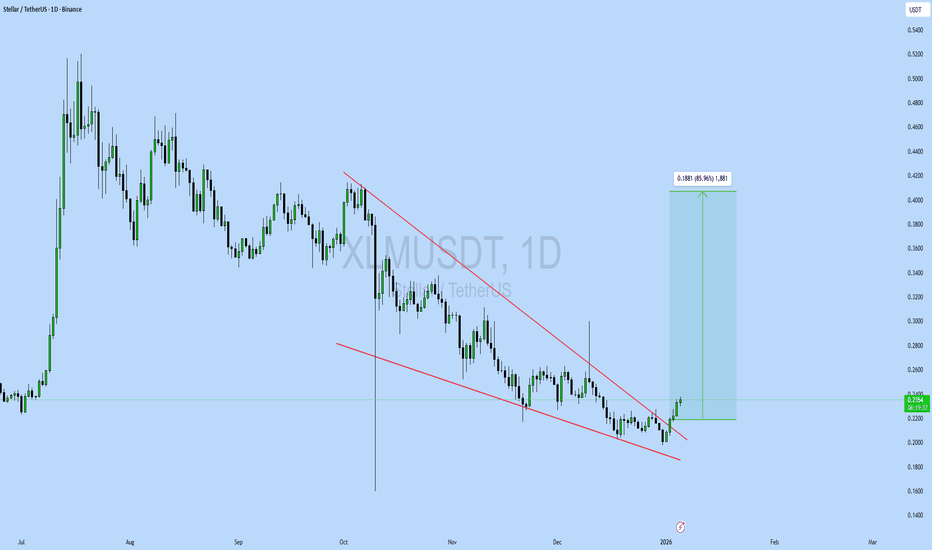
XLMUSDT UPDATE#XLM
UPDATE
XLM Technical Setup
Pattern: Falling Wedge Pattern
Current Price: 0.2351$
Target Price: 0.4230$
Target % Gain: 85.96%
Technical Analysis: XLM is breaking out of a falling wedge pattern on the 1D chart, signaling a potential bullish reversal. Price has pushed above the descending res
See all ideas
Summarizing what the indicators are suggesting.
Oscillators
Neutral
SellBuy
Strong sellStrong buy
Strong sellSellNeutralBuyStrong buy
Oscillators
Neutral
SellBuy
Strong sellStrong buy
Strong sellSellNeutralBuyStrong buy
Summary
Neutral
SellBuy
Strong sellStrong buy
Strong sellSellNeutralBuyStrong buy
Summary
Neutral
SellBuy
Strong sellStrong buy
Strong sellSellNeutralBuyStrong buy
Summary
Neutral
SellBuy
Strong sellStrong buy
Strong sellSellNeutralBuyStrong buy
Moving Averages
Neutral
SellBuy
Strong sellStrong buy
Strong sellSellNeutralBuyStrong buy
Moving Averages
Neutral
SellBuy
Strong sellStrong buy
Strong sellSellNeutralBuyStrong buy
Displays a symbol's price movements over previous years to identify recurring trends.
Frequently Asked Questions
The current price of XLM / UST (XLM) is 0.16981000 USDT — it has risen 1.98% in the past 24 hours. Try placing this info into the context by checking out what coins are also gaining and losing at the moment and seeing XLM price chart.
XLM / UST price has risen by 3.23% over the last week, its month performance shows a −28.94% decrease, and as for the last year, XLM / UST has decreased by −49.71%. See more dynamics on XLM price chart.
Keep track of coins' changes with our Crypto Coins Heatmap.
Keep track of coins' changes with our Crypto Coins Heatmap.
XLM / UST (XLM) reached its highest price on May 16, 2021 — it amounted to 0.79729000 USDT. Find more insights on the XLM price chart.
See the list of crypto gainers and choose what best fits your strategy.
See the list of crypto gainers and choose what best fits your strategy.
XLM / UST (XLM) reached the lowest price of 0.07022500 USDT on Dec 29, 2022. View more XLM / UST dynamics on the price chart.
See the list of crypto losers to find unexpected opportunities.
See the list of crypto losers to find unexpected opportunities.
The safest choice when buying XLM is to go to a well-known crypto exchange. Some of the popular names are Binance, Coinbase, Kraken. But you'll have to find a reliable broker and create an account first. You can trade XLM right from TradingView charts — just choose a broker and connect to your account.
Crypto markets are famous for their volatility, so one should study all the available stats before adding crypto assets to their portfolio. Very often it's technical analysis that comes in handy. We prepared technical ratings for XLM / UST (XLM): today its technical analysis shows the sell signal, and according to the 1 week rating XLM shows the sell signal. And you'd better dig deeper and study 1 month rating too — it's sell. Find inspiration in XLM / UST trading ideas and keep track of what's moving crypto markets with our crypto news feed.
XLM / UST (XLM) is just as reliable as any other crypto asset — this corner of the world market is highly volatile. Today, for instance, XLM / UST is estimated as 3.64% volatile. The only thing it means is that you must prepare and examine all available information before making a decision. And if you're not sure about XLM / UST, you can find more inspiration in our curated watchlists.
You can discuss XLM / UST (XLM) with other users in our public chats, Minds or in the comments to Ideas.


