13 dollar price target for ripplebased on 5 years of accumulation and 5 wave patterns an explosive move can be expected on this next month of june
XRPBEARUSDT trade ideas

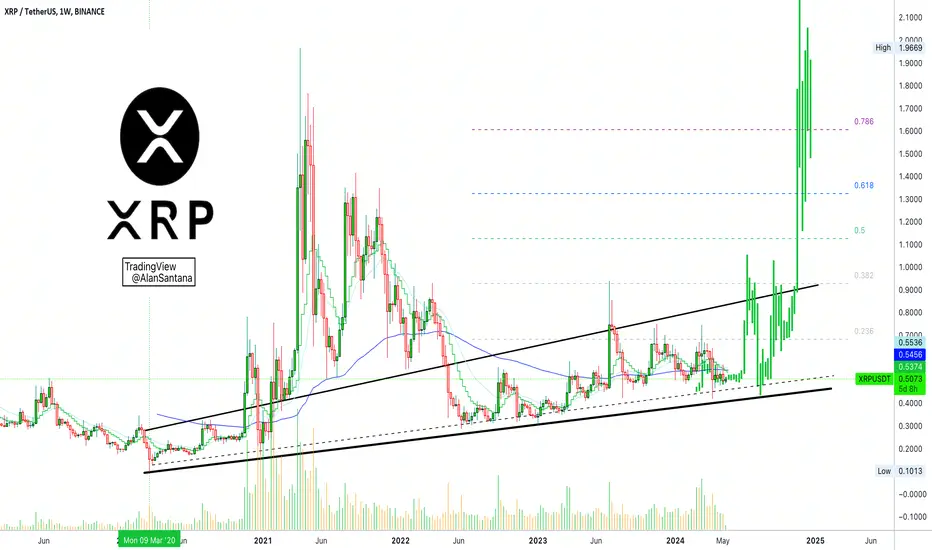
✴️ XRP 6 Months ProjectionThis is what can happen to XRP (XRPUSDT) in the coming months.
We are using a "6 months projection" time window but the general believe is that XRP can move before many of the major Altcoins; it is likely to be one of the first to move... One of the first to move big!
Why bullish?
➖ The last bullish wave happened 308 days ago (more than 10 months).
There is normally a 6-8 months waiting period between each bullish wave. The fat that XRPUSDT went through a correction and has been consolidating for this long is considered bullish.
➖ XRPUSDT has been producing higher lows since March 2020. Higher lows means that the bulls have the upper hand when it comes to the long-term trajectory of this chart.
➖ Many other projects produced massive growth while XRP stayed behind.
It moved first but it grew less than the biggest earners... The stage is set for a major bullish wave.
👉 Ripple's XRP is likely to move big in 2024 and 2025.
We are witnessing the end of the accumulation phase for this pair.
Once it starts going, it will go really strong and for a very long while... People will be wondering, "why didn't I buy when prices were low?"
➖ Prepare for the Cryptocurrency market crash.
👉 XRP will grow!
Namaste.
reverse bullish pattern in box xrp in box making strong conolidation ...note this crypto will do a strong bullish move after break up


Check for support around 0.5236-0.5384Hello traders!
If you "Follow" us, you can always get new information quickly.
Please also click “Boost”.
Have a good day.
-------------------------------------
(XRPUSDT 1D chart)
The most important point on the XRP chart is the 0.47 point.
This is because if it falls below 0.47, it is expected to enter the bottom range from a long-term perspective.
Therefore, the price should be maintained above 0.47.
Since the M-Signal of the 1M chart > M-Signal of the 1W chart > M-Signal of the 1D chart, it shows a downward trend.
Accordingly, the key is whether it can receive support and rise around 0.5236-0.5384.
If it fails to rise, caution is needed as it is likely to touch around 0.47 again.
If the HA-High indicator is supported and rises, it is likely to renew the previous best high.
Therefore, it is time to buy whenever it rises above the HA-High indicator on the 1D, 1W, and 1M charts and shows support.
If it is not supported by the HA-High indicator and falls, it will be time for a split sale, so caution is needed in response.
One thing you must think about before you start trading is your investment horizon.
If you do not decide how long you will invest for, you may not be able to respond properly when prices fluctuate, so you must decide on the investment period.
Next, you must decide how much to invest and how to trade or realize profits.
No matter how long-term you invest, you must sell when the price rises to a certain level.
There are three ways to sell: selling 100%, selling a portion, or selling an amount equivalent to the purchase principal to increase the number of coins (tokens) corresponding to the profit.
The method of increasing the number of coins (tokens) corresponding to profit by selling an amount corresponding to the purchase principal ultimately ends up holding only the number of coins (tokens) whose average purchase price is 0.
Therefore, there is absolutely no risk associated with holding it.
Have a good time.
thank you
--------------------------------------------------
- The big picture
The full-fledged upward trend is expected to begin when the price rises above 29K.
This is the section expected to be touched in the next bull market, 81K-95K.
#BTCUSD 12M
1st: 44234.54
2nd: 61383.23
3rd: 89126.41
101875.70-106275.10 (when overshooting)
4th: 13401.28
151166.97-157451.83 (when overshooting)
5th: 178910.15
These are points that are likely to encounter resistance in the future.
We need to see if we can break through these points upward.
Since it is thought that a new trend can be created in the overshooting zone, you should check the movement when this zone is touched.
#BTCUSD 1M
If the general upward trend continues until 2025, it is expected to rise to around 57014.33 and then create a pull back pattern.
1st: 43833.05
2nd: 32992.55
-----------------

Ripple Prepares for SEC Lawsuit Outcome, $XRP Surge Past $0.51Ripple ( CRYPTOCAP:XRP ) holders are debating the impact of the Financial Innovation and Technology for the 21st Century Act (FIT21) on the Securities and Exchange Commission (SEC) vs. Ripple lawsuit. The outcome of the lawsuit could affect Ripple's native token XRP's price and affect the payment remittance firm's institutional sales of XRP token. Attorney Bill Morgan, behind the X handle @Belisarius2020, explains that Ripple has prepared for the worst outcome in the lawsuit, a permanent injunction or a complete ban on sales of XRP tokens to its institutional clients in the US.
The US House approved the FIT21 bill, a major crypto legislation cleared by one of the chambers of Congress on Wednesday. As the bill makes passage to the Senate, CRYPTOCAP:XRP holders debate its impact on the longstanding legal battle between the US SEC and payment firm Ripple. In its lawsuit against Ripple, the financial regulator has asked for $2 billion in penalties and alleges unregistered securities sale (sale of XRP token) to institutional clients.
In its defense, attorney Bill Morgan explains that Ripple is prepared for the worst case scenario in the lawsuit. In the worst case, the court could order a permanent injunction (a complete ban) on CRYPTOCAP:XRP token sales to Ripple's institutional clients in the US. While typically this move could affect the payment firm's business, Attorney Morgan explains that Ripple continue offering its services and selling CRYPTOCAP:XRP to institutional clients overseas, under entities in different licensing regimes.
Technical analysis shows that Ripple broke past sticky resistance at $0.51 and is currently trading at $0.5303. The Moving Average Convergence Divergence, Relative Strength Index (RSI), and the Relative Strength Index (RSI) support a bullish narrative for the asset. If Ripple ( CRYPTOCAP:XRP ) successfully establishes itself above $0.5308, the next target is the April 22 and May 6 high of $0.5703.

XRPUSD 1WXRP ~ Updated
#XRP Still continuing to maintain this support line, it seems that big players continue to keep the price within this pattern, before pumping the price of CRYPTOCAP:XRP

XRP Symmetrical Triangle - Bull target $0.65, Bear target $0.42NOT FINANCIAL ADVICE
TL;DR #XRP Symmetrical Triangle, bull target $0.65, bear target $0.42
BINANCE:XRPUSDT has been trading in a symmetrical triangle for over 1 month. Well respected support trendline, with 4 clear touches.
Ascending triangle on the RSI, watch it because a break of the support or resistance trendlines there might be a leading signal of a subsequent price action breakout.
🟢 Bull case
Should we break the resistance trendline, my target will be the previous key area at $0.65.
Be careful at $0.57 because we had 2 previous fakeouts to that level.
Also watch the 200-day VWMA at $0.59 because it could offer some resistance on the way up.
🔴 Bear case
A break below the support trendline would most likely lead to a retest of $0.42, either for a triple bottom or further downside.

RIPPLE - After exiting from pennant, price can bounce upHi guys, this is my overview for XRPUSDT, feel free to check it and write your feedback in comments👊
A few moments ago price entered to falling channel, where it first reached resistance line and then continued to fall.
In channel, XRP broke $0.5360 level, which coincided with resistance area and declined until to support area.
After this, price made strong upward impulse to $0.5705 points, exiting from channel and breaking $0.5360 level.
But soon, Ripple turned around and in a short time declined to $0.4900 support level inside downward pennant.
Next, price bounced from support line of pennant and rose to resistance line and now tired to exit from this pattern.
In my mind, Ripple, after exiting from pennant, can make retest and then bounce up to $0.5440, breaking resistance level.
If this post is useful to you, you can support me with like/boost and advice in comments❤️

XRP HTF SPOT IDEAI feel XRP has bottomed at these key levels and an impactful move can be expected in the coming weeks and months with a potential 8-10X from the current prices to the bull run peak.

xrp forecast hello traders xrp will probably blow up in the comings months
wishyou good luck and good trading

$XRP #Ripples Trading IdeaXRP/USD (Ripples) still forming this huge and boring symmetrical triangle on a 1W timeframe. Full send after a breakout. After a clean breakout there is a probability to see $0.75; $0.935; $1.00 once again.

XRPUSDT#Ripple
Time frame of 4H
We can wait if the price reaches our area and enter with the comfort of capital management.

XRP touched 61.8 fib level, high chance of an upside bounce.XRP, perfectly touched support fib level at 61.8.
Expect some accumulation / net buying from this level.
Spotted at 0.4500
TAYOR.

CAN WE FINALLY START IT? XRPThis week is very important for the Ripple legal case, and some millions are moving from Ripple. Can this be a sign of an agreement with the SEC? Last year, a positive new has pumped the price of XRP to $0.9. This time, also considering the actual Bitcoin price, i think that an end at the case can teleport the XRP price to a new ATH. Personally, i am increasing my long exposure, keeping a safe stoploss below 0.25. Risk to reward (0.25 SL, 3.5 TP) is again extremely good

XRPUSDT - Dont Miss this Entry - Best Time to Buy XRP 🚀🚀Dear Respected Traders, we hope this communication finds you well.
we are convening a discussion focused on #XRPUSDT
On The 12H Time Frame📊:
XRP Moving Down Followed by Trendline, Now it's on Major Support level
In Case of Successful Breakout, Expecting a Bullish Move of 50% 🚀
#Bitcoin #Crypto #Ethereum #Cryptocurrency #CryptoTrading #BTCUSDT #ETHUSDT #ALTCONS #USDT CRYPTOCAP:BTC CRYPTOCAP:ETH CRYPTOCAP:USDT CRYPTOCAP:XRP #XRP CRYPTOCAP:BNB

XRP Update: Waiting Game Between $0.47 and $0.56!
XRPUSD is neutral int he daily chart and as long as it is trading between $0.4722 and $0.5603, XRP will lack the momentum.
A bullish break-out of $0.56 will lead to $0.6642, a very important levels in different timeframes.
If Bitcoin will decline, XRP has a potential to revisit $0.4722, the daily support zone.
Below $0.4722 zone, XRP is the bearish.

It is an important resistance🤨As you can see in the picture, we have a flag pattern, because we lost a log before forming the pattern, it is more likely to break from the bottom, but it can also break from the top. I do not trade with patterns.
I will take a look at it, personally, I will wait for the resistance of 0.4793 candle, then close, then I will open a position.
👨💻Any coin you want me to analyze, tell me in the comments and thank you very much for your time
⚠️Do capital management⚠️

Ripple can make correct move and then start to move upHello traders, I want share with you my opinion about Ripple. Looking at the chart, we can see how the price rebounded from the support level, which coincided with the buyer zone and support line to the resistance line. After this, the price made a little correction and then in a short time rose to the seller zone, breaking the resistance level, where it some time traded and later rebounded higher. Soon, XRP broke the resistance line, but at once turned around and started to decline inside the downward channel, where it later broke the support line and soon 0.5310 level too. After this, the price in a short time declined to the support line of the channel, after which rebounded and rose to the resistance line, but at once turned around and fell to the support level. A not long time ago, the price rebounded from the 0.4890 support level and in a short time rose higher resistance line, thereby exiting from the channel. So, at the moment, I think Ripple can make a correction move, after which turn around and start to grow. Therefore I set my target at 0.5225 points. Please share this idea with your friends and click Boost 🚀

$XRPok so hear me out
reclaiming the 200 on the weely once again ( chopping up enought folks along the way )
btc pair rsi looks reset with a cross
surely this has to move now ..

XRP ANALYSIS🚀#XRP Analysis : What Next ??💲💲
✅️As we can see that there was a formation of Descending Triangle Pattern in #XRP and given a breakout. A perfect retesting would indicate a bullish move 📈
🔰Current Price: $0.05200
🎯 Target Price: $0.07200
⚡️What to do ?
👀Keep an eye on #XRP price action. We can trade according to the chart and make some profits. Stay tuned for further analysis and stay updated with market sentiments and news.⚡️⚡️
#XRP #Cryptocurrency #TechnicalAnalysis #DYOR

EVERYTHING IS PUMPING, BUT NOT XRPThis is an old movie, every crypto is pumping but Ripple coin is still at the same price of years ago. I can honestly say that it's pretty frustrating (XRP is a part of my bags, but hopefully a little part) and i think it's worse for who has a big bag of XRP. It's a clear manipulation, some big players are keeping the price low for a reason. Probably we will see a mega pump as soon as the legal case will be over. I expect a new ATH this year, and i start taking profit there only. Looking at the chart, you can see that the price is ranging again above the main trendline. I expect an upside moves at least till the first resistance area i drawed
