OIL COURT SHORTHello everyone, for OIL I'm aiming for a bearish continuation to fill the daily lower FVG.
XTIUSD trade ideas

WTI On supportWTI is sitting on major support area. On smaller timeframe we can see a lower low here, and if it's going to bounce it should be from there. I expect a reversal pattern today with a continuation of the upside moves next week. Main target from the long $83

✅CRUDE OIL BULLISH SETUP|LONG🚀
✅CRUDE OIL keeps falling
But a rising support line
Is ahead so after the
Retest we will be expecting
A local bullish rebound
LONG🚀
✅Like and subscribe to never miss a new idea!✅

USOILA bearish flag pattern is a continuation pattern that typically occurs within a downtrend and indicates a temporary pause before the price resumes its downward movement. It is formed by two parallel trendlines – the first trendline represents the initial downward move (flagpole), and the second trendline represents a consolidation period (flag).
Here's how a bearish flag pattern typically forms:
1. **Initial Decline (Flagpole):** The price experiences a sharp downward move, forming the flagpole of the pattern. This decline is often the result of increased selling pressure.
2. **Consolidation (Flag):** After the initial decline, the price enters a period of consolidation where it trades within a narrow range. This consolidation phase forms the flag portion of the pattern. During this phase, the volume tends to decrease, indicating a temporary equilibrium between buyers and sellers.
3. **Breakout:** Following the consolidation phase, the price typically breaks below the lower trendline of the flag, signaling the continuation of the downtrend. The breakout is often accompanied by an increase in volume, confirming the bearish momentum.
Traders who recognize a bearish flag pattern may consider entering short positions (selling) when the price breaks below the lower trendline of the flag, anticipating further downward movement. They often place stop-loss orders above the upper trendline of the flag to manage risk in case the pattern fails.
It's important to note that while bearish flag patterns can be reliable indicators of downward continuation, like any technical pattern, they are not infallible and can fail. Therefore, it's essential to combine pattern recognition with other technical analysis tools and risk management strategies.

USOILBuying at support and selling at resistance is a classic strategy in technical analysis. It involves identifying key levels where the price of an asset has historically shown support (where it tends to stop falling) and resistance (where it tends to stop rising).
"Support" refers to a price level where a downtrend is expected to pause due to a concentration of demand or buying interest. Traders often look for buying opportunities when the price approaches or reaches a support level, expecting the price to bounce back up.
"Resistance," on the other hand, is a price level where an uptrend is expected to pause due to a concentration of selling interest or supply. Traders often look to sell or take profits when the price approaches or reaches a resistance level, anticipating a potential reversal or consolidation.
It's important to note that support and resistance levels are not always precise, and they can sometimes be breached temporarily before the price resumes its previous trend. Therefore, it's essential to use additional technical indicators or analysis methods to confirm potential entry and exit points.
Additionally, risk management is crucial when employing this strategy. Traders often use stop-loss orders to limit potential losses if the price breaks through support or resistance levels

USOIL BULLS WILL DOMINATE THE MARKET|LONG
Hello,Friends!
USOIL pair is trading in a local downtrend which we know by looking at the previous 1W candle which is red. On the 6H timeframe the pair is going down too. The pair is oversold because the price is close to the lower band of the BB indicator. So we are looking to buy the pair with the lower BB line acting as support. The next target is 81.69 area.
✅LIKE AND COMMENT MY IDEAS✅

usoil will further push upsideHello Traders
In This Chart XTIUSD HOURLY Forex Forecast By FOREX PLANET
today XTIUSD analysis 👆
🟢This Chart includes_ (XTIUSD market update)
🟢What is The Next Opportunity on XTIUSD Market
🟢how to Enter to the Valid Entry With Assurance Profit
This CHART is For Trader's that Want to Improve Their Technical Analysis Skills and Their Trading By Understanding How To Analyze The Market Using Multiple Timeframes and Understanding The Bigger Picture on the Charts

USOIL(H4)The price of will raise to acquire the 82.76$ and higerThe price of the oil is looking to get some uptrend target now after recent declines for the downtrend the price of oil is going to up on 82.76 and mor then

USOIL BREAKOUT ON CHANNEL INDICATING SELL-OFF USOIL confirmed a bearish breakout on the bullish channel created under the daily timeframe today. Here I personally expect to see a strong selling back towards the bottom level of support while we have a resistance holding down the pressure on top close to $80. Here we are expecting bearish momentum to be built towards the $70-67 target region.

🔥🔥🔥 USOIL Continue to buy✅✅✅The bottom of crude oil is about to appear. Now is the opportunity to buy. If you hold it for a long time, be prepared to reap huge profits. I will continue to provide accurate signals!
All my current transactions maintain 100% accuracy. If your account is still losing money, you can follow my signal trading and I will help your account make profits quickly!

Israel strikes Iran againIsrael retaliated against Iran overnight, which saw the price of WTI crude oil jump nearly 4.5% before giving up some of its gains. Per media reports, three large explosions were heard in the country's south, and the U.S. official announced Israel successfully hit some of the targets, something Iran was quick to deny. Without regard for damages, it is already apparent the two adversaries entered a spiral of reciprocatory aggression. Unless there is any form of effective mediation between the two sides (which is, by the way, unlikely), the conflict could enter a stage of regional war, with Israel potentially fighting on multiple fronts. Needless to say, this has enormous implications for the region, which is responsible for a significant portion of the global oil supply and, thus, influences oil prices (at this point, the only counterweights for the rising price of oil could be OPEC’s willingness to bring production online, protraction of global economic slowdown, and potentially more releases of oil from the Strategic Petroleum Reserves by the USA).
Technical analysis
Daily time frame = Bullish (stalling/turning neutral)
Weekly time frame = Bullish
Please feel free to express your ideas and thoughts in the comment section.
DISCLAIMER: This analysis is not intended to encourage any buying or selling of any particular securities. Furthermore, it should not be a basis for taking any trade action by an individual investor or any other entity. Your own due diligence is highly advised before entering a trade.

USOIL BUYPossible BUY for USOIL?
The market is currently testing a major level based on the higher TF.
We could possibly see a 4hr chart pattern about to form should the buyers be hold their position.
Let's see how this will play out.
Feel free to share your views

Possible reversal scenarioPrice at support level + formation of bullish shark pattern + RSI divergence ; I am waiting for a reversal chart pattern to confim trend reversal
PS never risk more than 2% of your capital per trade

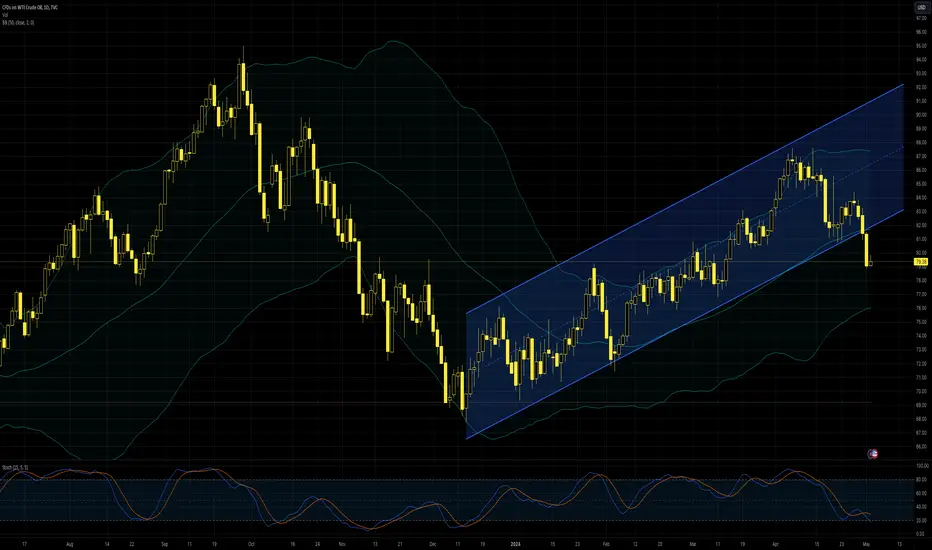
USOIL likely to find a floor around $78.50 for nowRising stocks of crude in the USA over recent weeks have put a hold to the commodity's long rally for now. However, recent rumours that the government's Strategic Petroleum Reserve might start to be refilled with prices of American light oil (Exness' symbol 'USOIL') below $79 seem to be a key reason for reluctance to push much below $80 a barrel as yet.
The rising channel has been broken clearly, which usually might be expected to open up the latest intraday low, around $76.50 from 11 March. That seems to be a challenge now both because of the fundamental (and political) situation and the price being in the value area between the 200 and 100 SMAs. The slow stochastic signals oversold, which adds to the overall impression that a pause or small bounce might be more likely than immediate continuation lower.
$80 is an important psychological zone and the area of early March's highs, so it's a likely resistance. The upcoming NFP probably won't have as big an impact on oil as gold, but it's important to watch for any major surprise while not forgetting the regular rig count on Friday night and next week's usual stock data. With no top-tier Chinese data due until 17 May's industrial production, the price might find a range around $78.50-$81.
This is my personal opinion which does not represent the opinion of Exness. This is not a recommendation to trade.
US-OIL AROUND A MASSIVE ZONEHello Traders and everyone, I am Hadi Karaali, Known as SNIPERS_FX
If you like the idea, do not forget to support with a like and follow.
US-OIL QUICK UPDATE. 📚
👉As we can see US-OIL price is still overall bullish making clean higher highs and higher lows trading inside this rising channel. 📚
👉Meanwhile, price started a new correction movement, and price approached our lower rising trendline lining up with our previous major highs, where we are interested in looking for new longs as a trend-following one.
And as per my trading plan, I will be zooming into lower time frame to be confirming our new impulse by activating any bullish reversal pattern. 📚
If you like this kind of analysis don't forget to like and follow
and as usual follow your trading plan and manage your risk.
Be patient and good luck!

Oil - Looking To Sell Pullbacks In The Short TermH4 - Bearish trend pattern
Lower lows
Until the strong resistance zone holds I expect the price to move lower further after pullbacks.


CRUDE OIL (WTI): Bearish Outlook & Breakout 🛢️
WTI Crude Oil formed a huge head and shoulders pattern on a daily.
With the release of the yesterday's fundamentals, the market dropped
and sharply violated its neckline and a solid rising trend line.
2 broken structures compose the expanding supply zone.
I will look for shorting from there,
anticipating a bearish continuation at least to 77.8 support.
❤️Please, support my work with like, thank you!❤️

Long opportunity After coming down for couple of weeks it seems like it could not beak the trend line. High probability to go high to grab BS liquidity.

CRUDE OIL Long From Support! Buy!
Hello,Traders!
CRUDE OIL is going down
But will soon hit a rising
Support line from where
We will be expecting
A bullish move up
Buy!
Like, comment and subscribe to help us grow!
Check out other forecasts below too!

1 Week Later and Oil is down 3.66%1 Week after the beggining of conflict between Israel and Iran in the middle east, Crude Oil is down 3.66%. Price began trending down all week and then on Thursday there was news of a bombing by Israel which caused a spike in Oil(3.5). This whole move was corrected and we are back to being down on the week. This opposes what I believed may play out this week as my thoughts were 1. Oil is a precious commodity and needed in War 2. The trend thus far this year is Bullish (we are up 13.82%) The market is instead going down and retraced this week. We are currently sitting on the Daily support level 81.23. Price action looks bearish on the Daily as we have a large top wick on the current candle.. moving into the next few weeks we will have a bearish weekly candle behind us that may aid in a descent towards the next Daily level 80.65 and beyond to the next weekly level 77.82. Also, this is in line with current risk-off market sentiment as Oil (Risk-on) is a commodity after all
Daily timeframe : The Daily timeframe retested Daily resistance (85.65) and we rejected.

Crude oil - A Bullish Reversal In Making- Crude oil had a retracement on daily time frame towards trendline.
- Price has retraced to 0.5-0.618 zone, a bullish momentum from here can break previous highs
- A bullish divergence has also formed with double bottom pattern on hourly time frame.
- Mulitple confluences make this a good buy opportunity for long.

🔥🔥🔥USOIL Continue to buy✅✅✅The fall in crude oil is a buying opportunity. The long-term target is 88-90 US dollars. You can follow my trading strategy in the long term.
All my current transactions maintain 100% accuracy. If your account is still losing money, you can follow my signal trading and I will help your account make profits quickly!
