XVSUSDTXVSUSDT is in reversal zone big bullish divergence shown in RSI.
Potentiall sign of reversal here.
we wait for further confirmation if it will break the last LH then we will execute our plan here,
XVSUSDT.P trade ideas

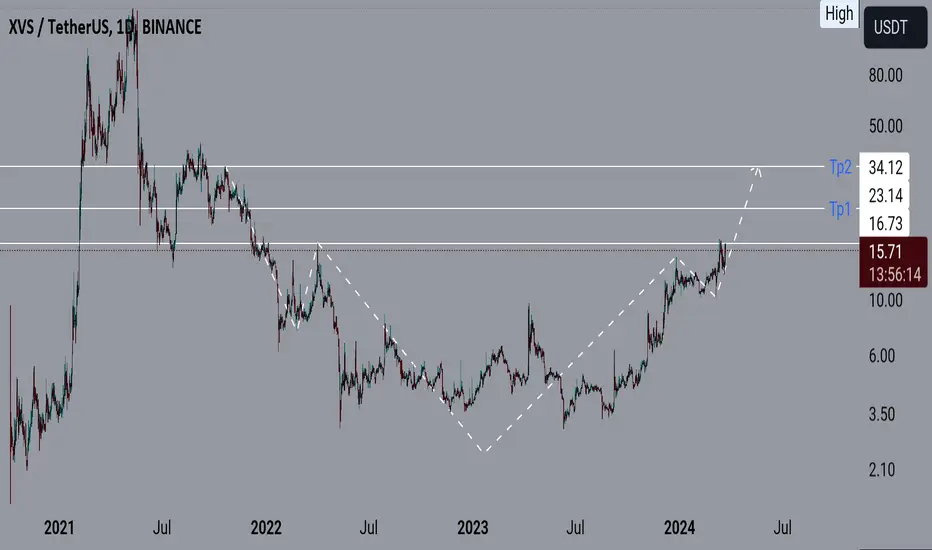
$$$XVSUSDT SYMMETRICAL TRIANGLE BREAKOUT@@@Dear Traders,
We are convening a discussion focused on #XVSUSDT
The Symmetrical Triangle Breakout Has Already Done ✅
So,I am Expecting a Bullish Move of 50-60% in coming days 🚀😉
#crypto #cryptocurrency #bitcoin #ethereum #blockchain #btc #cryptotrading #cryptonews #eth #cryptocurrencies #nft #bitcoinnews #bitcoins #trading #bitcoinmining #forex #binance #cryptoart #nfts#trading #forex #trader #investing #stocks #forextrader #stockmarket #daytrader #forextrading #invest #bitcoin #daytrading #cryptocurrency #crypto #investor #investment #forexsignals #nse #chartpattern #cedarforex #candlepatterns #learntrading #bseinstitute #shorttermtrade #bankniftytrading #stockmarketph #calloptions #mqlsignal #futuretrader #tradingmemes #chartpatterns #tradingview #tradinglife #tradinglifestyle #tradingstrategy #tradingtips #tradingplan #tradingsignals #tradingaccounts #tradingsignal #tradingforex #tradingsync #tradingroom #litecoin #ethereum #bitcoincash #cryptocurrencies #ripple #btc #bitcoinnews #bitcoinmining #blockchain #eth #bitcoin #bitcoins #coinbase #cryptocurrency #crypto #bitcointrading #dogecoin CRYPTOCAP:BTC CRYPTOCAP:ETH CRYPTOCAP:USDT CRYPTOCAP:PEPE CRYPTOCAP:DOGE NASDAQ:ALT

#XVS/USDT breaks the Diagonal Trendline in 4-Hour TF!#XVS/USDT breaks the Diagonal Trendline in 4-Hour TF!
Wait for a successful retest to open a long position. The local support level is PWH $9.665, and the local resistance level is PDH $10.13.

#XVS/USDT#XVS
The price is moving in a downtrend on a 4-hour frame
After bouncing from a major support area in green at the $9 level
We have a tendency to stabilize above the Moving Average 100
We have a downtrend on the RSI that is about to break higher
Entry price is 9.30
First goal 10.43
Second goal 11.94
Third goal 13.38

XVS/USDT I BUY SETUP✔︎📈 BINANCE:XVSUSDT SIGNAL
✔︎ENTRY : 16.16
🏓TARGETS :
✔︎T1 : 17.66
✔︎T2 : 19.76
✘STOP : 15.32
🚦Stop Trigger:
• If you make capital management: Stop is activated when one candle opening and closing
below the stop level of the same time frame of the signal.
• If you don't make capital management: Stop is direct without waiting for the candle to close.
💡Risk management :
• Enter the trade with 10% to 20% of your capital to reduce risk and save cash to enter other opportunities.
• Sell (25% to 50%) on (T1) and don't move your stop-loss.
• Sell 50% on (T2) and move your stop loss to the entry point.
• You are safe now, and the next 25% is up to you.
💡Reason for this trade:
This trade gives my trading system a sign of strength:
• My trading system is based on liquidity and reversal zones.
• When the liquidity is swept from one side under certain conditions, we will wait for the price on the other side.
The liquidity will attract the price like a magnet.
• the first side that has been swept:
1- failure swing point
2- reclaim volume profile after failure swing point
• Opposite side targets:
1- previous monthly high
2- monthly open
3- liquidity void
💡Entry setup
1- successful auction (AMT)
reclaim volume profile VAH
⚠️WARNING:
• I'm not a financial advisor.
• Do your own research (DYOR).

Long Trade Position XVSUSDTYou are allowed to start a trade when at least one candle closes above the entry point within fifteen minutes. Raise your analytical skills with the targets that I will give you and test your patience and strategy to reach price targets in the demo panel with virtual money. These exercises make you experience profit and loss with targets and stops, virtually in the real market and improve your analysis and personal strategy. Know your fear and greed and gradually control them so that your business is profitable and less harmful. I wish you happiness and wealth

XVSUSDT IDEAHello Traders Hope You Are Enjoying Our Analysis. Today We Will Discuss About XVS
(Update)
The Falling Wedge Breakout Has Done In Weekly Timeframe✅
Moving As Expected & Running In +95% Profit So Far✅
Still Moving Towards The Target⚡️

#XVS/USDT#XVS
The price has been moving in a symmetrical triangle since December 2023
The price adheres to the boundaries of that triangle beautifully
The price is expected to break the triangle upward
Current price 12.11
First goal 13.02
For the second goal 13.74
Third goal 14.77

XVS is bullish Buy XVS as spot in "DCA"
Hello everyone
I see a big head and shoulders pattern, it has already broken its resistance, after a little correction it will continue ✈️
$XVS broke out of range a day ago been chilling under vwap from ath
reclaim vwap or $17.14ish to go to $29 then $38.6ish
got some out of boredom so shall log off now to avoid messing up stuff

XVS UPDATE (1D)It seems to have risen with a bullish diametric and now we are at the end of wave G which is the last wave of this diametric.
After the end of the G wave, we expect a pullback towards the support areas
On the green range, you can look for a buy/long position.
Closing a daily candle below the invalidation level will violate the analysis
For risk management, please don't forget stop loss and capital management
When we reach the first target, save some profit and then change the stop to entry
Comment if you have any questions
Thank You

📈XVS Breaks Resistance: Eyes on $41.13 Target?🚀💎🔍XVS reacts positively at resistance of $12.86, signaling potential for further upside.
🔥The next target for XVS stands at $41.13, backed by support from Binance and promising project potential.
🚀For current holders, consider holding rather than taking profits, as XVS shows potential for greater gains amid bullish trends.
📊Increased volume post-resistance breakout suggests renewed interest from investors, potentially driving further price appreciation.
💥RSI nearing resistance at 80.34 warrants attention for potential overbought conditions and subsequent market reaction.
❌Consider Bitcoin's ATH and potential for correction, as XVS's technical analysis may be influenced by Bitcoin's movements.
🚨Exercise caution: Should XVS/BTC initiate a downturn alongside Bitcoin correction, consider exiting positions or implementing stop-loss orders for new entries.
🧠💼Just remember, jumping into trades too quickly before the main trigger can be risky. Always manage your money wisely and be aware of the risks involved.

XVS Cryptocurrency Analysis: Uptrend Continuation or Correction This analysis examines the current state of the XVS cryptocurrency and assesses its potential future direction.
Technical Analysis:
Battling Weekly Resistance: XVS is facing a significant hurdle at the weekly resistance level, which could determine the course of its future trend.
Escaping the Accumulation Box: The recent breakout from the daily accumulation box marked a notable 80% surge.
Insufficient Rest Calls for Correction: The current uptrend lacks sufficient retracement, which is typically necessary for sustained upward momentum.
Key Support and Resistance Levels:
Support: The blue trendline support acts as a critical barrier, with a breach potentially leading to a retracement towards the previous weekly resistance.
Resistance: The next weekly resistance level presents a significant obstacle for further upward movement.
RSI Indicator:
Overbought Territory: The RSI indicator is approaching the overbought zone, suggesting a potential correction.
Momentum Confirmation: A break above the overbought threshold could signal strong upward momentum.
Lower Timeframe Analysis:
4-Hour Timeframe: A more detailed analysis on the 4-hour timeframe provides a clearer picture of the current price action and potential support and resistance levels.
Conclusion:
The XVS cryptocurrency is at a critical juncture, with the outcome of the battle at the weekly resistance level determining its future direction. A correction is likely before further upward movement can occur. but considering decreasing the volume the out come might be different.
This analysis is for educational purposes only and should not be construed as financial advice. Always conduct your own research and employ sound risk management practices before trading.

xvs buy....ftm is good to buy. This coin has broken the resistance of its weekly time frame and can start its upward trend. And the price can move up to the next resistances. With capital management and stop loss, you can buy this coin.You should set your stop loss at the price of 10.16

XVSUSD 1WXVS ~ 1W 📈
#XVS Make purchases gradually from here. We estimate that this resistance will be broken in the near future. minimum target 20%++

XVSUSDT UPDATE$XVS
UPDATE
$XVS is on the way as predicted. Already 100%+ gain so far. Still getting a good volume.✍
This is how we are cashing market in VIP Room ✍
#XVS #XVSBTC #XVSUSDT #CRYPTO #SIGNALS #BNB

XVS/USDT Secondary trend September 9, 2023Logarithm. Time frame 3 days. Horizontal channel with a large step of 16.3 months.
Line chart of the zone for clarity.
Primary trend. Time frame 1 week.
XVS/USDT Main trend. 11 September 23

XVS/USDT Main trend. 11 September 23Logarithm. Time frame 1 week. The graph shows the entire trading history of this cryptocurrency Binance exchange. Now is a very important zone for the development of a further trend in the medium term.
Looks like this on a linear one.
Secondary trend. Horizontal channel zone. Time frame 3 days.

XVS Technical Analysis: Weekly and Daily TimeframesCoin Overview:
Venus (XVS) is the native token of the Venus Protocol, a decentralized lending and borrowing platform built on the Binance Smart Chain. Launched in August 2020, XVS holders benefit from governance rights and can participate in liquidity mining to earn rewards. Notably, XVS reached an all-time high of $147.02 in May 2021, but has since experienced significant price fluctuations. Its all-time low sits at $1.65, recorded in October 2020.
Weekly timeframe:
XVS bulls take charge, breaking the long-term downtrend.
A potential shift in momentum towards the upside.
Daily timeframe:
The consolidation phase will be between $11.45 and $13.28, following a mid-term uptrend.
This range could be interpreted as a healthy pullback after a bullish rally.
A decisive break above $13.28 could signal a continuation of the uptrend.
Current situation:
Recent sharp decline likely due to broader market volatility and a strong bearish candle on Bitcoin.
XVS can potentially return to its consolidation range once the market sentiment settles.
Support levels:
$10.5: A strong break below this level could expose XVS to further downside, with the next potential support at $7.58.
Important notes:
This analysis is for informational purposes only and should not be considered investment advice.
Always conduct your own research and employ proper risk management strategies before making any investment decisions.

XVSUSDT CRYPTO SIGNAL DONT MISS Xvsusdt best pair for scalping 10% to 20% on every signal dont miss my signals
for xvsusdt
buy now at $12.66
Takeprofit = $15.24 Reward 20%
Stop Lose = $11.44 Risk 10%
for more signals stay tuned i will provide you crypto signals

Technical analysis termsInclude relevant keywords that traders on Tradingview might search for.
Actionable and clear: Briefly mention the asset you're analyzing and the overall sentiment
Start with a high-level overview: Briefly summarize the key points of your analysis in the first paragraph.
Logical flow: Structure your analysis logically, transitioning smoothly between points.
Technical analysis terms: Use common technical analysis terms that Tradingview users understand (e.g., support levels, resistance levels, moving averages, RSI, etc.).
Fluent English: Ensure your sentences are grammatically correct and use natural-sounding business English.
Clear explanations: Briefly explain technical indicators and chart patterns for those who might not be familiar.
Conclusion:
Summarize key points: Restate the most important aspects of your analysis.
Call to action (optional): If applicable, suggest potential trading strategies based on your analysis.
Remember:
SEO optimization: While keywords are important, avoid keyword stuffing.
Tradingview specific: Use formatting and tools specific to Tradingview to enhance your analysis (e.g., charts, indicators, annotations).
Credibility: Briefly mention your qualifications or experience to establish credibility (optional).
Here's an example:
GBP/JPY: Price Rebound on the Horizon?
This technical analysis examines the GBP/JPY currency pair, highlighting potential bullish signals and upcoming price movements.
The GBP/JPY has been experiencing a downtrend recently, encountering resistance at the 140.00 level. However, several technical indicators suggest a potential reversal. The RSI indicator is currently hovering around 30, indicating oversold conditions. Additionally, the formation of a bullish engulfing pattern on the daily chart suggests a possible price reboun

$XVS GIANT bullish flag! Launching on Ethereum markets! BOOM!$XVS @venusprotocol is the biggest Lending ad Borrowing project on BNB Chain. At any moment will enter #ethereum chain. Has 1.6B TVL at BNB Chain.
This actual Uprising Triangle will probably take it to 33$ levels...3x!
Fundamentals are BRUTAL! NO way it can fail.
