YFI Trading TextbookSince September 2019, YFI has demonstrated beautiful examples of trading patterns.
H&S, volume divergence, RSI divergence, S/R flips, ascending triangles.
Study and learn from this.
YFIBTC trade ideas

YFI, YFIBTC! 1 Line says it all.1 Line says it all. This looks extremely bullish. YFI set to outperform btc once again? YFI exceeded the price of BTC again! We all know what happened the first time. It went to a high of 4.20 BITCOIN. BITCOIN! Not financial advice.


YFI Ready For 400% GainsYearn Finance (YFI) had a convincing breakout today against bitcoin which could signal a new bullish cycle for the coming weeks/months ahead. As you can see on the chart the 0.6 level has been supported three times over the past months including a longer lasting rounding bottom, which signals accumulation and provides us with an ideal setup. A cup and handle pattern was formed against the 1.0 resistance level and the MA200 was being challenged for several weeks. This resistance zone broke today with good volume which means we can look to enter a long position.
PLAN:
Buy on retest of previous resistance level at 1.0
TP1: 1.6
TP2: 2.2
TP3: 3.0
TP4: 4.2
That's not all. The pair made a higher low compared to the previous one back in september which is a strongly bullish signal that could indicate a new all time high well above 4.2
Goodluck.

YFI/BTC - Looking for a C waveDaily pattern sugests retesting the top side of the flat (in formation)

YFI / BTC - Price Action AnalysisThe rectangles highlight the areas of value which also serve as support/resistance.
This is where the bulls/bears have previously battled.
Keep an eye on the 1.1 level. Once this price breaks out of this level, the next target will be 1.6.

Yfi btc In daily chart we can clearly see a breakout and a new bullish cycle!
📍 my targets are mostly based on Fibonacci plus ichimoku and e-waves
📍 altcoins are going to pump right after bit coin's corrections; some of which like yfi that have bigger market caps need more time


#YFI#YFI/ BTC
#YFI/ USDT
Daily Timeframe
Valuable Project. Great Fundamental and Chart.
Can it happen?!

YFIBTC - another BCH-like pump in the making ?Hello all,
In the light of the recent very good breakouts against BTC (ETC,LTC,BCH etc), I would like to put your attention on another interesting pair.
This is the YFIBTC (Yearn.finance), which is looking pretty interesting.
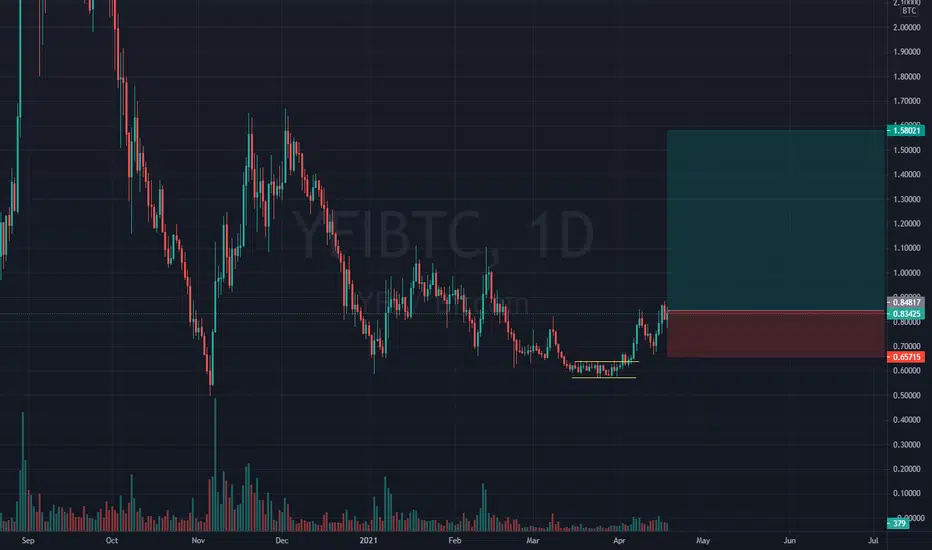
First we go do the 1D timeframe where we saw the coin bottoming around 0.58 at the end of March after an exhaustive downtrend and a triple bottom formation-like movement. Now YFI is using the 21-day EMA as a dynamic support to move towards the horizontal resistance at 1.
What I expect from here and have this as a trigger point, is a daily candle close above 1.05. This will open the door for a move towards the last visited high in the 1.5 area. This is an easy 50% move from the current price and is in line with the 160% Fibonacci extension from the last correction.
This idea is also supported by the 1W chart where the YFIBTC just climbed above the 21-day EMA and we all know that this is one of the most trusted trend reversal indicators.
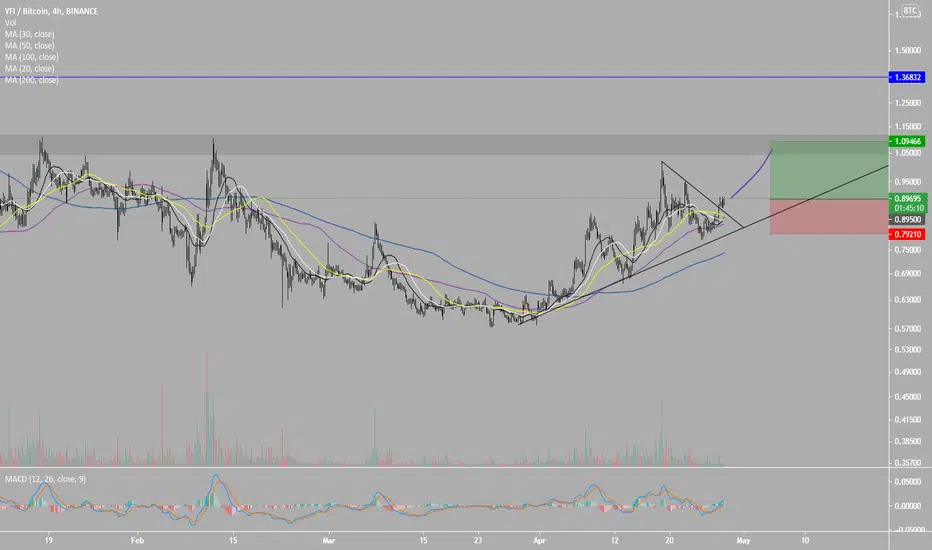
If we go down to the 4-hour chart, we can as well visualize the pretty stable uptrend like leading to the horizontal resistance

YFI just broke long term bear trend against BTC - $80k+ SoonYFI hit $40k when BTC was still under $12k. $7k in YFI was able to net you 4 BTC if you sold at the top. With DeFi so hot, YFI is making a bullish hammer reversal and should hit $80k+ next month.

Yearn.finance (YFI) Trading above MA200 & EMA200 = BullishAs usual, we have YFII and YFI moving together.
Here we are looking at the YFIBTC pair for Yearn.Finance.
Just yesterday prices managed to break and close above EMA200.
The day before, we say YFIBTC conquer MA200 which is the black line on the chart.
This is a strong bullish signal.
The MACD is on the bullish zone and the RSI super strong, very similar to YFIIBTC which is now available by visiting my profile.
The targets are the light green dashed lines on the chart.
The main support stands at EMA50 or 0.83791.
Above this level we are bullish.
Below it, we switch to bearish.
We are looking at higher highs and higher lows with YFIBTC easily printing additional growth.
Patience is key for sure...
Namaste.


YFIBTCHello to you all. Mars Signals team wishes you high profits at all times.
We are in 4-hour timeframe and this signal is 1 month. If the channel line is broken, you can enter the deal for the above purposes.
Warning: This is just a suggestion to you and we do not guarantee profits.
Wish you luck!

Load up on YFIYFI broke out of a long downtrend and appears to have already started its rise to the previous area of resistance. RTR is good and traders could be looking to go long on YFI with the stop loss just below the immediate trend line and mini area of support. Trade setup looking like a 5/5.
