Z25 BUY/LONG NOW READY! 1.20 TO 1.55 by SEPT 2021TICKER CODE: Z25
Company Name: YANLORD LAND
Industry: FINANCE. REAL ESTATE DEVELOPMENT
Position Proposed: BUY/LONG
Entry: 1.15-1.20 (NOW BUY READY)
1st Partial Take Profit: 1.55 (SEP 2021-NOV 2021)
2nd Partial Take Profit: 1.70 (EARLY 2022)
3rd Partial Take Profit: 1.95 (JUN 2022-AUG 2022)
4th Par
Yanlord Land Group Ltd.
No trades
Next report date
—
Report period
—
EPS estimate
—
Revenue estimate
—
−0.1926 USD
−465.21 M USD
4.98 B USD
531.35 M
About Yanlord Land Group Limited
Sector
Industry
CEO
Sheng Jian Zhong
Website
Headquarters
Singapore
Founded
1993
IPO date
Jun 22, 2006
Identifiers
2
ISIN SG1T57930854
Yanlord Land Group Ltd. is an investment holding company, which engages in the procurement of funds. It operates through the following segments: Property Development, Property Investment and Hotel Operations, and Others. The Property Development segment focuses on the development of residential, commercial, and other properties. The Property Investment and Hotel Operations segment includes leasing of properties to generate rental income and to gain from the appreciation in the value of the properties in the long term. It also operates hotels to generate accommodation service and related income. The others segment provides property management; ancillary services; business of mining and manufacture of die-cast precision parts and components; supply and installation of building materials; provision of system integration for broadcasting and multimedia; and others. The firm's projects include Yanlord Sunland Gardens, Yanlord Town, Yanlord Riverside City, and Yanlord Yunjie Riverside Garden. The company was founded by Sheng Jian Zhong in 1993 and is headquartered in Singapore.
Related stocks

Trading strategy for yanlord 1. Trend Analysis
Downtrend
2. Chart pattern analysis
Channel
3. Indicator Analysis
Weekly 50 SMA proved to be a strong
indicator for breakout( bullish)
RSI high coupled with strong vol (bullish)
MACD looks healthy with buyer
having a slight lead on seller.
4. Primary Trendline(Yellow) Analysi

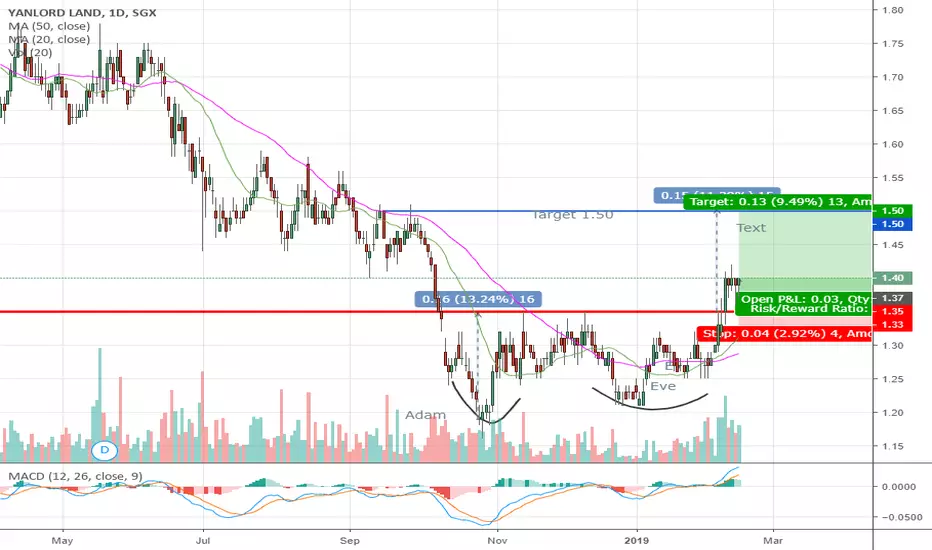
Yanlord - Adam and Eve reversal (bullish reversal)Adam and Eve is another of my favourite bullish reversal pattern. Yanloard broke above the neckline at 1.35 on 11 Feb and has been consolidating between 1.36 to 1.42 for the past week. The consolidation looks to be a bull flag and I am expecting it would be able to reach a price target of around 1.
See all ideas
Summarizing what the indicators are suggesting.
Oscillators
Neutral
SellBuy
Strong sellStrong buy
Strong sellSellNeutralBuyStrong buy
Oscillators
Neutral
SellBuy
Strong sellStrong buy
Strong sellSellNeutralBuyStrong buy
Summary
Neutral
SellBuy
Strong sellStrong buy
Strong sellSellNeutralBuyStrong buy
Summary
Neutral
SellBuy
Strong sellStrong buy
Strong sellSellNeutralBuyStrong buy
Summary
Neutral
SellBuy
Strong sellStrong buy
Strong sellSellNeutralBuyStrong buy
Moving Averages
Neutral
SellBuy
Strong sellStrong buy
Strong sellSellNeutralBuyStrong buy
Moving Averages
Neutral
SellBuy
Strong sellStrong buy
Strong sellSellNeutralBuyStrong buy
Displays a symbol's price movements over previous years to identify recurring trends.
Y
YLDG5206474
Yanlord Land (HK) Co., Limited 5.125% 20-MAY-2026Yield to maturity
5.33%
Maturity date
May 20, 2026
See all YLDGF bonds
AVWS
American Century ICAV - Avantis Global Small Cap Value UCITS ETF AccumUSDWeight
0.09%
Market value
882.97 K
USD
WSCR
UBS (Irl) ETF plc - UBS MSCI World Small Cap Socially Responsible UCITS ETF USDWeight
0.02%
Market value
151.37 K
USD
UIMS
UBS (Irl) ETF plc - UBS MSCI World Small Cap Socially Responsible UCITS ETF Accum USDWeight
0.02%
Market value
151.37 K
USD
Explore more ETFs
Frequently Asked Questions
The current price of YLDGF is 0.5248 USD — it has increased by 8.21% in the past 24 hours. Watch Yanlord Land Group Ltd. stock price performance more closely on the chart.
Depending on the exchange, the stock ticker may vary. For instance, on OTC exchange Yanlord Land Group Ltd. stocks are traded under the ticker YLDGF.
YLDGF reached its all-time high on Nov 2, 2007 with the price of 2.8000 USD, and its all-time low was 0.3222 USD and was reached on May 3, 2024. View more price dynamics on YLDGF chart.
See other stocks reaching their highest and lowest prices.
See other stocks reaching their highest and lowest prices.
YLDGF stock is 7.58% volatile and has beta coefficient of 1.35. Track Yanlord Land Group Ltd. stock price on the chart and check out the list of the most volatile stocks — is Yanlord Land Group Ltd. there?
Today Yanlord Land Group Ltd. has the market capitalization of 1.12 B, it has decreased by −0.89% over the last week.
Yes, you can track Yanlord Land Group Ltd. financials in yearly and quarterly reports right on TradingView.
Yanlord Land Group Ltd. is going to release the next earnings report on Mar 3, 2026. Keep track of upcoming events with our Earnings Calendar.
YLDGF net income for the last half-year is 54.39 M USD, while the previous report showed −397.05 M USD of net income which accounts for 113.70% change. Track more Yanlord Land Group Ltd. financial stats to get the full picture.
EBITDA measures a company's operating performance, its growth signifies an improvement in the efficiency of a company. Yanlord Land Group Ltd. EBITDA is 110.42 M USD, and current EBITDA margin is −3.45%. See more stats in Yanlord Land Group Ltd. financial statements.
Like other stocks, YLDGF shares are traded on stock exchanges, e.g. Nasdaq, Nyse, Euronext, and the easiest way to buy them is through an online stock broker. To do this, you need to open an account and follow a broker's procedures, then start trading. You can trade Yanlord Land Group Ltd. stock right from TradingView charts — choose your broker and connect to your account.
Investing in stocks requires a comprehensive research: you should carefully study all the available data, e.g. company's financials, related news, and its technical analysis. So Yanlord Land Group Ltd. technincal analysis shows the neutral today, and its 1 week rating is neutral. Since market conditions are prone to changes, it's worth looking a bit further into the future — according to the 1 month rating Yanlord Land Group Ltd. stock shows the neutral signal. See more of Yanlord Land Group Ltd. technicals for a more comprehensive analysis.
If you're still not sure, try looking for inspiration in our curated watchlists.
If you're still not sure, try looking for inspiration in our curated watchlists.