Falling wedge pattern on zillow!OptionsMastery:
🔉Sound on!🔉
📣Make sure to watch fullscreen!📣
Thank you as always for watching my videos. I hope that you learned something very educational! Please feel free to like, share, and comment on this post. Remember only risk what you are willing to lose. Trading is very risky but it can c
Zillow Group, Inc.
No trades
Key facts today
Next report date
—
Report period
—
EPS estimate
—
Revenue estimate
—
−0.14 USD
−112.00 M USD
2.24 B USD
47.53 M
About Zillow Group, Inc.
Sector
Industry
CEO
Jeremy Wacksman
Website
Headquarters
Seattle
Founded
2004
IPO date
Jul 20, 2011
Identifiers
3
ISIN US98954M1018
Zillow Group, Inc. engages in the provision of real estate and home-related information marketplaces on mobile and the web. The company was founded by Richard N. Barton and Lloyd D. Frink in December 2004 and is headquartered in Seattle, WA.
Related stocks

Zillow | Z | Long at $66.72Let me preface by saying that Zillow NASDAQ:Z may drop into the $50's in the near-term. The housing market news is all doom and gloom and the company's next earnings may show "weakness" (it's winter and interest rates are going lower this spring/summer). But, contrary to news headlines, the market

$Z will benefit from Trump's policy- Trump is dead focus on bringing affordability in US
- He is doing something historic like banning corporations from buying single family homes. This could unlock massive inventory in the market.
- On second front, he will appoint FED chair who would be lowering the interest rates.
- This will all

New Setup $Z, Daily, Short$Z on the daily chart shows a potential bounce on the ema50d as resistance.
The bearish trend is well consolidated and a catch is possible after the candle of today.

Z eyes on $68.80-69.75: Resistance even the Fib-Blind can SEEZillow has bounced into a major landmark of its lifetime.
Zone is defined by a Golden Covid and a Minor Genesis fib.
This has been tested from both sides many times already.
$ 68.60-69.75 is the exact resistance to watch.
$ 61.82-62.50 is the first support below to hold.
$ 76.18-7./00 is a good fir

Zillow Group, Inc. (Z) Expands Online Real Estate ReachZillow Group, Inc. (Z) operates one of the most popular online real estate marketplaces, connecting buyers, sellers, renters, and real estate professionals. Its platform offers home listings, market data, mortgage tools, and rental management solutions. Zillow’s growth is fueled by the digital trans

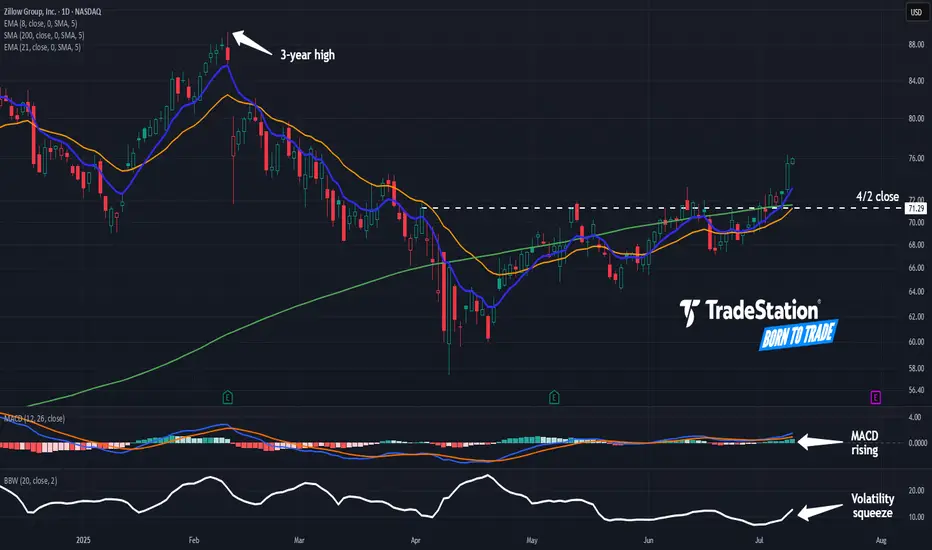
Zillow May Be Coming to LifeZillow has been in a tight range for months, but now it may be coming to life.
The first pattern on today’s chart is the April 2 close of $71.29. Z closed above it last week and is extending the move, which may confirm a breakout.
Second, prices pushed above the rising 200-day simple moving averag
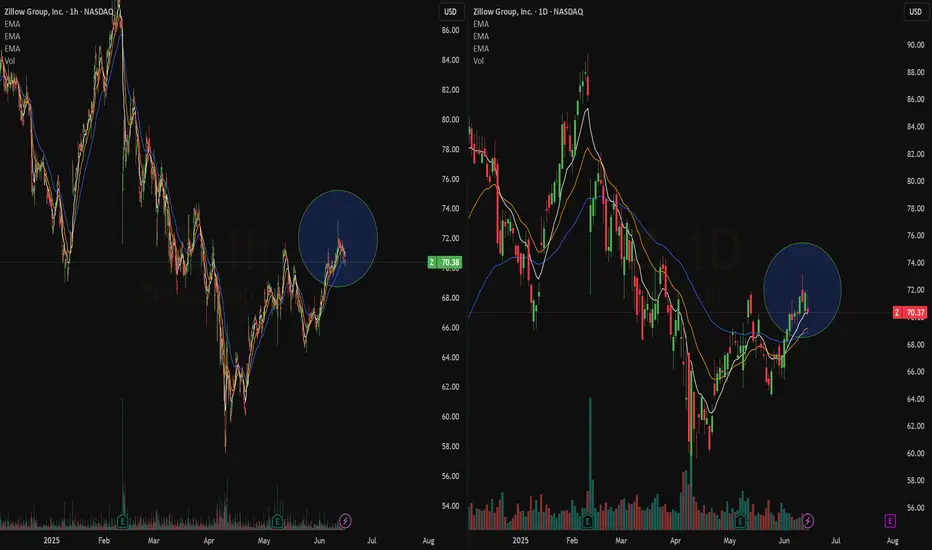
Quick View: $Z- Bullish Crossover on the daily chart, Bullish wave on the hourly chart.
- Some more volume would be good to support a new action to create new highs
What are your thoughts about my Zillow Analysis?I do believe Zillow will touch $98.04 then either push through, consolidate, or reverse. What are your thoughts?

2/11/25 - $z - I don't get it2/11/25 :: VROCKSTAR :: NASDAQ:Z
I don't get it
- 2.5% fcf yield "let's see"
- google search trends keep seeing lower highs, lower lows (trends.google.com)
- it's not like rates are going down... so there's some obvious friction in the system
- and really... 35x 2026 PE for this?
- i applaud the

See all ideas
Summarizing what the indicators are suggesting.
Neutral
SellBuy
Strong sellStrong buy
Strong sellSellNeutralBuyStrong buy
Neutral
SellBuy
Strong sellStrong buy
Strong sellSellNeutralBuyStrong buy
Neutral
SellBuy
Strong sellStrong buy
Strong sellSellNeutralBuyStrong buy
An aggregate view of professional's ratings.
Neutral
SellBuy
Strong sellStrong buy
Strong sellSellNeutralBuyStrong buy
Neutral
SellBuy
Strong sellStrong buy
Strong sellSellNeutralBuyStrong buy
Neutral
SellBuy
Strong sellStrong buy
Strong sellSellNeutralBuyStrong buy
Displays a symbol's price movements over previous years to identify recurring trends.
Frequently Asked Questions
The current price of ZG is 54.50 USD — it has increased by 2.89% in the past 24 hours. Watch Zillow Group, Inc. stock price performance more closely on the chart.
Depending on the exchange, the stock ticker may vary. For instance, on NASDAQ exchange Zillow Group, Inc. stocks are traded under the ticker ZG.
ZG stock has fallen by −14.31% compared to the previous week, the month change is a −17.06% fall, over the last year Zillow Group, Inc. has showed a −34.67% decrease.
We've gathered analysts' opinions on Zillow Group, Inc. future price: according to them, ZG price has a max estimate of 110.00 USD and a min estimate of 68.00 USD. Watch ZG chart and read a more detailed Zillow Group, Inc. stock forecast: see what analysts think of Zillow Group, Inc. and suggest that you do with its stocks.
ZG stock is 7.00% volatile and has beta coefficient of 0.58. Track Zillow Group, Inc. stock price on the chart and check out the list of the most volatile stocks — is Zillow Group, Inc. there?
Today Zillow Group, Inc. has the market capitalization of 13.00 B, it has decreased by −2.80% over the last week.
Yes, you can track Zillow Group, Inc. financials in yearly and quarterly reports right on TradingView.
Zillow Group, Inc. is going to release the next earnings report on Feb 10, 2026. Keep track of upcoming events with our Earnings Calendar.
ZG earnings for the last quarter are 0.44 USD per share, whereas the estimation was 0.43 USD resulting in a 2.89% surprise. The estimated earnings for the next quarter are 0.40 USD per share. See more details about Zillow Group, Inc. earnings.
Zillow Group, Inc. revenue for the last quarter amounts to 676.00 M USD, despite the estimated figure of 670.89 M USD. In the next quarter, revenue is expected to reach 650.35 M USD.
ZG net income for the last quarter is 10.00 M USD, while the quarter before that showed 2.00 M USD of net income which accounts for 400.00% change. Track more Zillow Group, Inc. financial stats to get the full picture.
No, ZG doesn't pay any dividends to its shareholders. But don't worry, we've prepared a list of high-dividend stocks for you.
As of Feb 6, 2026, the company has 6.86 K employees. See our rating of the largest employees — is Zillow Group, Inc. on this list?
EBITDA measures a company's operating performance, its growth signifies an improvement in the efficiency of a company. Zillow Group, Inc. EBITDA is 200.00 M USD, and current EBITDA margin is 3.53%. See more stats in Zillow Group, Inc. financial statements.
Like other stocks, ZG shares are traded on stock exchanges, e.g. Nasdaq, Nyse, Euronext, and the easiest way to buy them is through an online stock broker. To do this, you need to open an account and follow a broker's procedures, then start trading. You can trade Zillow Group, Inc. stock right from TradingView charts — choose your broker and connect to your account.
Investing in stocks requires a comprehensive research: you should carefully study all the available data, e.g. company's financials, related news, and its technical analysis. So Zillow Group, Inc. technincal analysis shows the sell today, and its 1 week rating is sell. Since market conditions are prone to changes, it's worth looking a bit further into the future — according to the 1 month rating Zillow Group, Inc. stock shows the sell signal. See more of Zillow Group, Inc. technicals for a more comprehensive analysis.
If you're still not sure, try looking for inspiration in our curated watchlists.
If you're still not sure, try looking for inspiration in our curated watchlists.