We’ve launched ‘Timelines’, a new way to understand the world’s biggest public companies
Dec 2, 2020
Fixed Range Volume Profile — a new drawing tool
Nov 17, 2020
Now It’s Even Easier to Customize Your Charts!
Oct 7, 2020
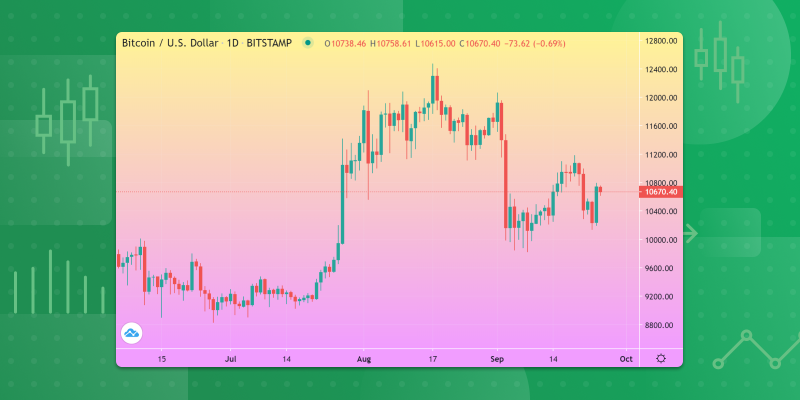
Live Life in Color With New Chart Gradients
Sep 29, 2020
Faster and more convenient. We’ve added new hotkeys for working with charts!
Sep 23, 2020
Introducing Our New Drawing Tool: Path
Sep 18, 2020
Hotkeys for the Bar Replay
Sep 11, 2020
Pre- / Post-Market Price Labels Are Now Available on TradingView Charts
Sep 4, 2020
Extended Rectangle Now Available
Sep 2, 2020
Charting Pre- and Post-Trade Periods
Aug 12, 2020
You can now display Bid and Ask Labels on the price scale and Bid and Ask Lines on the chart
Jul 30, 2020
Use an Input From Another Indicator With Your Strategy
Jul 16, 2020
Apply All Technical Analysis Tools to All Charts in the Workspace
Jul 10, 2020
Write Your Own Text Using the Rectangle Drawing Tool
Jul 9, 2020
Introducing Additional Bars on TradingView Charts
Jul 8, 2020
Indicator Templates With a Saved Symbol
Jul 7, 2020
Configuring Input Data and Other Improvements to Anchored VWAP
Jul 1, 2020
You Can Now Hide the Open Market Status on TradingView Charts
May 29, 2020
Anchored VWAP is on TradingView
May 28, 2020
Introducing the New Drawing Tool: Arrow Marker
May 22, 2020
Using Our Most Popular Drawing Tools Is Now Easier Than Ever
Apr 27, 2020