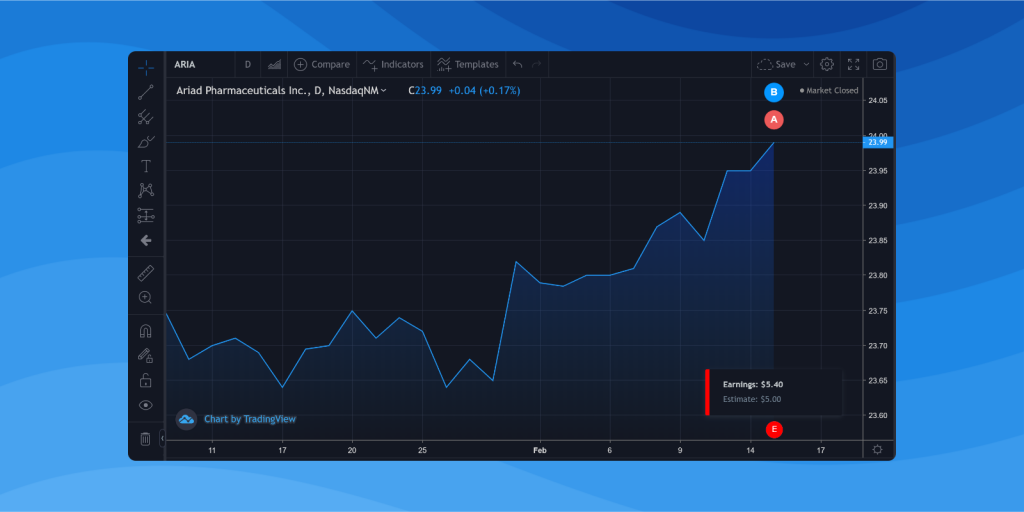
We are happy to announce the release of a new stable version of our Charting Library and Trading Terminal. We reduced its size, added new tools and languages as well as many other improvements and fixes.
What’s new in the charting library?
- The initial minimum downloadable size is reduced by 15% (from 772kb to 672kb).
Web pages with our charts on them are now loaded faster than ever!
- Support for indexing at 100 was added to price scales (Github issue #3391).
It is now easier to compare ticker symbols that have different ranges of values!
- Meet the new tool in our drawing panel – Info Line (Github issue #3920).
It will show you additional information while drawing: the price range, line angle, number of bars along with the time period.
- We are now supporting more languages (Github issue #3335).
Added support for semitic languages (Arabic & Hebrew) that are written from right to left.
- We’ve added an API that enables data exporting from the chart (Github issue #3152).
Add more ways to analyze data for your users!
- The chart legend is now showing bar change percentage (Github issue #2120).
All important details are now displayed in a single place.
- The number of bars requested has been increased in order to perform a more accurate calculation (Github issue #1362).
Indicators for a given time period are now calculated accurately, regardless of the number of bars displayed on the chart.
Other improvements:
- Added the ability to zoom in based on the API request (Github issue #3739).
- Added events of changing indicator properties (Github issue #3736).
- Added the ability to limit the scrolling of the chart to available data area (Github issue #3597).
- The method of obtaining the visible range of the chart now returns the data in UTC, regardless of the timezone selected on the chart (Github issue #3173).
- An obsolete TradingView.onready API method has been removed (Github issue #3162).
- Added notifications about the incorrect use of symbol information (Github issue #3329).
- Added Australia, Perth (UTC + 8) timezone (Github issue #3906).
- Added base line to percentages at 0% & indexed-to-100 at 100 (Github issue #3907).
- Added the Only show the value of the source of the chart option for the following chart types – line, area and base line (Github issue #3909).
- Added the ability to save the visible range of data when changing chart size (Github issue #3921).
- Added an important security improvement (Github issue #3699).
Issues fixed:
- Fixed an issue with chart autoscaling (linear display series) (Github issue #3908).
- Fixed an issue with displaying time scales when switching from daily to 1 min time intervals (Github issue #3828)
- Restored the correct way of obtaining visible price range (Github issue #3774).
- Fixed the deactivation of uppercase_instrument_names parameter (Github issue #3746).
- Fixed the display of data on an indicator in the console when using widget.save (Github issue #3623).
- Fixed an issue with the overriding of chart colors (Github issue #3557).
- Fixed an issue with the use of Pivot Point indicator (Github issue #3521).
- Fixed the display of bars on a monthly timeframe (Github issue #3510).
- Restored the correct return to the interface settings after the reinitialization (Github issue #3479).
- Fixed a bug that was causing unexpected redirection (Github issue #3299).
- Fixed container removal error in Vue.js & Angular 5 (Gap issue #3297).
- Fixed an issue that was creating a gap between the chart and an indicator (Github issue #3246).
- Added the option to save custom theme settings when changing themes (Github issue #3232).
- Fixed the display of the series on the chart (automatic scaling after loading the indicator template) (Github issue #3229).
- Fixed the market status update issue during the start/end of the session (Github issue #3122).
- Returned the ability to turn off the display of market status on the chart (Github issue #3600).
- Fixed the display of placeholder in the “Compare / Add Symbol” dialog (Github issue #2966).
- Fixed an issue that was causing the method of obtaining visible range of the chart to work incorrectly (Github issue #2757).
- Fixed an issue with the event of adding a new list of tracked symbols when calling Save As (Github #2654).
- Fixed an issue with the Parabolic SAR indicator (input data) (Github issue #2205).
- Fixed the issues with using drawing tools on Samsung mobile devices (Github issue #984).
- The process of finding the library container when accessing through an API has been optimized in order to avoid problems when working with frameworks and iframe (Github issue #3297).
What’s new in the Trading Terminal?
- Apply to all button has been added to the settings dialog (Github issue #3298).
This magic button allows you to customize all chart layouts in one click!
- Added a flag that allows you to enable/disable support of stop orders (Github issue #2181).
- Fixed a symbol request error when using names instead of tickers – Renko, Kagi, Line break, Base line and Point & Figure (Github issue #3602).
- Restored the display of DOM and trading panel (Github issue #3312).
