AUD/USD Elliott Wave Analysis – Rising Diagonal Pattern Near Completion
Overview
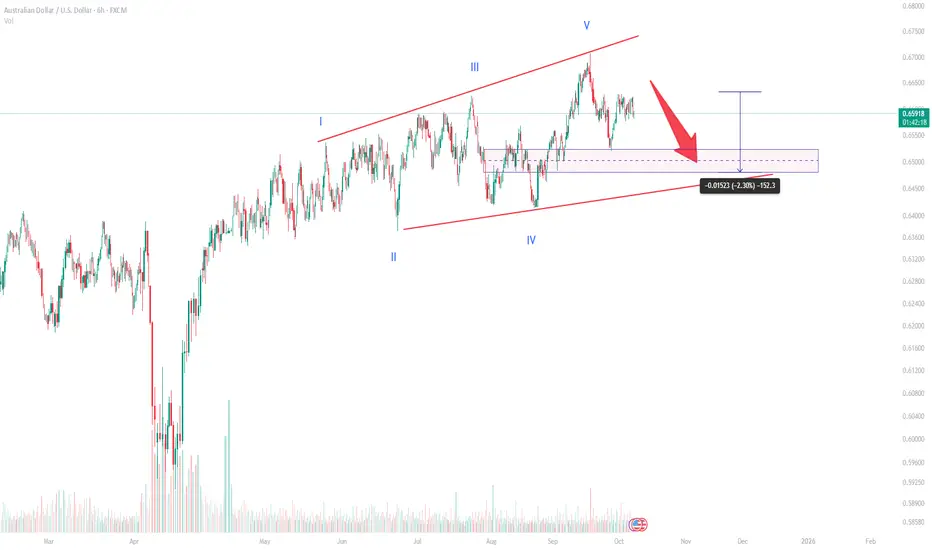
The AUD/USD pair has formed a clear ending diagonal pattern, signaling potential exhaustion of the current bullish trend. This structure, often seen at the final stage of an impulse wave, suggests that a corrective phase may soon follow. The diagonal appears complete with all five internal waves labeled (I-V), indicating that the market might be preparing for a deeper pullback.
Technical Analysis
According to the Elliott Wave structure visible on the 6-hour chart, AUD/USD completed its fifth and final wave near the 0.67 region. The wedge pattern is now narrowing, with bearish divergence hinting at weakening bullish momentum.
Wave Structure:
Wave I started the diagonal formation, initiating the rising trend.
Waves II and IV acted as corrections, forming higher lows.
Wave V extended slightly but failed to make a strong breakout, suggesting exhaustion.
The price currently trades near 0.6560, with a potential retracement zone between 0.6450 and 0.6500. This range coincides with a strong demand zone and the lower boundary of the diagonal pattern. A pullback into this area could complete the corrective (A)-(B)-(C) structure before the next major directional move.
Key Levels
Support Zone: 0.6450 – 0.6500
Immediate Resistance: 0.6650 – 0.6680
Breakout Confirmation: A sustained break below 0.6450 could confirm the end of the diagonal and open the door toward 0.63 in the medium term.
Invalidation: A breakout above 0.67 would invalidate the bearish correction scenario.
Market Outlook
The diagonal’s completion suggests that the pair may enter a short-term correction phase. However, traders should monitor price action near the support area before confirming the next trend direction. If buyers defend the 0.6450 zone, a rebound toward 0.6650 is likely. Conversely, a clear break below the wedge would strengthen bearish momentum.
Given the overall wave count, the market is likely in transition between an impulsive and a corrective phase. Patience is crucial at this stage, as the next few sessions will determine whether the larger uptrend resumes or a deeper retracement unfolds.
Overview
The AUD/USD pair has formed a clear ending diagonal pattern, signaling potential exhaustion of the current bullish trend. This structure, often seen at the final stage of an impulse wave, suggests that a corrective phase may soon follow. The diagonal appears complete with all five internal waves labeled (I-V), indicating that the market might be preparing for a deeper pullback.
Technical Analysis
According to the Elliott Wave structure visible on the 6-hour chart, AUD/USD completed its fifth and final wave near the 0.67 region. The wedge pattern is now narrowing, with bearish divergence hinting at weakening bullish momentum.
Wave Structure:
Wave I started the diagonal formation, initiating the rising trend.
Waves II and IV acted as corrections, forming higher lows.
Wave V extended slightly but failed to make a strong breakout, suggesting exhaustion.
The price currently trades near 0.6560, with a potential retracement zone between 0.6450 and 0.6500. This range coincides with a strong demand zone and the lower boundary of the diagonal pattern. A pullback into this area could complete the corrective (A)-(B)-(C) structure before the next major directional move.
Key Levels
Support Zone: 0.6450 – 0.6500
Immediate Resistance: 0.6650 – 0.6680
Breakout Confirmation: A sustained break below 0.6450 could confirm the end of the diagonal and open the door toward 0.63 in the medium term.
Invalidation: A breakout above 0.67 would invalidate the bearish correction scenario.
Market Outlook
The diagonal’s completion suggests that the pair may enter a short-term correction phase. However, traders should monitor price action near the support area before confirming the next trend direction. If buyers defend the 0.6450 zone, a rebound toward 0.6650 is likely. Conversely, a clear break below the wedge would strengthen bearish momentum.
Given the overall wave count, the market is likely in transition between an impulsive and a corrective phase. Patience is crucial at this stage, as the next few sessions will determine whether the larger uptrend resumes or a deeper retracement unfolds.
Trade closed: target reached
💼 Professional market insights & charts:
cakirinsights.com/
cakirinsights.com/
Disclaimer
The information and publications are not meant to be, and do not constitute, financial, investment, trading, or other types of advice or recommendations supplied or endorsed by TradingView. Read more in the Terms of Use.