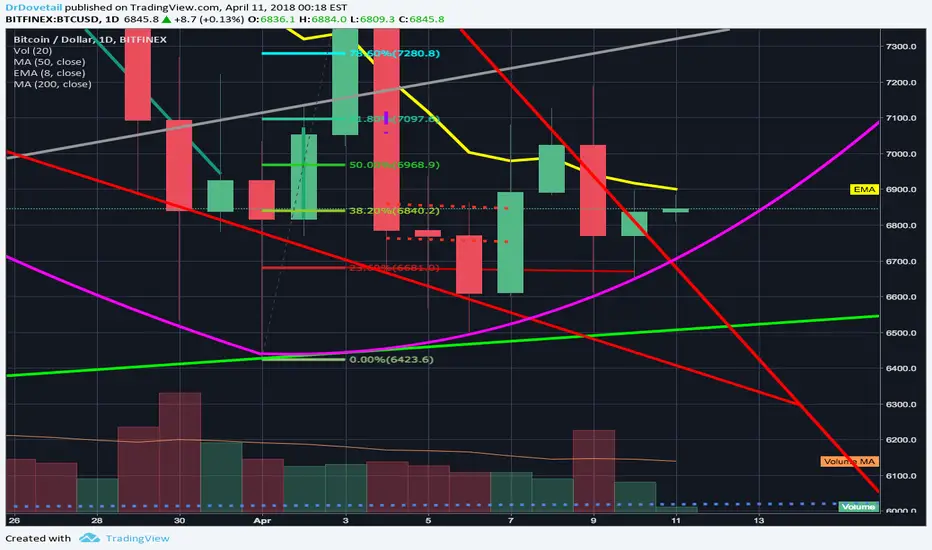
A quick update we are reaching a pivotal point as we approach the apex of this falling wedge as well as continuing to follow this potential eve bottom quite precisely. You can see here on the 1 day chart we are currently up outside the falling wedge on the current 1 day candle...like the previous 1day candle, it is finding strong resistance at the t line(in yellow) However this candle has a double reinforced support of both the eve bottoms trendline, and the 23.60% fibonacci retracement line(in red at 6680). This retracement line has served as both very strong support and very strong resistance over the last week or so as the eve bottom has been slowly rounding out and making its turn back upwards, and now that we are above that fib line as well as having it double reinforced with the eve trendline, should prove to provide enough support to keep the price action up out of the falling wedge...which should result in a big bullish volume spike in the coming few days. It could by chance drop back down into the falling wedge and wait until closer to the end of it to breakout which would invalidate and eve bottom but instead likely result in a more traditional standard double bottom considering the falling wedge ends at the exact same pricepoint as february's low....either way we have good odds in favor of one of the 2 double bottoms so I will side with that probability while at the same time of course being prepared for the exact opposite outcome should it occur, where if we dip and stay below 6400 we can trigger a massive head and shoulders that could take us down as far as the 3,000s(less likely in my opinion) If we can find a way to close above the tline on this current candle I'd say we will likely see a big bullish volume spike to confirm the breakout on the follow up candle..for now we shall wait and see.
Disclaimer
The information and publications are not meant to be, and do not constitute, financial, investment, trading, or other types of advice or recommendations supplied or endorsed by TradingView. Read more in the Terms of Use.
Disclaimer
The information and publications are not meant to be, and do not constitute, financial, investment, trading, or other types of advice or recommendations supplied or endorsed by TradingView. Read more in the Terms of Use.