🟢 Overview
Market seasonality refers to recurring, quantifiable patterns in asset price movements that appear consistently across different time periods. Rather than mystical predictions, these patterns reflect systematic behavioral trends, institutional flows, and market structures that have persisted across years, and in some cases, centuries, of trading history.
🟢 How Seasonality Works
Seasonality analysis examines historical price data to identify months or periods when specific assets have historically shown strength or weakness. The approach replaces emotion-driven decision-making with probabilistic insights based on historical performance across complete market cycles, including bull markets, bear markets, and periods of consolidation. By quantifying these patterns, traders and investors can identify potential statistical edges in their execution timing.
🟢 Evidence Across Asset Classes
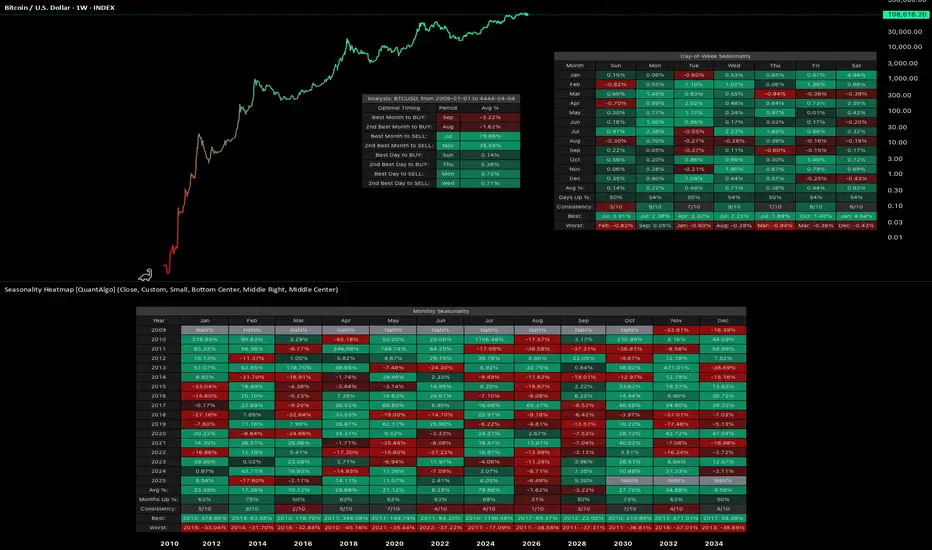
1. Bitcoin BTCUSD

Since the development of futures markets and institutional participation, Bitcoin has demonstrated notable seasonal patterns with measurable statistical significance. September has averaged -1.92% returns, establishing it as the weakest month. In contrast, October has emerged as the strongest performer with average returns of +21.59% and a 90% positive occurrence. This level of consistency suggests a robust statistical edge rather than random variation.
Day-of-week patterns in modern Bitcoin are relatively tight, with differences ranging from 0.07% to 0.50%. Monday edges out as the optimal day for selling positions. However, these daily patterns offer considerably less statistical significance than the monthly seasonality effects, as the weekly variations have smoothed out compared to Bitcoin's earlier history.
2. Ethereum ETHUSD

Ethereum displays even more pronounced seasonal variations with stronger directional bias. September has been particularly challenging, averaging -10.04% returns and showing negative performance in eight out of ten years, representing an 80% probability of decline. June also demonstrates weakness at -7.20% average returns. Conversely, May stands out as the strongest month with average returns of +34.97%, positive 70% of the time across the dataset. May has delivered positive returns in seven out of ten years, providing a statistically meaningful edge.
Day-of-week analysis reveals differences of 0.2% to 0.6%, with Wednesday edging out slightly for selling and Tuesday showing marginally better performance for buying. However, these daily variations lack statistical significance when compared to the dramatic monthly patterns, representing more noise than actionable alpha for systematic strategies.
3. S&P 500 SPX
SPX


With over 50 years of data dating back to 1971, the S&P 500 demonstrates the famous "September Effect." September averages -0.90% returns and has been negative with notable consistency, establishing statistical significance through sheer sample size. November, capturing typical year-end institutional positioning, averages +1.73% with positive performance 70% of the time. April comes in second at +1.44% average returns. The persistence of these patterns across five decades provides robust evidence of systematic seasonal effects even in highly efficient markets.
Day-of-week effects in the S&P 500 are minimal, ranging from just 0.01% to 0.07%. Monday shows a slight negative drift at -0.01%, while Wednesday edges up 0.07%. These intraday variations fall well within normal variance and lack statistical significance for execution timing. For this index, monthly patterns provide the primary source of seasonal alpha.
4. Gold XAUUSD


Perhaps most compelling is gold's seasonal data spanning nearly 200 years since 1832, offering an extraordinarily large sample size for statistical validation. January shows the strongest average returns at +0.99% and has been positive 80% of the time, representing a highly reliable statistical edge. June represents the weakest period at -0.18% average returns, with October also serving as a potential entry point at just 0.05% average returns. July comes in as the second-best month at +0.79%. The consistency of these patterns across multiple centuries, world events, and monetary system changes indicates deeply embedded structural inefficiencies in market dynamics.
Day-of-week patterns in gold are similarly minimal. Thursday edges out at 0.09% for optimal selling, while Sunday shows 0.01% for buying opportunities. Like the S&P 500, gold trades predominantly on monthly patterns rather than daily variations, with intraweek effects lacking statistical significance.
🟢 TL;DR
1. BitcoinBTCUSD: Accumulate during September weakness (-1.92%), sell into October strength (+21.59%). October has been positive 9 out of 10 years since 2015, representing a 90% positive occurrence. Day of week: Sunday dips for buying, Monday for selling.
2. EthereumETHUSD: Summer pain is real. September (-10.04%) and June (-7.20%) are buying opportunities. May (+34.97%) is the monster month historically, positive 7 out of 10 years (70% positive frequency). Day of week: Tuesday buying, Wednesday selling, but minimal statistical significance.
3. S&P 500SPX: The September Effect demonstrates statistical significance (-0.90% average over 50+ years). November (+1.73%) captures the year-end rally with 70% positive occurrence. Day of week effects are negligible (0.01-0.07%) and lack statistical significance.
4. GoldXAUUSD: January strength (+0.99%, 80% positive frequency) after June weakness (-0.18%). Nearly 200 years of data backing these patterns provides exceptional statistical validation. Day of week: Sunday buying, Thursday selling, but minimal differences.
🟢 Final thoughts
Ultimately, seasonality analysis does not guarantee future results, but it provides a framework for probabilistic decision-making with quantifiable statistical edges. Rather than attempting to time markets based on sentiment or short-term price movements, systematic traders and investors can align decisions with periods that have historically shown consistent strength or weakness with statistical significance. This approach is particularly valuable for planning entry and exit points, portfolio rebalancing, and managing position sizing within a rules-based framework.
Notably, while day-of-week patterns exist in some assets, monthly seasonality tends to provide more significant and statistically reliable edges across most markets. The data suggests that seasonal patterns persist even in highly efficient markets, driven by recurring institutional behaviors, tax considerations, and structural market dynamics that create exploitable inefficiencies.
Market seasonality should be viewed as one analytical tool within a comprehensive quantitative framework, not a guarantee of performance, but a method to incorporate historical probabilities and statistical edges into systematic investment decisions.
This isn't about perfect timing either. It's about leveraging statistical edges based on historical probabilities instead of emotion. You'll still be wrong sometimes, but less often when operating with decades of data and quantifiable patterns rather than sentiment alone.
👉 Try the Seasonality Heatmap indicator yourself on TradingView to explore these patterns across different assets and timeframes.
*This analysis is for educational purposes only and is not financial advice. Past performance does not guarantee future results. Always do your own research and consult with a qualified financial advisor before making investment decisions.
Market seasonality refers to recurring, quantifiable patterns in asset price movements that appear consistently across different time periods. Rather than mystical predictions, these patterns reflect systematic behavioral trends, institutional flows, and market structures that have persisted across years, and in some cases, centuries, of trading history.
🟢 How Seasonality Works
Seasonality analysis examines historical price data to identify months or periods when specific assets have historically shown strength or weakness. The approach replaces emotion-driven decision-making with probabilistic insights based on historical performance across complete market cycles, including bull markets, bear markets, and periods of consolidation. By quantifying these patterns, traders and investors can identify potential statistical edges in their execution timing.
🟢 Evidence Across Asset Classes
1. Bitcoin
Since the development of futures markets and institutional participation, Bitcoin has demonstrated notable seasonal patterns with measurable statistical significance. September has averaged -1.92% returns, establishing it as the weakest month. In contrast, October has emerged as the strongest performer with average returns of +21.59% and a 90% positive occurrence. This level of consistency suggests a robust statistical edge rather than random variation.
Day-of-week patterns in modern Bitcoin are relatively tight, with differences ranging from 0.07% to 0.50%. Monday edges out as the optimal day for selling positions. However, these daily patterns offer considerably less statistical significance than the monthly seasonality effects, as the weekly variations have smoothed out compared to Bitcoin's earlier history.
2. Ethereum
Ethereum displays even more pronounced seasonal variations with stronger directional bias. September has been particularly challenging, averaging -10.04% returns and showing negative performance in eight out of ten years, representing an 80% probability of decline. June also demonstrates weakness at -7.20% average returns. Conversely, May stands out as the strongest month with average returns of +34.97%, positive 70% of the time across the dataset. May has delivered positive returns in seven out of ten years, providing a statistically meaningful edge.
Day-of-week analysis reveals differences of 0.2% to 0.6%, with Wednesday edging out slightly for selling and Tuesday showing marginally better performance for buying. However, these daily variations lack statistical significance when compared to the dramatic monthly patterns, representing more noise than actionable alpha for systematic strategies.
3. S&P 500
With over 50 years of data dating back to 1971, the S&P 500 demonstrates the famous "September Effect." September averages -0.90% returns and has been negative with notable consistency, establishing statistical significance through sheer sample size. November, capturing typical year-end institutional positioning, averages +1.73% with positive performance 70% of the time. April comes in second at +1.44% average returns. The persistence of these patterns across five decades provides robust evidence of systematic seasonal effects even in highly efficient markets.
Day-of-week effects in the S&P 500 are minimal, ranging from just 0.01% to 0.07%. Monday shows a slight negative drift at -0.01%, while Wednesday edges up 0.07%. These intraday variations fall well within normal variance and lack statistical significance for execution timing. For this index, monthly patterns provide the primary source of seasonal alpha.
4. Gold
Perhaps most compelling is gold's seasonal data spanning nearly 200 years since 1832, offering an extraordinarily large sample size for statistical validation. January shows the strongest average returns at +0.99% and has been positive 80% of the time, representing a highly reliable statistical edge. June represents the weakest period at -0.18% average returns, with October also serving as a potential entry point at just 0.05% average returns. July comes in as the second-best month at +0.79%. The consistency of these patterns across multiple centuries, world events, and monetary system changes indicates deeply embedded structural inefficiencies in market dynamics.
Day-of-week patterns in gold are similarly minimal. Thursday edges out at 0.09% for optimal selling, while Sunday shows 0.01% for buying opportunities. Like the S&P 500, gold trades predominantly on monthly patterns rather than daily variations, with intraweek effects lacking statistical significance.
🟢 TL;DR
1. Bitcoin
2. Ethereum
3. S&P 500
4. Gold
🟢 Final thoughts
Ultimately, seasonality analysis does not guarantee future results, but it provides a framework for probabilistic decision-making with quantifiable statistical edges. Rather than attempting to time markets based on sentiment or short-term price movements, systematic traders and investors can align decisions with periods that have historically shown consistent strength or weakness with statistical significance. This approach is particularly valuable for planning entry and exit points, portfolio rebalancing, and managing position sizing within a rules-based framework.
Notably, while day-of-week patterns exist in some assets, monthly seasonality tends to provide more significant and statistically reliable edges across most markets. The data suggests that seasonal patterns persist even in highly efficient markets, driven by recurring institutional behaviors, tax considerations, and structural market dynamics that create exploitable inefficiencies.
Market seasonality should be viewed as one analytical tool within a comprehensive quantitative framework, not a guarantee of performance, but a method to incorporate historical probabilities and statistical edges into systematic investment decisions.
This isn't about perfect timing either. It's about leveraging statistical edges based on historical probabilities instead of emotion. You'll still be wrong sometimes, but less often when operating with decades of data and quantifiable patterns rather than sentiment alone.
👉 Try the Seasonality Heatmap indicator yourself on TradingView to explore these patterns across different assets and timeframes.
*This analysis is for educational purposes only and is not financial advice. Past performance does not guarantee future results. Always do your own research and consult with a qualified financial advisor before making investment decisions.
🎁🎄 Christmas SALE 50% Off with code XMAS50 (ends Dec 28) at whop.com/quantalgo/
📩 DM if you need any custom-built indicators or strategies.
📩 DM if you need any custom-built indicators or strategies.
Related publications
Disclaimer
The information and publications are not meant to be, and do not constitute, financial, investment, trading, or other types of advice or recommendations supplied or endorsed by TradingView. Read more in the Terms of Use.