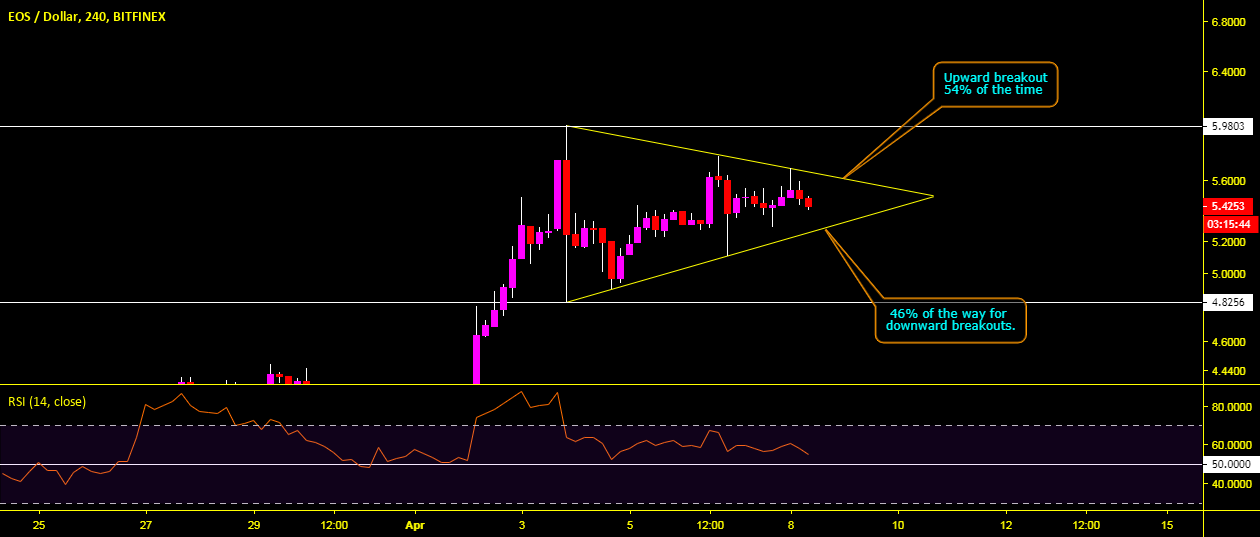
Mixed move signal, as price has maintained its trend to the upside. The BTCUSD price has gradually formed the same chart pattern which we analysed on EOSUSD chart called the SYMMETRICAL TRIANGLE CHART PATTERN.
CHECK :
 The rules to follow when charting the pattern are all shown on the above link. we always advice traders to wait for a proper breakout( which is currently happening) before taking a long position.
Still the 4hours time frame, we still see a big C-CLAMP( TK DISEQUILIBRIUM), this is indicating that price is overbought and that price is far away from KIJUN, a pull back will be certain with a near support target right at the KIJUN(always 0.5fib around $4749.9)
Risk Disclaimer:
Trading cryptocurrency on margin carries a high level of risk(volatile), and may not be suitable for all trades who are yet to understand how to use STOP LOSS. The high degree of leverage can work against you as well as for you.
It is your responsibility to confirm if you want to take this trade or not. Trade only with risk capital; that is, trade with money that, if lost, will not adversely impact your lifestyle and your ability to meet your financial obligations.
If you do not fully understand these risks you must seek independent advice from your financial advisor.
CHECK :
Still the 4hours time frame, we still see a big C-CLAMP( TK DISEQUILIBRIUM), this is indicating that price is overbought and that price is far away from KIJUN, a pull back will be certain with a near support target right at the KIJUN(always 0.5fib around $4749.9)
Risk Disclaimer:
Trading cryptocurrency on margin carries a high level of risk(volatile), and may not be suitable for all trades who are yet to understand how to use STOP LOSS. The high degree of leverage can work against you as well as for you.
It is your responsibility to confirm if you want to take this trade or not. Trade only with risk capital; that is, trade with money that, if lost, will not adversely impact your lifestyle and your ability to meet your financial obligations.
If you do not fully understand these risks you must seek independent advice from your financial advisor.