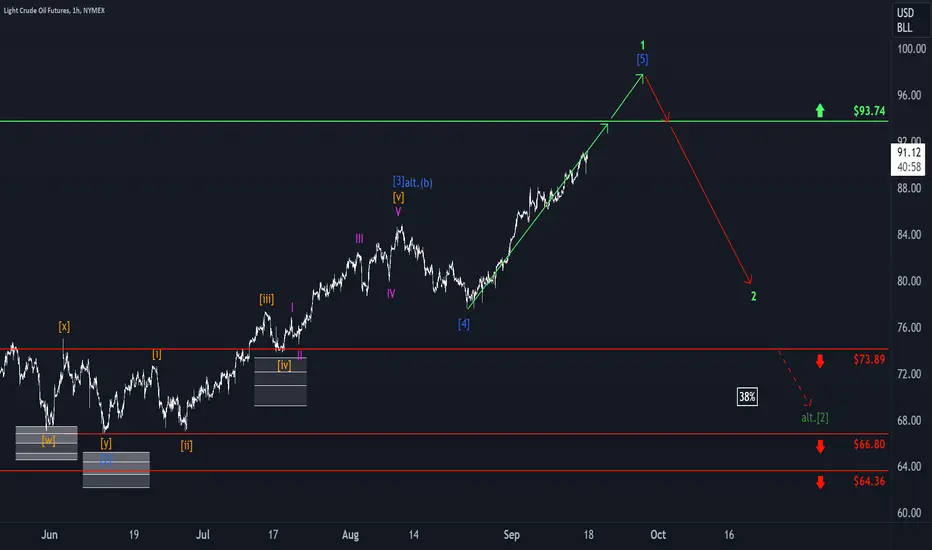
WTI is riding a robust bullish wave, propelling it to its highest levels in 10 months. In our analysis, we anticipate that, to complete the blue wave [5], it must surpass the resistance at $93.74. Subsequently, a noteworthy descent is in the cards. It’s essential to note that a dip below $73.89, though with a 38% probability in our estimation, signifies a further decline within the green wave alt.[2].
📊 Daily market insights combining macro + Elliott Wave analysis
🚀 Spot trends early with momentum, sentiment & price structure
🌐 Join thousands trading smarter at hkcmglobal.com
🚀 Spot trends early with momentum, sentiment & price structure
🌐 Join thousands trading smarter at hkcmglobal.com
Related publications
Disclaimer
The information and publications are not meant to be, and do not constitute, financial, investment, trading, or other types of advice or recommendations supplied or endorsed by TradingView. Read more in the Terms of Use.