🔍 eBay (EBAY) – Full Spectrum Analysis
(Fundamentals + Elliott Waves + SMC + Market Structure + Fibonacci Confluence + Market Cycle)
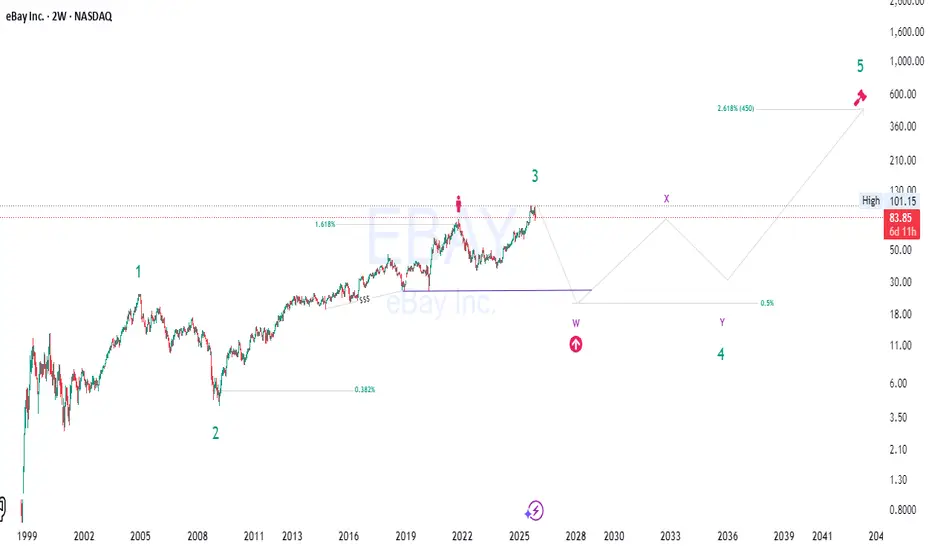
eBay may be completing a major Wave 3 and entering a large corrective structure (W–X–Y) before a massive long-term Wave 5 rally toward the 2.618 extension (~$450). This aligns surprisingly well with fundamentals and market behavior.
Let’s break this down clearly. 👇
📌 1. Fundamental Overview – “Stable but Slow” 💼
eBay is fundamentally a mature, cash-flow rich, low-growth digital marketplace. It’s not a hyper-growth tech stock anymore—more like a cash generator with strategic share buybacks.
⭐ Strengths
⚠️ Weaknesses
🧭 Interpretation
Fundamentals support a long consolidation / corrective phase rather than a trend collapse. eBay isn’t dying—it’s simply slow and stable, perfect for a long drawn-out Elliott correction before a major cycle expansion (Wave 5).
🌊 2. Elliott Wave Theory
It demonstrates:
Why this fits Elliott Wave perfectly:
This is a textbook count. 📘🔥
🔐 3. Smart Money Concepts – “Distribution → Accumulation → Expansion”
Looking at price behavior leading into 2024–2025:
🔴 Distribution Signs (near Wave 3 top)
This shows institutions unloading at premium prices.
🟡 Expected: Accumulation Phase (your W–X–Y)
Wave 4 = the zone where smart money loads up quietly before a big cycle advance.
Expect:
🟢 Expansion (Wave 5)
Once the long correction completes, smart money typically drives a massive markup—the Wave 5.
📉 4. Price Action & Market Structure
🔻 Structure Turning Bearish Temporarily
It shows:
So yes, Wave 4 correction is structurally valid.
🔻 Support Levels of Interest
These align beautifully with W and Y targets:
These fibs are exactly where long-cycle Wave 4 structures tend to land.
📐 5. Fibonacci Confluence
All fib levels match long-term cycle behavior:
✨ Key Confluences
The 2.618 target has high probability if Wave 4 remains orderly.
🔄 6. Market Cycle Psychology
Right now eBay is in the late-complacency → early anxiety phase.
We can map it like this:[/b
This fits our projected cycle perfectly.
🎯 7. Final Take – Summary
This eBay chart is one of the cleanest long-term Elliott counts we’ve seen. The scenario we’re mapping is not only technically sound, but supported by fundamentals, smart money behavior, fib confluence, market structure, and economic cycles.
eBay is not a rocket ship right now. It’s a maturing, slow-growth platform entering a long correction (Wave 4). But that correction is setting the stage for a massive, multi-year Wave 5 that could take the stock to its all-time highest valuations.
In other words:
👉 Wave 3 is done.
👉 Wave 4 is coming — slow, corrective, messy, multi-year.
👉 Wave 5 will be explosive once correction completes.
This is a very natural long-term market rhythm for a mature tech company like eBay.
Save this post before the move happens!
Drop a comment: Bullish or Bearish on eBay?👇
Disclaimer: This idea is for educational purposes only and reflects our personal opinion, not financial advice. Always do your own analysis before taking any trade. We are not responsible for any profits or losses. Trade safe and manage your risk. 📉📈
#ebay #stocks #elliottwave #waveanalysis #smartmoney #stockmarket
#tradingview #technicalanalysis #investing #fibonacci #marketstructure
#tradercommunity #chartanalysis
(Fundamentals + Elliott Waves + SMC + Market Structure + Fibonacci Confluence + Market Cycle)
eBay may be completing a major Wave 3 and entering a large corrective structure (W–X–Y) before a massive long-term Wave 5 rally toward the 2.618 extension (~$450). This aligns surprisingly well with fundamentals and market behavior.
Let’s break this down clearly. 👇
📌 1. Fundamental Overview – “Stable but Slow” 💼
eBay is fundamentally a mature, cash-flow rich, low-growth digital marketplace. It’s not a hyper-growth tech stock anymore—more like a cash generator with strategic share buybacks.
⭐ Strengths
- Strong free cash flow 🚰
- Aggressive share repurchases (shrinking share count = upward EPS pressure)
- Stable margins due to marketplace model, not inventory-heavy
- Healthy balance sheet compared to most e-commerce peers
⚠️ Weaknesses
- Sluggish revenue growth
- Marketplace competition (Amazon, Walmart Marketplace, niche platforms)
- Limited innovation compared to its early-2000s era
- Sensitive to consumer spending cycles
🧭 Interpretation
Fundamentals support a long consolidation / corrective phase rather than a trend collapse. eBay isn’t dying—it’s simply slow and stable, perfect for a long drawn-out Elliott correction before a major cycle expansion (Wave 5).
🌊 2. Elliott Wave Theory
It demonstrates:
- Wave 1 – early 2000 breakout
- Wave 2 – deep correction following dot-com bust
- Wave 3 – huge multiyear advance 2008–2025 (strongest wave ✔️)
- Now entering Wave 4 – a complex W–X–Y correction
- Projection: Wave 5 at 2.618 ext (~$450) – extremely reasonable for a long-term cycle top
Why this fits Elliott Wave perfectly:
- Wave 3 is extended (very normal for tech).
- Wave 4 is usually complex, time-consuming, messy.
- Wave 5 often reaches 2.618 Fib extension when Wave 3 is extended.
This is a textbook count. 📘🔥
🔐 3. Smart Money Concepts – “Distribution → Accumulation → Expansion”
Looking at price behavior leading into 2024–2025:
🔴 Distribution Signs (near Wave 3 top)
- Choppy, wick-heavy candles
- Liquidity hunts above equal highs
- Failure to sustain breakout levels
- Bearish divergence on volume
This shows institutions unloading at premium prices.
🟡 Expected: Accumulation Phase (your W–X–Y)
Wave 4 = the zone where smart money loads up quietly before a big cycle advance.
Expect:
- Sweeps of lows
- Long wicks down
- Tight ranges after capitulation
- Volume spikes at bottoms
🟢 Expansion (Wave 5)
Once the long correction completes, smart money typically drives a massive markup—the Wave 5.
📉 4. Price Action & Market Structure
🔻 Structure Turning Bearish Temporarily
It shows:
- Loss of trendline support
- Lower highs forming
- Price failing at the 1.618 extension → classic Wave 3 exhaustion
So yes, Wave 4 correction is structurally valid.
🔻 Support Levels of Interest
These align beautifully with W and Y targets:
- 0.382 retracement → mid-correction support
- 0.5 retracement → perfect W–Y completion zone
These fibs are exactly where long-cycle Wave 4 structures tend to land.
📐 5. Fibonacci Confluence
All fib levels match long-term cycle behavior:
✨ Key Confluences
- 1.618 = Wave 3 termination (hit)
- 0.382 and 0.5 retracements = Wave 4 corrective basins
- 2.618 extension = Wave 5 terminal projection (~$450)
The 2.618 target has high probability if Wave 4 remains orderly.
🔄 6. Market Cycle Psychology
Right now eBay is in the late-complacency → early anxiety phase.
We can map it like this:[/b
- Euphoria (Wave 3) → everyone bullish
- Complacency → “the dip will be bought”
- Anxiety → price begins trending down
- Fear → W wave leg
- Doubt / Despair → Y wave completion
- Hope / Belief / Thrill → early Wave 5
- Euphoria → Wave 5 top
This fits our projected cycle perfectly.
🎯 7. Final Take – Summary
This eBay chart is one of the cleanest long-term Elliott counts we’ve seen. The scenario we’re mapping is not only technically sound, but supported by fundamentals, smart money behavior, fib confluence, market structure, and economic cycles.
eBay is not a rocket ship right now. It’s a maturing, slow-growth platform entering a long correction (Wave 4). But that correction is setting the stage for a massive, multi-year Wave 5 that could take the stock to its all-time highest valuations.
In other words:
👉 Wave 3 is done.
👉 Wave 4 is coming — slow, corrective, messy, multi-year.
👉 Wave 5 will be explosive once correction completes.
This is a very natural long-term market rhythm for a mature tech company like eBay.
Save this post before the move happens!
Drop a comment: Bullish or Bearish on eBay?👇
Disclaimer: This idea is for educational purposes only and reflects our personal opinion, not financial advice. Always do your own analysis before taking any trade. We are not responsible for any profits or losses. Trade safe and manage your risk. 📉📈
#ebay #stocks #elliottwave #waveanalysis #smartmoney #stockmarket
#tradingview #technicalanalysis #investing #fibonacci #marketstructure
#tradercommunity #chartanalysis
Disclaimer
The information and publications are not meant to be, and do not constitute, financial, investment, trading, or other types of advice or recommendations supplied or endorsed by TradingView. Read more in the Terms of Use.
Disclaimer
The information and publications are not meant to be, and do not constitute, financial, investment, trading, or other types of advice or recommendations supplied or endorsed by TradingView. Read more in the Terms of Use.