Hello,
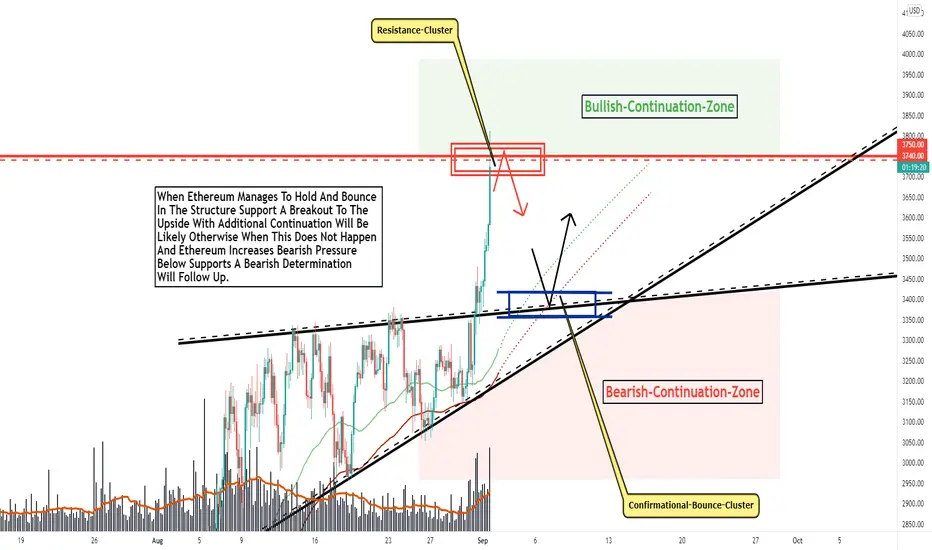
Welcome to this analysis about Ethereum, we are looking at the 4-hour timeframe perspectives, the recent events, the established formational structure and what to expect in the upcoming times. As when looking at my chart we can watch there how Ethereum recently increased bullishness and moved directly into this remaining resistance-cluster marked in red in my chart, there is a main horizontal resistance within this zone also is Ethereum overbought here together with the long wick candle it formed here a pullback from this point on has a higher possibility and should be considered. What will be important then is what happens when the pullback emerged as Ethereum will likely move on to test this trendline within the structure within which also the confirmational-bounce-cluster marked in blue in my chart is lying, it will be crucial on how Ethereum approaches this cluster because when Ethereum manages to bounce within and build up further this can lead to further developments to the upside and finally a breakout above the remaining resistance-cluster into the bullish-continuation-zone. Otherwise, when this does not happen and Ethereum increases bearishness this can also lead to further downward price-action into the bearish-continuation-zone marked in red in my chart. Mainly these are the two central scenarios to consider here for Ethereums next developments.
In this manner, thank you for watching my analysis about ETHEREUM and its main structure-resistance with the upcoming scenarios to consider, support the analysis with a like and follow or comment for more market insight!
Information provided is only educational and should not be used to take action in the market.
►✅JOIN THE BEST+ TOP TELEGRAM TRADING CHANNEL: t.me/VincePrinceForexGoldStocks
►🚀Write To Join the Elite VIP Signal Channels: @Vince_Prince
►🔥JOIN BYBIT TOP EXCHANGE►🎁 UP TO $30,000 BONUS NOW: partner.bybit.com/b/VinceByBit
►🚀Write To Join the Elite VIP Signal Channels: @Vince_Prince
►🔥JOIN BYBIT TOP EXCHANGE►🎁 UP TO $30,000 BONUS NOW: partner.bybit.com/b/VinceByBit
Disclaimer
The information and publications are not meant to be, and do not constitute, financial, investment, trading, or other types of advice or recommendations supplied or endorsed by TradingView. Read more in the Terms of Use.