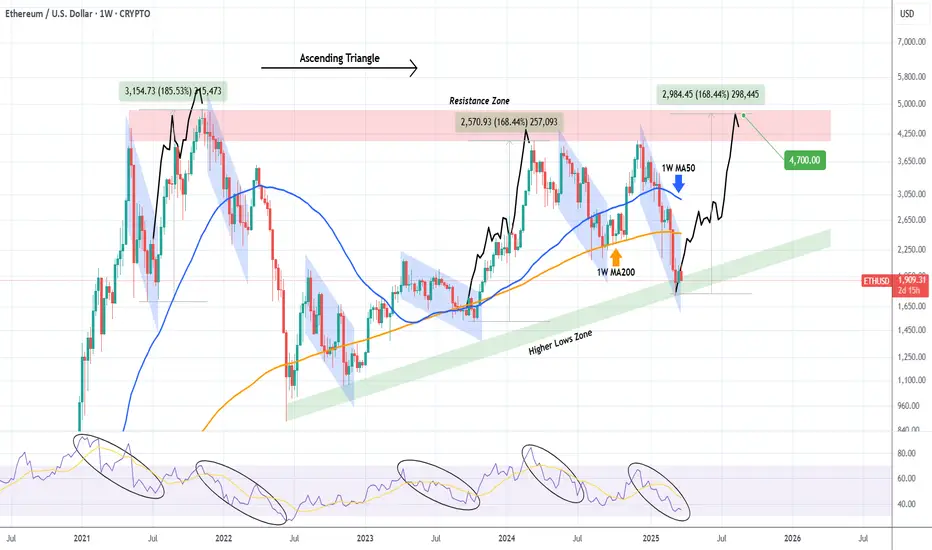
Ethereum (ETHUSD) hit 2 weeks ago the bottom (Higher Lows Zone) of its 4-year Ascending Triangle pattern, following the recent 3-month correction. That correction has technically been the pattern's Bearish Leg and during those 4 years we've had another 5 similar to this, all with the exception of one, producing a Higher High.
This is actually more similar to the October 09 2023 and June 21 2021 bottoms, so at worst we should get a +168.44% rally from here that will interestingly enough test the Triangle's top (Resistance Zone) a $4700.
-------------------------------------------------------------------------------
** Please LIKE 👍, FOLLOW ✅, SHARE 🙌 and COMMENT ✍ if you enjoy this idea! Also share your ideas and charts in the comments section below! This is best way to keep it relevant, support us, keep the content here free and allow the idea to reach as many people as possible. **
-------------------------------------------------------------------------------
💸💸💸💸💸💸
👇 👇 👇 👇 👇 👇
👑Best Signals (Forex/Crypto+70% accuracy) & Account Management (+20% profit/month on 10k accounts)
💰Free Channel t.me/tradingshotglobal
🤵Contact info@tradingshot.com t.me/tradingshot
🔥New service: next X100 crypto GEMS!
💰Free Channel t.me/tradingshotglobal
🤵Contact info@tradingshot.com t.me/tradingshot
🔥New service: next X100 crypto GEMS!
Disclaimer
The information and publications are not meant to be, and do not constitute, financial, investment, trading, or other types of advice or recommendations supplied or endorsed by TradingView. Read more in the Terms of Use.