Summary: The start to the week was not much of a surprise. Major indexes pulled back from record highs set the previous week. Those highs were from overextended mega-caps and the daily gains were not shared broadly across the market. We were watching for a day with broader gains and higher volume.
Notes
The structure is the following:
If you have been following my daily updates, you can skip down to the “The Meaning of Life”. If not, then this first part is a great play-by-play recap for the week. Click the daily charts for more detail on sectors, indexes and market leaders each day.
-=x=-=x=-=x=-=x=-=x=-=x=-=x=-
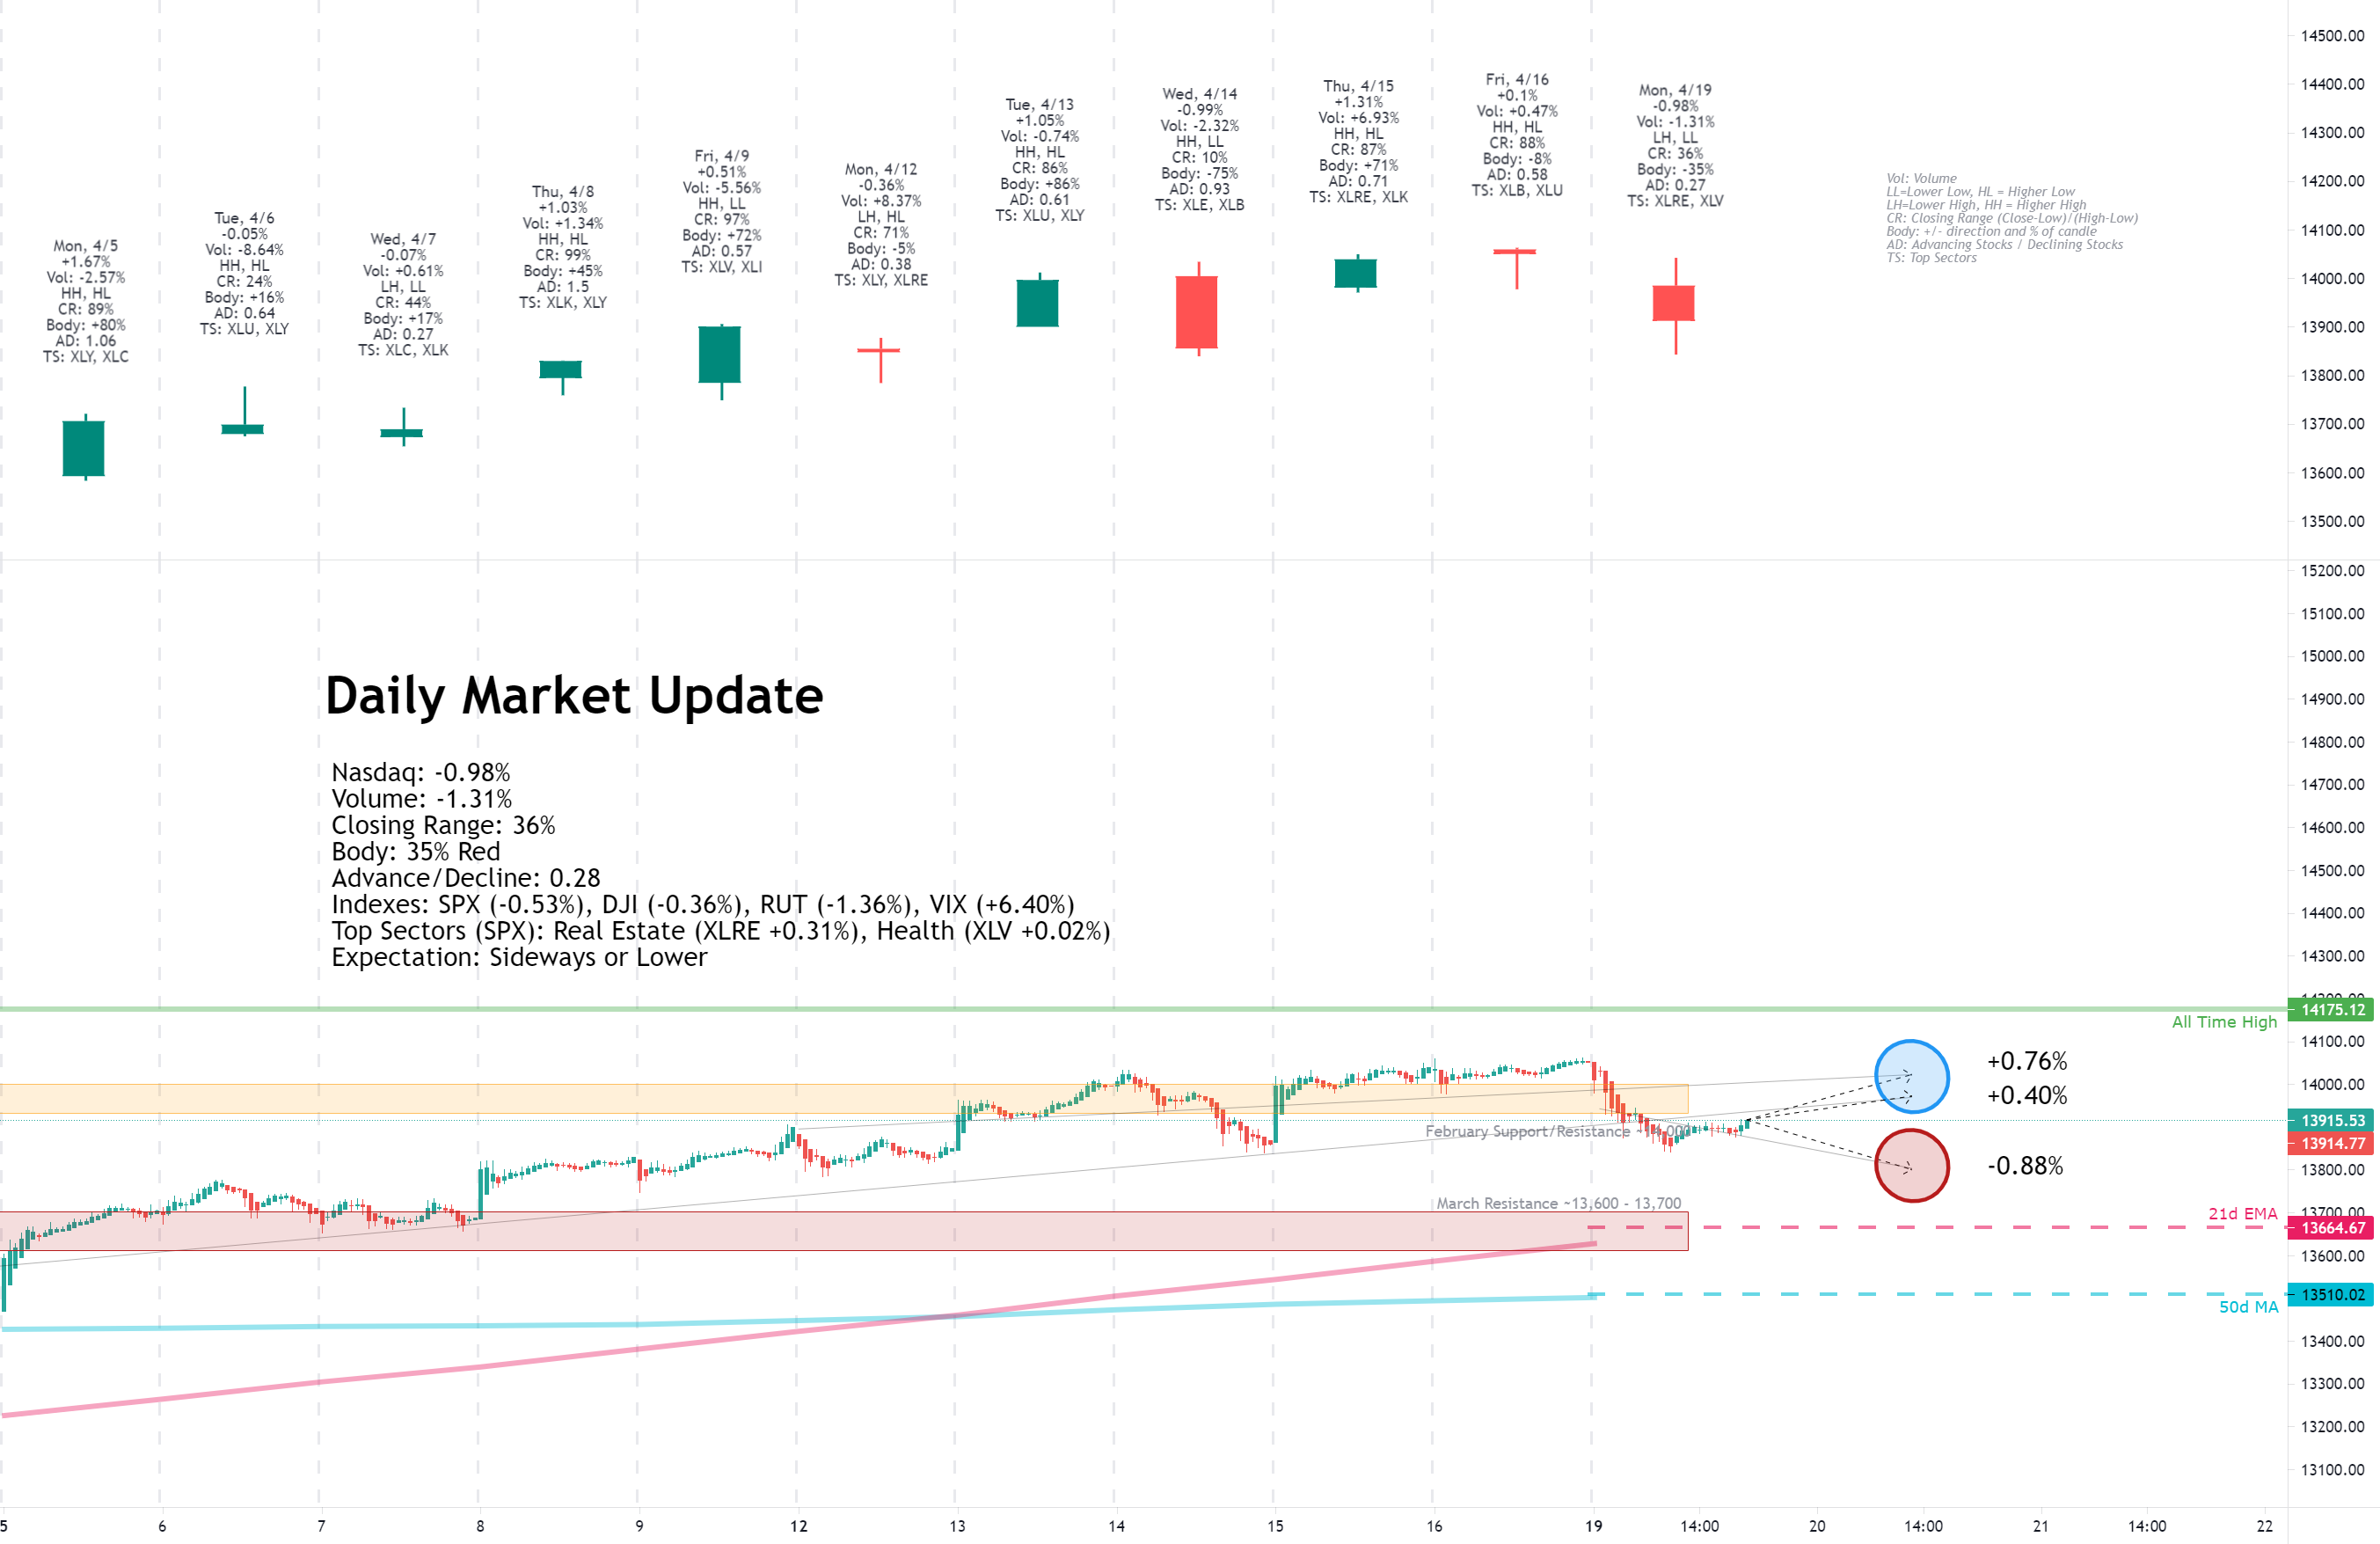
Monday, April 19, 2021

Facts: -0.98%, Volume lower, Closing range: 36%, Body: 35%
Good: Afternoon support after hitting 13,850
Bad: Lower high, lower low, back below 14,000 line
Highs/Lows: Lower high, lower low
Candle: Body in the middle of candle, about equal upper and lower wicks
Advance/Decline: Almost four declining stocks for every advancing stock
Indexes: SPX (-0.53%), DJI (-0.36%), RUT (-1.36%), VIX (+6.40%)
Sectors: Real Estate (XLRE +0.31%) and Health (XLV +0.02%) were only gaining sectors. Technology (XLK -0.83%) and Consumer Discretionary (XLY -1.12%) were bottom.
Expectation: Sideways or Lower
After closing last week at record highs, it's reasonable that the equity markets pull back a bit before advancing again. That pull back came abruptly as the session opened in the morning but the markets found some support heading into the afternoon.
The Nasdaq declined -0.98% on lower volume for the day. The upper wick formed in the first 15 minutes of trading, The declines came mostly in the morning, forming the lower wick. The candle finished the day with a 36% closing range at the bottom of a red 35% body in the center of the candle. There were almost 4 declining stocks for every one advancing stock on a day of lower highs and lower lows.
-=x=-=x=-=x=-=x=-=x=-=x=-=x=-
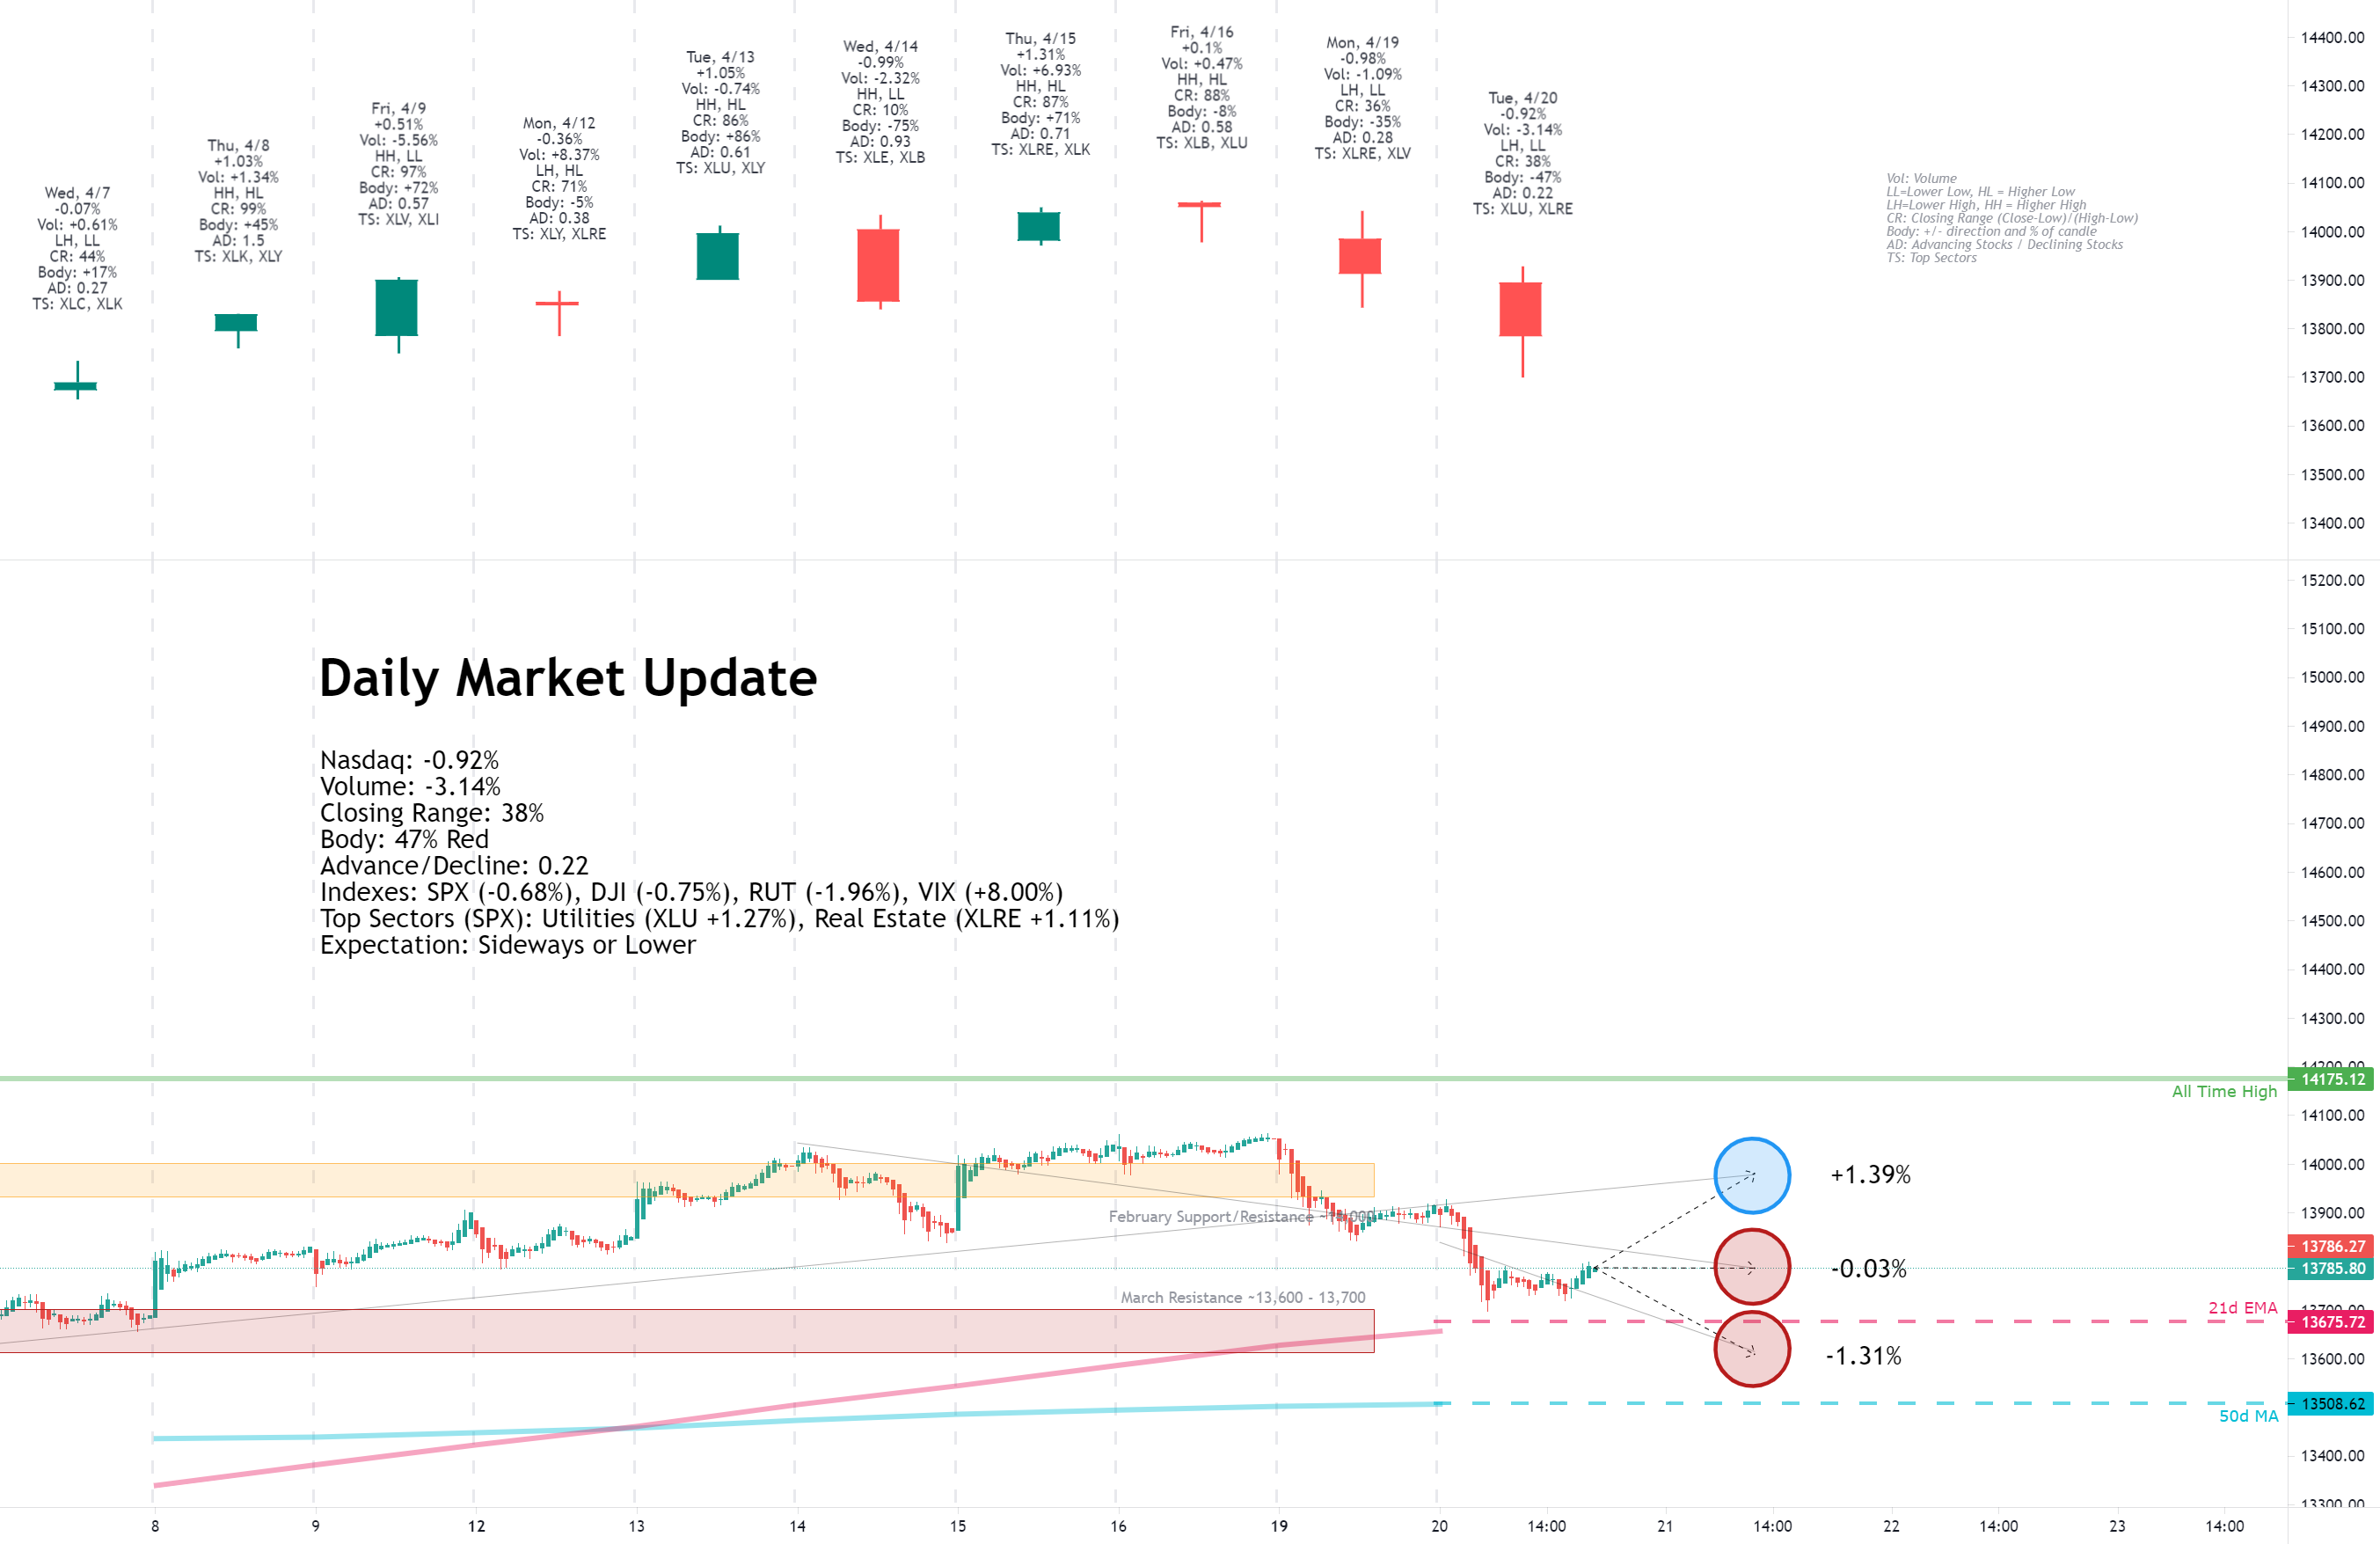
Tuesday, April 20, 2021
Facts: -0.92%, Volume lower, Closing range: 38%, Body: 47%
Good: Support at 21d EMA and 13,700 area
Bad: Closing range from morning sell-off
Highs/Lows: Lower high, lower low
Candle: Thick red body with a longer lower wick
Advance/Decline: Almost five declining stocks for every advancing stock
Indexes: SPX (-0.68%), DJI (-0.75%), RUT (-1.96%), VIX (+8.00%)
Sectors: Utilities (XLU +1.27%) and Real Estate (XLRE +1.11%) were the top sectors. Financials (XLF -1.87%) and Energy (XLE -2.65%) were bottom.
Expectation: Sideways or Lower
The market continued to pull back for another day as investors begin to absorb more earnings reports. Those results and the guidance not only impact to their respective stock prices but also indicate what parts of the economy are recovering faster or slower.
The Nasdaq closed down -0.92% on lower volume with a closing range of 38%. That closing range came after heavy morning selling, a bounce off the 21d EMA and a few tests of the 13,700 area. The index find support there and rallied a bit into close to finish with a thick red 47% red body over a longer lower wick. There were almost five declining stocks for every advancing stock.
-=x=-=x=-=x=-=x=-=x=-=x=-=x=-
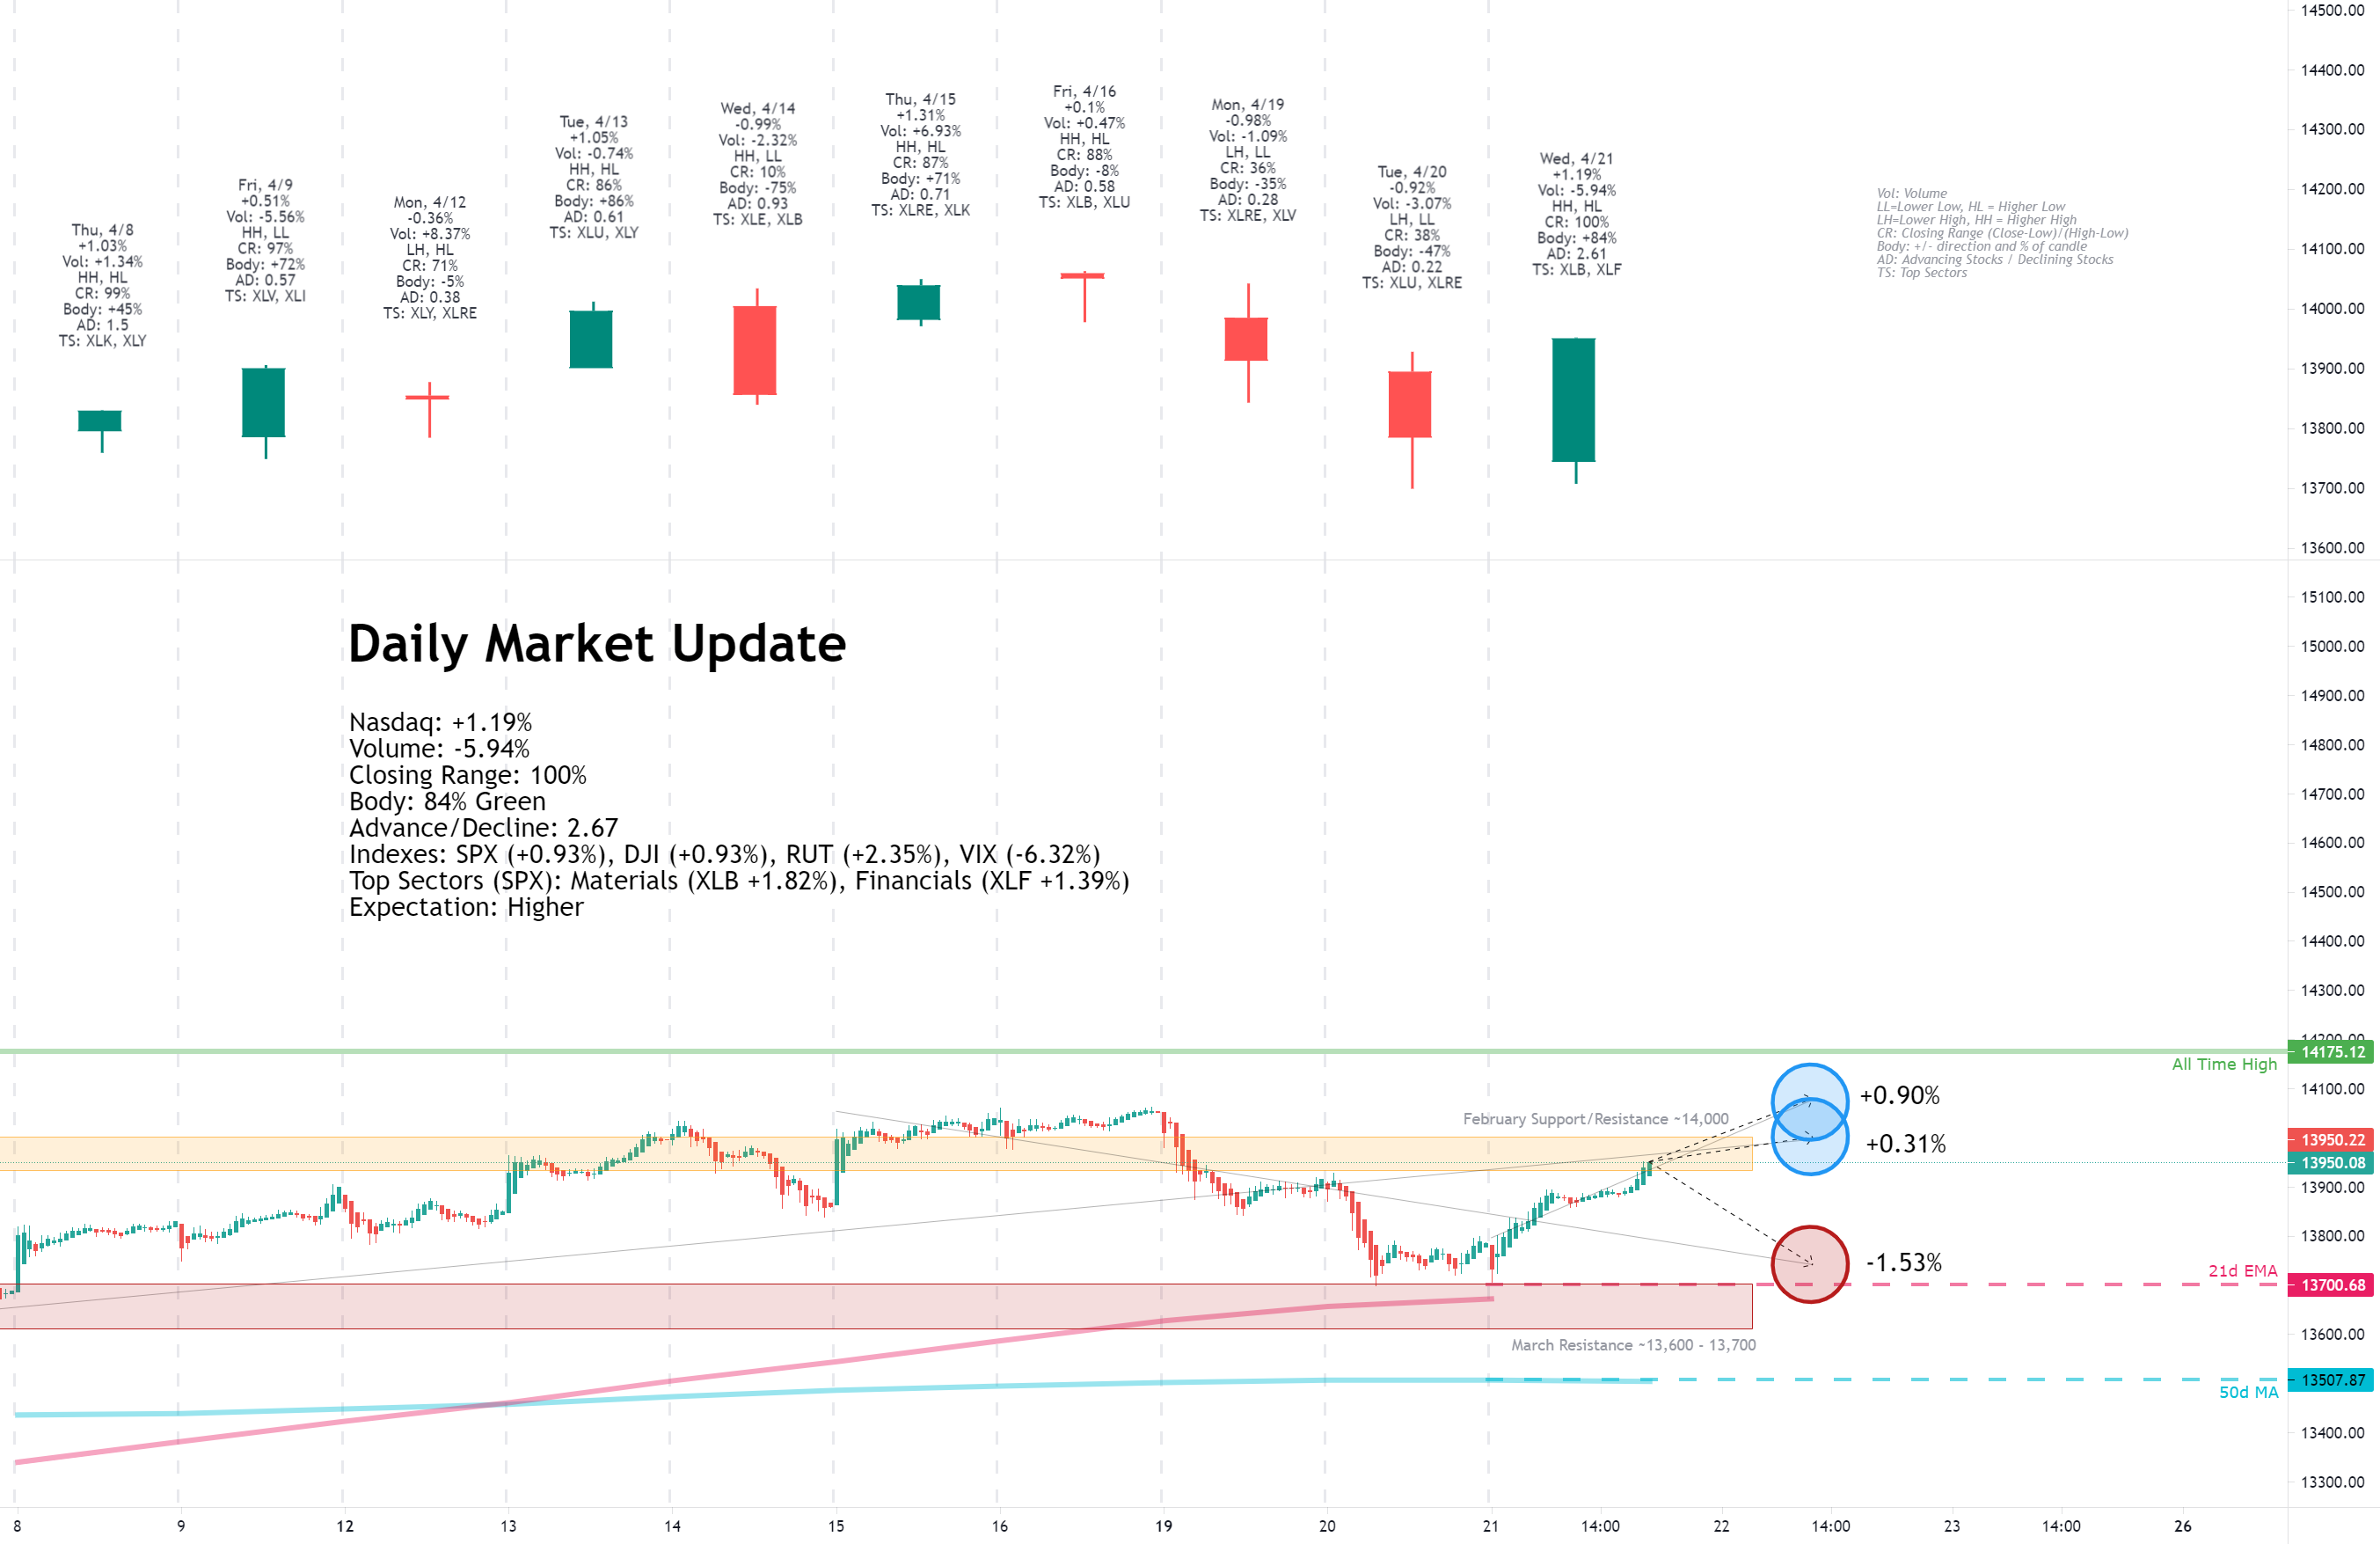
Wednesday, April 21, 2021
Facts: +1.19%, Volume lower, Closing range: 100%, Body: 84%
Good: Test of 21d EMA in morning then buying throughout the day, rally into close
Bad: Lower volume
Highs/Lows: Higher high, higher low
Candle: Long green body with no upper wick, small lower wick
Advance/Decline: Five advancing stocks for every two declining stocks
Indexes: SPX (+0.93%), DJI (+0.93%), RUT (+2.35%), VIX (-6.32%)
Sectors: Materials (XLB +1.82%) and Financials (XLF +1.39%) were the top sectors. Communications (XLC +0.17%) and Utilities (-0.84%) were bottom.
Expectation: Higher
The gains were broad across segments and sectors today, pivoting the indexes to the upside after a few days of declines. The only thing that was missing is higher volume that would indicate more institutional support in the gains. We'll take what we got for now and then keep a close eye in the days to come.
The Nasdaq finally had the advance/decline ratio above 1.0 after eight sessions in a row of more decliners than advancers. Along with great support from mega-caps, the index closed with a +1.19% gain and a closing range of 100%. The 84% green body is above a small lower wick formed from a dip at open. Otherwise, the bulls led the index higher through the whole day. There were over 5 advancing stocks for every 2 declining stocks.
-=x=-=x=-=x=-=x=-=x=-=x=-=x=-
Thursday, April 22, 2021
Facts: -0.94%, Volume higher, Closing range: 19%, Body: 55%
Good: Higher high, higher low
Bad: Mid-day reversal on high volume
Highs/Lows: Higher high, higher low
Candle: Reversal candle, gap up with long upper wick, turning into a lower close
Advance/Decline: More declining stocks than advancing stocks
Indexes: SPX (-0.92%), DJI (-0.94%), RUT (-0.31%), VIX (+6.91%)
Sectors: Real Estate (XLRE -0.43%) and Health (XLV -0.45%) were top. Technology (XLK -1.17%) and Materials (XLB -1.69%) was bottom.
Expectation: Sideways or Lower
The day started by honoring the expectation we had of a move higher, but a mid-day reversal busted that expectation, erasing the gains and sending prices plummeting. The reason was obvious. News broke that Biden would propose a huge increase in capital gains tax. So we'll look closely at the impact and what we might expect from here.
The Nasdaq closed with a -0.94% decline on higher volume. The higher volume distribution starting at the 1pm news alert. The 94% red body is below a longer upper wick that formed from the morning rally before the news. The closing range is 19% and shows some recovery from the initial selling of the news. There were more declining stocks than advancing stocks.
-=x=-=x=-=x=-=x=-=x=-=x=-=x=-
Friday, April 23, 2021
Facts: +1.44%, Volume lower, Closing range: 78%, Body: 75%
Good: Now lower wick, strong buying all morning
Bad: Slight dip into close as the weekend arrives
Highs/Lows: Higher high, higher low
Candle: Mostly green body with a longer upper wick from the dip at close
Advance/Decline: Two advancing stocks for every declining stock
Indexes: SPX (+1.09%), DJI (+0.67%), RUT (+1.76%), VIX (-7.38%)
Sectors: Financial (XLF +1.87%) and Materials (XLB +1.64%) were top. Utilities (XLU -0.13%) and Consumer Staples (XLP -0.26%) were bottom.
Expectation: Higher
Strong economic data sent the markets higher on Friday as investors shook off the capital gains tax worries. Small caps took the lead for another session as gains were shared broadly across segments and sectors.
The Nasdaq gained +1.44% on lower volume than yesterday, but higher volume than earlier in the week. The 75% body is above a very tiny lower wick. The closing range of 78% is just below a longer upper wick that formed in the last 30 minutes of the session from selling into the weekend. There were two advancing stocks for every declining stock.
-=x=-=x=-=x=-=x=-=x=-=x=-=x=-
The Meaning of Life (View on the Week)
The start to the week was not much of a surprise. Major indexes pulled back from record highs set the previous week. Those highs were from overextended mega-caps and the daily gains were not shared broadly across the market. We were watching for a day with broader gains and higher volume.
After two days of pullbacks, that hit the small caps the hardest, the turn in the in the market came on Wednesday. The advance/decline line finally moved above 1.0 with five advancing stocks for every two declining stocks, but volume was still lower than previous days.
It looked like we would get the broad gains and higher volume on Thursday as the market opened with another rally. But the rally was short lived. News of Biden raising the capital gains tax hit the street and investors sold off positions in the afternoon. But even in the selling, small caps were still outperforming and there was a sense that the sell the news event would find a bottom and the rally could resume. And it did.
Friday picked back up where we were trying to go on Thursday morning. There were broad gains across the market. And although volume was lower than Thursday, it was higher than the previous days and gave us the positive signal we were looking for.
This growth/value comparison we've been tracking continued to move sideways this week as growth and value plays moved together.
The Nasdaq retreated -0.25% for the week, but ended with a closing range of 87% after recovering from the dip at the beginning of the week and rebounding from the capital gains tax scare mid-week.
The index was able to set just a slightly higher high than the previous week, but also set a lower low. More importantly, the index closed above 14,000 for a second week in a row. Volume was lower than the previous week.
The Russell 2000 (RUT) gained +0.41% for the week thanks to a strong small cap performance late in the week. The S&P 500 lost -0.13% for the week. The Dow Jones Industrial average (DJI) declined -0.46%.
The VIX volatility index rose +6.65% over a back-and-forth week.
Despite the declines across the major indexes, there were two sectors that soared.
Real Estate ( XLRE ) ended the week as the top sector, advancing over 2%. Three factors helped the sector breakout and then stay on top the whole week. The economic recovery is a boon for the real estate industry as occupancy rates climb driving demand and prices higher. Interest rates remain low thanks to the Fed's continued easy money policy, keeping costs low. And in a climate of nervous investors, fearful of new lockdowns around the world, the real estate sector becomes a nice defensive play that has growth potential as well.
Healthcare ( XLV ) was the second best sector of the week. The sector has lagged behind the S&P 500 since the beginning of the year. Positive earnings reports from UnitedHealth ( UNH ) and Johnson & Johnson ( JNJ ) over the past few weeks gave it the momentum needed to catch up with a 1.81% advance this week.
The only other sectors that had gains for the week were Materials ( XLB ) and Industrials ( XLI ), both responding positively to great economic recovery news.
At the bottom of the sector list were Energy ( XLE ) and Consumer Discretionary ( XLY ). Energy stocks continue to underperform as oil prices have been dropping in recent weeks. Consumer Discretionary was a big part of the S&P 500 setting records the previous three weeks and was due to pause or pullback this week. Earnings reports from Tesla ( TSLA ) and Amazon ( AMZN ) next week will have a big influence on the sector performance.
The yield curve continues to flatten this week with the US 30y treasury bond and US 10y treasury note yields both declining. The US 2y note yield rose slightly.
Both the High Yield Corporate Bond (HYG) and Investment Grade Bond (LQD) prices advanced for the week.
The US Dollar (DXY) continues to slide from the end of March, declining another -0.86% this week.
Silver (SILVER) and Gold (GOLD) both advanced for the week.
Crude Oil (CRUDEOIL1!) declined -1.46%.
Timber (WOOD) declined -1.71% but is still near highs.
Copper (COPPER1!) and Aluminum (ALI1!) both advanced for another week.
-=x=-=x=-=x=-=x=-=x=-=x=-=x=-
The Big Four Mega-caps
The big four mega-caps continue to outpace the rest of the market. Alphabet (GOOGL) moved up +0.75% for the week. Microsoft (MSFT) gained +0.16% while Apple (AAPL) advanced +0.12%. Only Amazon (AMZN) declined for the week, losing -1.72%. All four are trading above their 10w and 40w moving average lines.
-=x=-=x=-=x=-=x=-=x=-=x=-=x=-
The Four Recovery Stocks
I picked four recovery stocks to track against the indexes and other indicators in this weekly report. Only Carnival Cruise Lines (CCL) could end the week with a light gain after dipping below its 10w moving average line and closing above it. Marriott (MAR) also dipped below the line but close above it, declining just -0.18% for the week. Exxon Mobil (XOM) declined -1.92%, closing the week below the 10w moving average. Delta (DAL) declined -1.80% and also remained below the line.
-=x=-=x=-=x=-=x=-=x=-=x=-=x=-
Investor Sentiment
The put/call ratio (PCCE) closed the week 0.651. A contrarian indicator, when the put/call ratio is below 0.7, it signals overly bullish sentiment and could mean an overbought market.
The CNN Fear & Greed index moved to the greed side but not far off neutral.
The NAAIM exposure index remained about the same, moving just slightly lower to 95.6.
-=x=-=x=-=x=-=x=-=x=-=x=-=x=-
The Week Ahead
Monday will kick-off the week with Core Durable Goods orders data for March. The data is a leading indicator showing increased manufacturing data to respond to higher consumer demand.
The House Price Index data on Tuesday will be interesting. It has been at its highest level since 2014. Higher prices are supposed to be bullish for the USD. Consumer Confidence data will be released just after market open. The API Weekly crude oil report will be released after close.
Wednesday's news will include the Good Trade Balance and Retail Inventories before market open. Crude Oil Inventories after the market open. There is a Fed Interest Rate Decision and FOMC Press Conference after 2pm.
On Thursday, new GDP data will be released which is expected to be 6.5%. Initial Jobless Claims data will hopefully continue to fall. Pending Home Sales data will be released after market open.
Inflation will be front and center again on Friday. PCE Price Index data will be released in the morning. That will compliment Personal Spending data and Consumer Expectations and Sentiment that have all been driving higher demand and higher prices.
The frequency of earnings reports will start to pick up next week. Investors will be watching all earnings reports closely to measure sector performance in the economic recovery. Kicking off on Monday will be reports from Tesla (TSLA), NXP Semiconductors (NXPI), Canon (CAJ), Albertsons (ACI).
On Tuesday, Microsoft (MSFT), Alphabet (GOOGL), Visa (V), Eli Lily (LLY), United Parcel Service (UPS), Starbucks (SBUX), General Electric (GE), 3M (MMM), AMD (AMD), ABB (ABB), and FireEye (FEYE).
Wednesday includes reports from Apple (AAPL), Facebook (FB), Qualcomm (QCOM), Boeing (BA), Shopify (SHOP), ServiceNow (NOW), ADP (ADP), Spotify (SPOT), Ford (F), eBay (EBAY), and Teladoc (TDOC).
On Thursday, Amazon (AMZN), Mastercard (MA), Comcast (CMCSA), Thermo Fisher Scientific (TMO), McDonald's (MCD), Baidu (BIDU), Atlassian (TEAM), Twitter (TWTR), Fortinet (FTNT), Royal Caribbean (RCL), and Logitech (LOGI).
Friday will close the big earnings week with Alibaba (BABA), Exxon Mobil (XOM), AbbVie (ABBV), Chevron (CVX), AstraZeneca (AZN), Johnson Controls (JCI), and Komatsu (KMTUY).
It would be an understatement to say this is not an exhaustive list. Check your own portfolio for earnings dates so you aren't surprised.
-=x=-=x=-=x=-=x=-=x=-=x=-=x=-
The Bullish Side
Despite the scare on Thursday, the market gave us a lot to be excited about in the last three days. We saw the advance/decline line finally move above 1.0 as the small caps began to rebound and drive the Russell 2000 higher. With the mega-caps also moving up, it will provide a lot of momentum into next week, possibly getting the Nasdaq to a new all-time high.
More economic news throughout the week should support the view that the economy is booming and drive further positive sentiment to the market. Treasury yields are coming down, making money cheaper again. The USD dollar weakening can be a boost to large multinationals.
Positive earnings reports this week may be just the boost the market needs to head higher.
-=x=-=x=-=x=-=x=-=x=-=x=-=x=-
The Bearish Side
Volume continues to move lower even as the market gains, potentially signaling a top. From the start of the year, the highest volume weeks are red declining weeks. This may be the reduction of retail investors participating in the active market, but it could also be institutions reducing positions.
Any of the economic news events this week could be a negative surprise start a sell-off. Especially any hints from the Fed of monetary policy changes would be received with a big negative reaction.
Positive earnings reports this week may already be priced in, and any disappointing results or guidance will certainly alarm investors.
-=x=-=x=-=x=-=x=-=x=-=x=-=x=-
Key Nasdaq Levels to Watch
The Nasdaq closed above 14,000 two weeks in a row, but can it move toward an all-time high? That's the question for this week.
On the positive side, the levels are:
On the downside, there are a few key levels:
-=x=-=x=-=x=-=x=-=x=-=x=-=x=-
Wrap-up
There are smart people that say the market is extended and positive news and earning reports are already priced in. There are also smart people who believe the recovering economy and support of the Fed is going to send the market higher. I try to see both sides in the market week in review, so how to decide? Follow price.
Next week, with all the earning reports and economic news, the only questions that need to be answered is what happens to the indexes and what happens to the stocks in your portfolio. Live by your investment rules and let them be your guide.
Good luck, stay healthy and trade safe!
Notes
- The Market Week in Review is my weekend homework where I look over what happened in the previous week and what might come in the next week.
- I do occasionally have some errors or typos and will correct them in my blog or in the comments on TradingView. I do not have an editor and do this in my free time.
- If you find this helpful, please let me know in the comments. I am also more than happy to add new perspectives and data points if you have ideas.
The structure is the following:
- A recap of the daily updates that I do here on TradingView.
- The Meaning of Life, a view on the past week
- What's coming in the next week
- The Bullish View, The Bearish View
- Key index levels to watch out for
- Wrap-up
If you have been following my daily updates, you can skip down to the “The Meaning of Life”. If not, then this first part is a great play-by-play recap for the week. Click the daily charts for more detail on sectors, indexes and market leaders each day.
-=x=-=x=-=x=-=x=-=x=-=x=-=x=-
Monday, April 19, 2021
Facts: -0.98%, Volume lower, Closing range: 36%, Body: 35%
Good: Afternoon support after hitting 13,850
Bad: Lower high, lower low, back below 14,000 line
Highs/Lows: Lower high, lower low
Candle: Body in the middle of candle, about equal upper and lower wicks
Advance/Decline: Almost four declining stocks for every advancing stock
Indexes: SPX (-0.53%), DJI (-0.36%), RUT (-1.36%), VIX (+6.40%)
Sectors: Real Estate (XLRE +0.31%) and Health (XLV +0.02%) were only gaining sectors. Technology (XLK -0.83%) and Consumer Discretionary (XLY -1.12%) were bottom.
Expectation: Sideways or Lower
After closing last week at record highs, it's reasonable that the equity markets pull back a bit before advancing again. That pull back came abruptly as the session opened in the morning but the markets found some support heading into the afternoon.
The Nasdaq declined -0.98% on lower volume for the day. The upper wick formed in the first 15 minutes of trading, The declines came mostly in the morning, forming the lower wick. The candle finished the day with a 36% closing range at the bottom of a red 35% body in the center of the candle. There were almost 4 declining stocks for every one advancing stock on a day of lower highs and lower lows.
-=x=-=x=-=x=-=x=-=x=-=x=-=x=-
Tuesday, April 20, 2021
Facts: -0.92%, Volume lower, Closing range: 38%, Body: 47%
Good: Support at 21d EMA and 13,700 area
Bad: Closing range from morning sell-off
Highs/Lows: Lower high, lower low
Candle: Thick red body with a longer lower wick
Advance/Decline: Almost five declining stocks for every advancing stock
Indexes: SPX (-0.68%), DJI (-0.75%), RUT (-1.96%), VIX (+8.00%)
Sectors: Utilities (XLU +1.27%) and Real Estate (XLRE +1.11%) were the top sectors. Financials (XLF -1.87%) and Energy (XLE -2.65%) were bottom.
Expectation: Sideways or Lower
The market continued to pull back for another day as investors begin to absorb more earnings reports. Those results and the guidance not only impact to their respective stock prices but also indicate what parts of the economy are recovering faster or slower.
The Nasdaq closed down -0.92% on lower volume with a closing range of 38%. That closing range came after heavy morning selling, a bounce off the 21d EMA and a few tests of the 13,700 area. The index find support there and rallied a bit into close to finish with a thick red 47% red body over a longer lower wick. There were almost five declining stocks for every advancing stock.
-=x=-=x=-=x=-=x=-=x=-=x=-=x=-
Wednesday, April 21, 2021
Facts: +1.19%, Volume lower, Closing range: 100%, Body: 84%
Good: Test of 21d EMA in morning then buying throughout the day, rally into close
Bad: Lower volume
Highs/Lows: Higher high, higher low
Candle: Long green body with no upper wick, small lower wick
Advance/Decline: Five advancing stocks for every two declining stocks
Indexes: SPX (+0.93%), DJI (+0.93%), RUT (+2.35%), VIX (-6.32%)
Sectors: Materials (XLB +1.82%) and Financials (XLF +1.39%) were the top sectors. Communications (XLC +0.17%) and Utilities (-0.84%) were bottom.
Expectation: Higher
The gains were broad across segments and sectors today, pivoting the indexes to the upside after a few days of declines. The only thing that was missing is higher volume that would indicate more institutional support in the gains. We'll take what we got for now and then keep a close eye in the days to come.
The Nasdaq finally had the advance/decline ratio above 1.0 after eight sessions in a row of more decliners than advancers. Along with great support from mega-caps, the index closed with a +1.19% gain and a closing range of 100%. The 84% green body is above a small lower wick formed from a dip at open. Otherwise, the bulls led the index higher through the whole day. There were over 5 advancing stocks for every 2 declining stocks.
-=x=-=x=-=x=-=x=-=x=-=x=-=x=-
Thursday, April 22, 2021

Facts: -0.94%, Volume higher, Closing range: 19%, Body: 55%
Good: Higher high, higher low
Bad: Mid-day reversal on high volume
Highs/Lows: Higher high, higher low
Candle: Reversal candle, gap up with long upper wick, turning into a lower close
Advance/Decline: More declining stocks than advancing stocks
Indexes: SPX (-0.92%), DJI (-0.94%), RUT (-0.31%), VIX (+6.91%)
Sectors: Real Estate (XLRE -0.43%) and Health (XLV -0.45%) were top. Technology (XLK -1.17%) and Materials (XLB -1.69%) was bottom.
Expectation: Sideways or Lower
The day started by honoring the expectation we had of a move higher, but a mid-day reversal busted that expectation, erasing the gains and sending prices plummeting. The reason was obvious. News broke that Biden would propose a huge increase in capital gains tax. So we'll look closely at the impact and what we might expect from here.
The Nasdaq closed with a -0.94% decline on higher volume. The higher volume distribution starting at the 1pm news alert. The 94% red body is below a longer upper wick that formed from the morning rally before the news. The closing range is 19% and shows some recovery from the initial selling of the news. There were more declining stocks than advancing stocks.
-=x=-=x=-=x=-=x=-=x=-=x=-=x=-
Friday, April 23, 2021

Facts: +1.44%, Volume lower, Closing range: 78%, Body: 75%
Good: Now lower wick, strong buying all morning
Bad: Slight dip into close as the weekend arrives
Highs/Lows: Higher high, higher low
Candle: Mostly green body with a longer upper wick from the dip at close
Advance/Decline: Two advancing stocks for every declining stock
Indexes: SPX (+1.09%), DJI (+0.67%), RUT (+1.76%), VIX (-7.38%)
Sectors: Financial (XLF +1.87%) and Materials (XLB +1.64%) were top. Utilities (XLU -0.13%) and Consumer Staples (XLP -0.26%) were bottom.
Expectation: Higher
Strong economic data sent the markets higher on Friday as investors shook off the capital gains tax worries. Small caps took the lead for another session as gains were shared broadly across segments and sectors.
The Nasdaq gained +1.44% on lower volume than yesterday, but higher volume than earlier in the week. The 75% body is above a very tiny lower wick. The closing range of 78% is just below a longer upper wick that formed in the last 30 minutes of the session from selling into the weekend. There were two advancing stocks for every declining stock.
-=x=-=x=-=x=-=x=-=x=-=x=-=x=-
The Meaning of Life (View on the Week)
The start to the week was not much of a surprise. Major indexes pulled back from record highs set the previous week. Those highs were from overextended mega-caps and the daily gains were not shared broadly across the market. We were watching for a day with broader gains and higher volume.
After two days of pullbacks, that hit the small caps the hardest, the turn in the in the market came on Wednesday. The advance/decline line finally moved above 1.0 with five advancing stocks for every two declining stocks, but volume was still lower than previous days.
It looked like we would get the broad gains and higher volume on Thursday as the market opened with another rally. But the rally was short lived. News of Biden raising the capital gains tax hit the street and investors sold off positions in the afternoon. But even in the selling, small caps were still outperforming and there was a sense that the sell the news event would find a bottom and the rally could resume. And it did.
Friday picked back up where we were trying to go on Thursday morning. There were broad gains across the market. And although volume was lower than Thursday, it was higher than the previous days and gave us the positive signal we were looking for.
This growth/value comparison we've been tracking continued to move sideways this week as growth and value plays moved together.
The Nasdaq retreated -0.25% for the week, but ended with a closing range of 87% after recovering from the dip at the beginning of the week and rebounding from the capital gains tax scare mid-week.
The index was able to set just a slightly higher high than the previous week, but also set a lower low. More importantly, the index closed above 14,000 for a second week in a row. Volume was lower than the previous week.
The Russell 2000 (RUT) gained +0.41% for the week thanks to a strong small cap performance late in the week. The S&P 500 lost -0.13% for the week. The Dow Jones Industrial average (DJI) declined -0.46%.
The VIX volatility index rose +6.65% over a back-and-forth week.

Despite the declines across the major indexes, there were two sectors that soared.
Real Estate ( XLRE ) ended the week as the top sector, advancing over 2%. Three factors helped the sector breakout and then stay on top the whole week. The economic recovery is a boon for the real estate industry as occupancy rates climb driving demand and prices higher. Interest rates remain low thanks to the Fed's continued easy money policy, keeping costs low. And in a climate of nervous investors, fearful of new lockdowns around the world, the real estate sector becomes a nice defensive play that has growth potential as well.
Healthcare ( XLV ) was the second best sector of the week. The sector has lagged behind the S&P 500 since the beginning of the year. Positive earnings reports from UnitedHealth ( UNH ) and Johnson & Johnson ( JNJ ) over the past few weeks gave it the momentum needed to catch up with a 1.81% advance this week.
The only other sectors that had gains for the week were Materials ( XLB ) and Industrials ( XLI ), both responding positively to great economic recovery news.
At the bottom of the sector list were Energy ( XLE ) and Consumer Discretionary ( XLY ). Energy stocks continue to underperform as oil prices have been dropping in recent weeks. Consumer Discretionary was a big part of the S&P 500 setting records the previous three weeks and was due to pause or pullback this week. Earnings reports from Tesla ( TSLA ) and Amazon ( AMZN ) next week will have a big influence on the sector performance.
The yield curve continues to flatten this week with the US 30y treasury bond and US 10y treasury note yields both declining. The US 2y note yield rose slightly.
Both the High Yield Corporate Bond (HYG) and Investment Grade Bond (LQD) prices advanced for the week.
The US Dollar (DXY) continues to slide from the end of March, declining another -0.86% this week.
Silver (SILVER) and Gold (GOLD) both advanced for the week.
Crude Oil (CRUDEOIL1!) declined -1.46%.
Timber (WOOD) declined -1.71% but is still near highs.
Copper (COPPER1!) and Aluminum (ALI1!) both advanced for another week.
-=x=-=x=-=x=-=x=-=x=-=x=-=x=-
The Big Four Mega-caps
The big four mega-caps continue to outpace the rest of the market. Alphabet (GOOGL) moved up +0.75% for the week. Microsoft (MSFT) gained +0.16% while Apple (AAPL) advanced +0.12%. Only Amazon (AMZN) declined for the week, losing -1.72%. All four are trading above their 10w and 40w moving average lines.
-=x=-=x=-=x=-=x=-=x=-=x=-=x=-
The Four Recovery Stocks
I picked four recovery stocks to track against the indexes and other indicators in this weekly report. Only Carnival Cruise Lines (CCL) could end the week with a light gain after dipping below its 10w moving average line and closing above it. Marriott (MAR) also dipped below the line but close above it, declining just -0.18% for the week. Exxon Mobil (XOM) declined -1.92%, closing the week below the 10w moving average. Delta (DAL) declined -1.80% and also remained below the line.
-=x=-=x=-=x=-=x=-=x=-=x=-=x=-
Investor Sentiment
The put/call ratio (PCCE) closed the week 0.651. A contrarian indicator, when the put/call ratio is below 0.7, it signals overly bullish sentiment and could mean an overbought market.
The CNN Fear & Greed index moved to the greed side but not far off neutral.
The NAAIM exposure index remained about the same, moving just slightly lower to 95.6.
-=x=-=x=-=x=-=x=-=x=-=x=-=x=-
The Week Ahead
Monday will kick-off the week with Core Durable Goods orders data for March. The data is a leading indicator showing increased manufacturing data to respond to higher consumer demand.
The House Price Index data on Tuesday will be interesting. It has been at its highest level since 2014. Higher prices are supposed to be bullish for the USD. Consumer Confidence data will be released just after market open. The API Weekly crude oil report will be released after close.
Wednesday's news will include the Good Trade Balance and Retail Inventories before market open. Crude Oil Inventories after the market open. There is a Fed Interest Rate Decision and FOMC Press Conference after 2pm.
On Thursday, new GDP data will be released which is expected to be 6.5%. Initial Jobless Claims data will hopefully continue to fall. Pending Home Sales data will be released after market open.
Inflation will be front and center again on Friday. PCE Price Index data will be released in the morning. That will compliment Personal Spending data and Consumer Expectations and Sentiment that have all been driving higher demand and higher prices.
The frequency of earnings reports will start to pick up next week. Investors will be watching all earnings reports closely to measure sector performance in the economic recovery. Kicking off on Monday will be reports from Tesla (TSLA), NXP Semiconductors (NXPI), Canon (CAJ), Albertsons (ACI).
On Tuesday, Microsoft (MSFT), Alphabet (GOOGL), Visa (V), Eli Lily (LLY), United Parcel Service (UPS), Starbucks (SBUX), General Electric (GE), 3M (MMM), AMD (AMD), ABB (ABB), and FireEye (FEYE).
Wednesday includes reports from Apple (AAPL), Facebook (FB), Qualcomm (QCOM), Boeing (BA), Shopify (SHOP), ServiceNow (NOW), ADP (ADP), Spotify (SPOT), Ford (F), eBay (EBAY), and Teladoc (TDOC).
On Thursday, Amazon (AMZN), Mastercard (MA), Comcast (CMCSA), Thermo Fisher Scientific (TMO), McDonald's (MCD), Baidu (BIDU), Atlassian (TEAM), Twitter (TWTR), Fortinet (FTNT), Royal Caribbean (RCL), and Logitech (LOGI).
Friday will close the big earnings week with Alibaba (BABA), Exxon Mobil (XOM), AbbVie (ABBV), Chevron (CVX), AstraZeneca (AZN), Johnson Controls (JCI), and Komatsu (KMTUY).
It would be an understatement to say this is not an exhaustive list. Check your own portfolio for earnings dates so you aren't surprised.
-=x=-=x=-=x=-=x=-=x=-=x=-=x=-
The Bullish Side
Despite the scare on Thursday, the market gave us a lot to be excited about in the last three days. We saw the advance/decline line finally move above 1.0 as the small caps began to rebound and drive the Russell 2000 higher. With the mega-caps also moving up, it will provide a lot of momentum into next week, possibly getting the Nasdaq to a new all-time high.
More economic news throughout the week should support the view that the economy is booming and drive further positive sentiment to the market. Treasury yields are coming down, making money cheaper again. The USD dollar weakening can be a boost to large multinationals.
Positive earnings reports this week may be just the boost the market needs to head higher.
-=x=-=x=-=x=-=x=-=x=-=x=-=x=-
The Bearish Side
Volume continues to move lower even as the market gains, potentially signaling a top. From the start of the year, the highest volume weeks are red declining weeks. This may be the reduction of retail investors participating in the active market, but it could also be institutions reducing positions.
Any of the economic news events this week could be a negative surprise start a sell-off. Especially any hints from the Fed of monetary policy changes would be received with a big negative reaction.
Positive earnings reports this week may already be priced in, and any disappointing results or guidance will certainly alarm investors.
-=x=-=x=-=x=-=x=-=x=-=x=-=x=-
Key Nasdaq Levels to Watch
The Nasdaq closed above 14,000 two weeks in a row, but can it move toward an all-time high? That's the question for this week.
On the positive side, the levels are:
- 14,062.74 is the high of this week. That will be the first price to beat this week.
- The all-time high is at 14,175.12.
- 14,727 is the middle line of the channel from the March 2020 bottom. The index has been below the midline for the past nine weeks.
On the downside, there are a few key levels:
- The 10d MA is at 13,928.15. The index dipped below this line the past week, but closed above it on Friday.
- The 21d exponential moving average is at 13,739.15.
- The low of this past week is 13,698.67. Let's get a higher low for next week.
- The 50d moving average is at 13,504.97.
- The lower line of the channel from the March 2020 bottom is around 13,360 for next week.
-=x=-=x=-=x=-=x=-=x=-=x=-=x=-
Wrap-up
There are smart people that say the market is extended and positive news and earning reports are already priced in. There are also smart people who believe the recovering economy and support of the Fed is going to send the market higher. I try to see both sides in the market week in review, so how to decide? Follow price.
Next week, with all the earning reports and economic news, the only questions that need to be answered is what happens to the indexes and what happens to the stocks in your portfolio. Live by your investment rules and let them be your guide.
Good luck, stay healthy and trade safe!