The Market Week in Review is my weekend homework where I look over what happened in the previous week and what might come in the next week. It helps me evaluate my observations, recognize new data points, and create a plan for possible scenarios in the future.
I am making some changes to the chart presentation and renaming the series to reflect the other data points I'm including. Still based out of the Nasdaq composite.
I do occasionally have some errors or typos and will correct them in my blog or in the comments on TradingView. I do not have an editor and do this in my free time.
If you find this helpful, please let me know in the comments. I am also more than happy to add new perspectives and data points if you have ideas.
The structure is the following:
If you have been following my daily updates, you can skip down to the “The Meaning of Life”. If not, then this first part is a great play-by-play recap for the week. Click the original charts for more detail each day.
-=x=-=x=-=x=-=x=-=x=-=x=-=x=-
Monday, November 23, 2020
Now take it in but don't look down

Facts: +0.22% higher, Volume lower, Closing range: 55%, Body: 24%
Good: Body and close in upper half of range
Bad: Lower low after morning high
Highs/Lows: Higher high, Lower low
Candle: Body and close in upper half
Advance/Decline: 1.39, more advancing than declining stocks
Sectors: Energy (XLE +7.07%) was the top. Health (XLV -0.26%) and Real Estate (XLRE -0.32%) were at the bottom.
Expectation: Sideways
The Nasdaq continued its march sideways on Monday as the other indexes had gains and the Russell 2000 closed at another all-time high. Investors remain focused on small caps, energy, and industrials as a more positive outlook on the economy is supported by additional vaccine news to end the pandemic. The Nasdaq index closed up +0.22%, but still below 12,000, a resistance level it has been testing for over a week. Volume was just slightly lower than Friday. The outside day candlestick has a 24% negative body in the upper half of the range and a closing range of 55%. There were more advancing stocks than declining stocks as small caps in the index had gains while the larger caps weighed the index down.
-=x=-=x=-=x=-=x=-=x=-=x=-=x=-
Tuesday, November 24, 2020
It's time to begin, isn't it?
Facts: +1.31% higher, Volume higher, Closing range: 93%, Body: 52%
Good: Break through 12,000 on higher volume
Bad: Nothing
Highs/Lows: Higher high, Higher low
Candle: Thick green body in upper half over a long lower wick
Advance/Decline: 2.10, two advancing stock for every declining stock
Sectors: Energy (XLE +5.14%) and Financials (XLF +3.50%) were top. Real Estate (XLRE -0.05%) was the only losing sector.
Expectation: Higher
The Nasdaq finally blew through the 12,000 resistance level today while the other indexes set new highs. The Dow Jones Industrial closed above 30,000 for the first time in its long history. The buying was broad with two advancing stocks for every declining stocks and included some recovery of the mega-caps after so much recent focus on small-caps. The Nasdaq closed with a +1.31% gain on higher volume. The 52% green body in the upper half of the wick resulted in a 93% closing range after the index hit a morning low and never looked back.
-=x=-=x=-=x=-=x=-=x=-=x=-=x=-
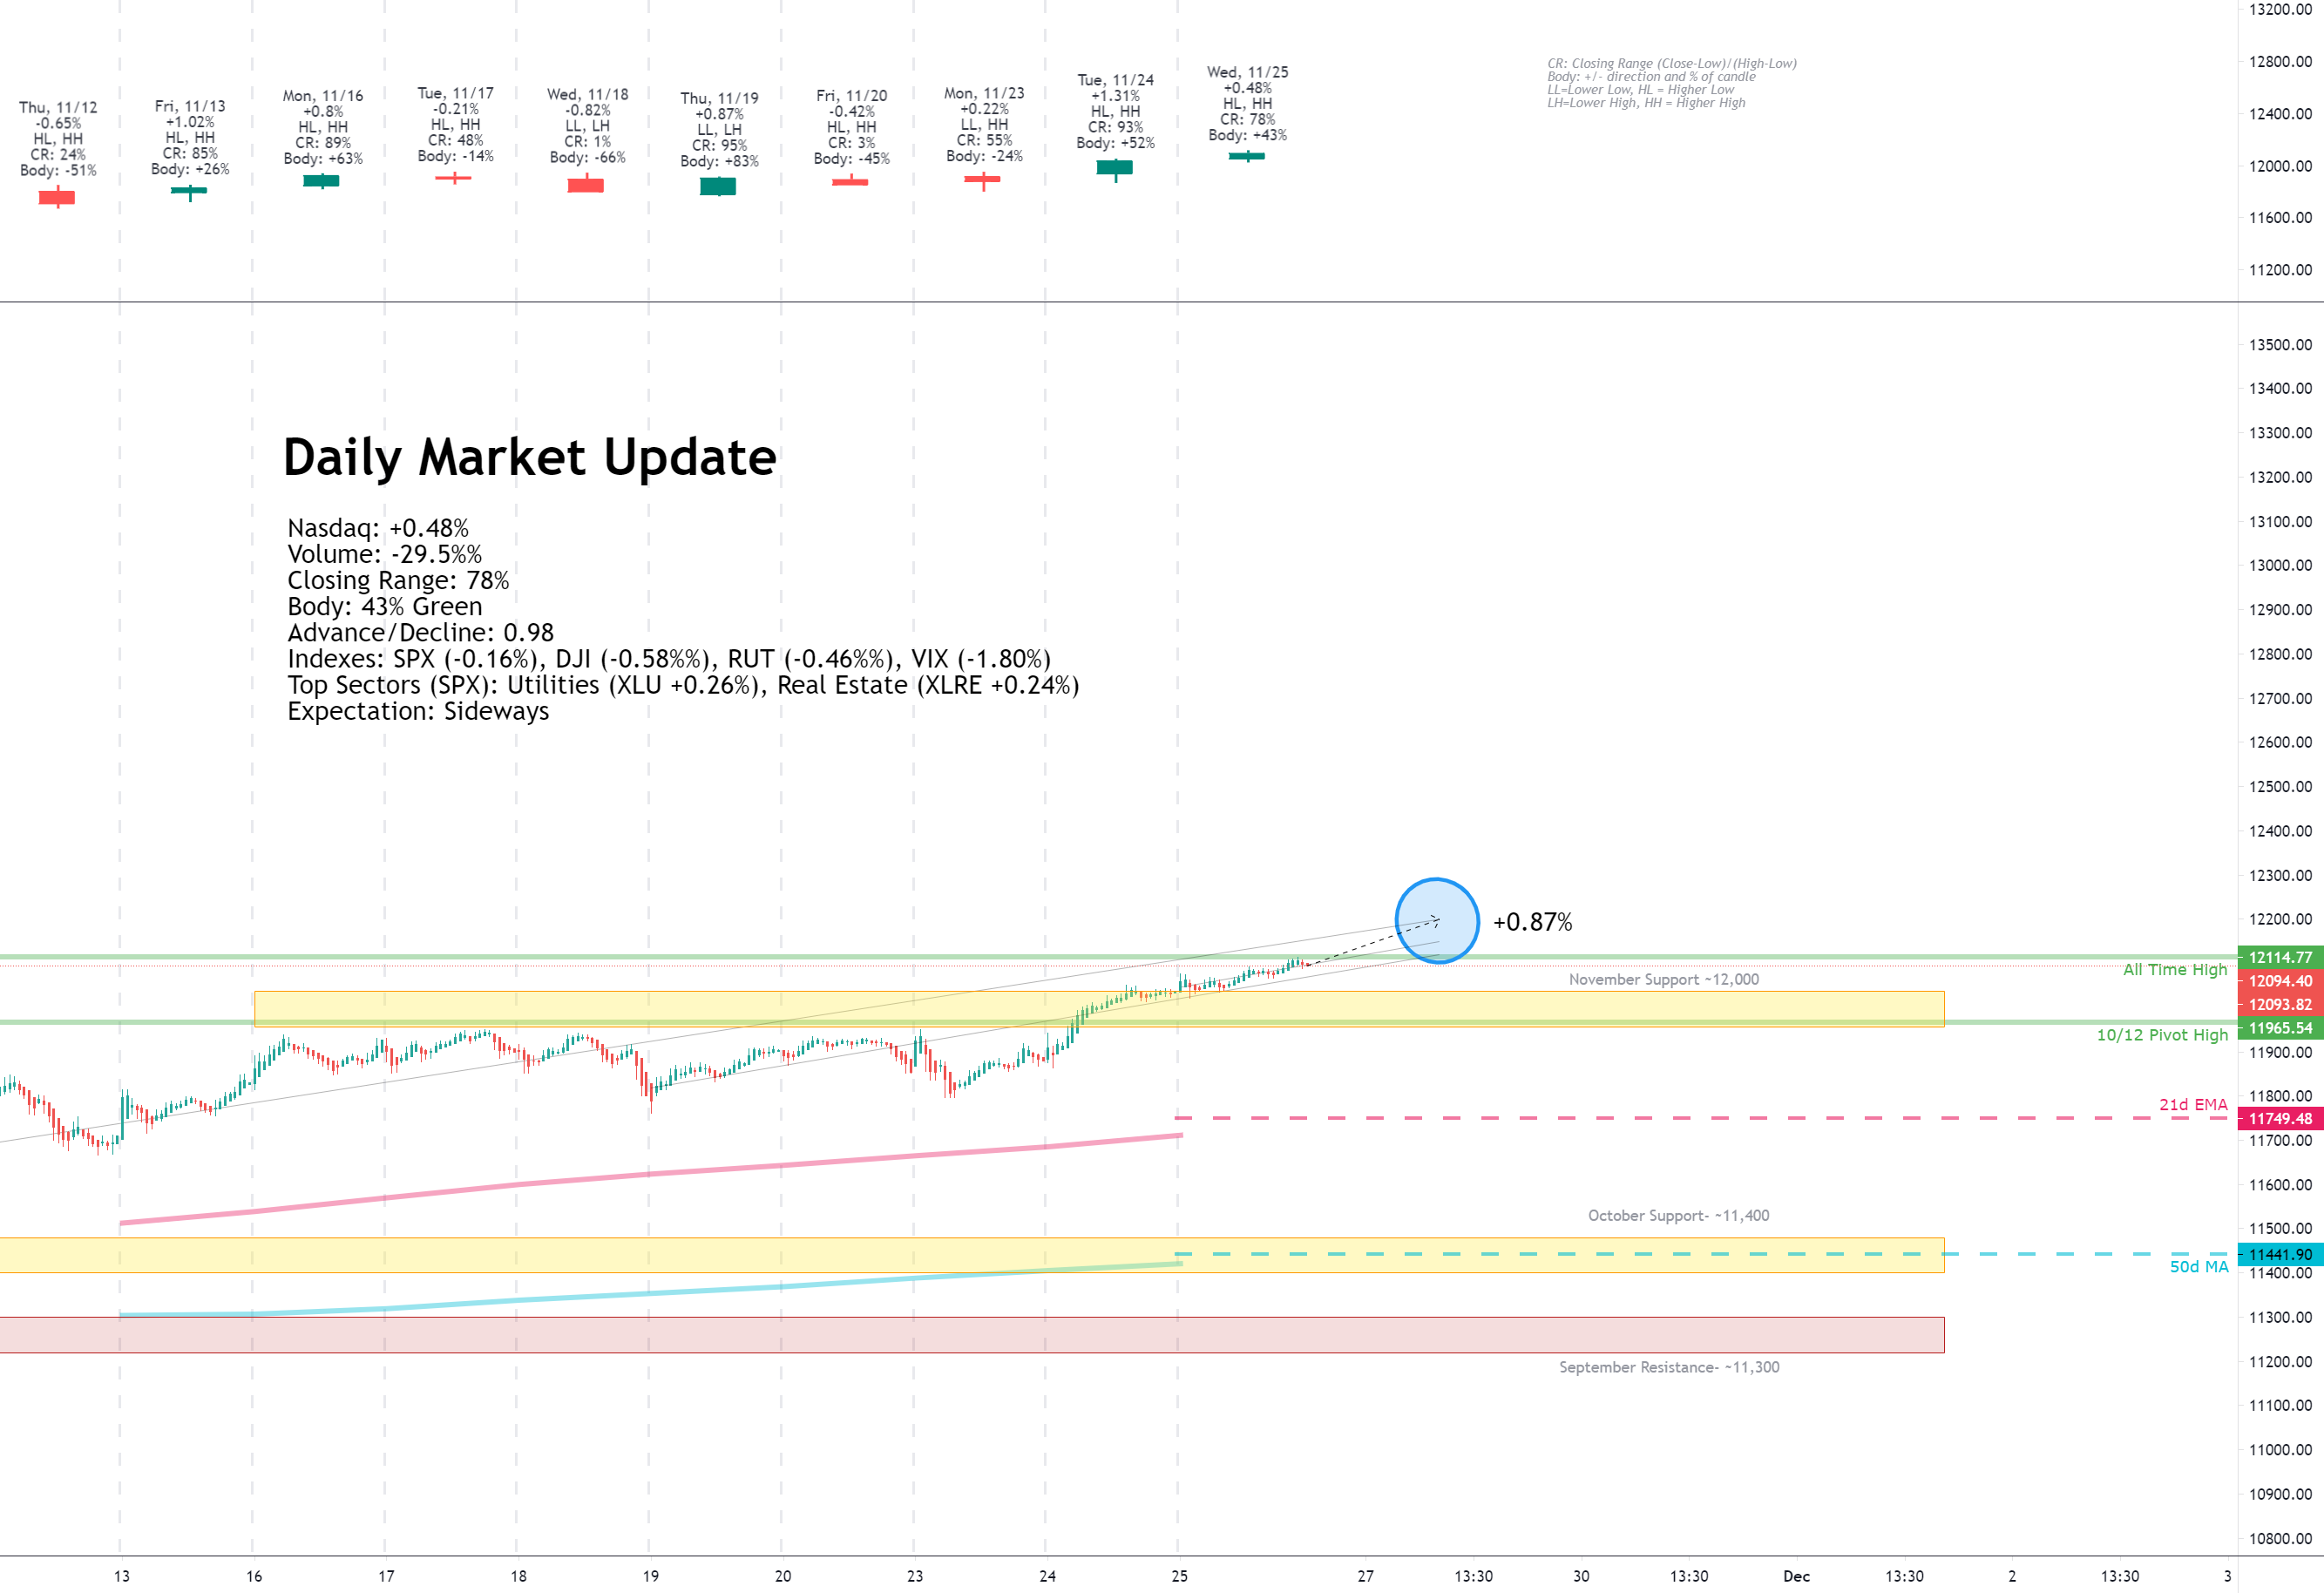
Wednesday, November 25, 2020
You made me a believer, believer
Facts: +0.48% higher, Volume lower, Closing range: 78%, Body: 43%
Good: A new all-time high
Bad: Nothing
Highs/Lows: Higher high, Higher low
Candle: Short candle, with even upper and lower wicks
Advance/Decline: 0.98, about the same number of advancing and declining stocks
Sectors: Utilities (XLU +0.26%) and Real Estate (XLRE +0.24%) were the top sectors. Energy (XLE -2.33%) was the worst performing.
Expectation: Sideways
After a long period of underperforming the other major Indexes, the Nasdaq finally had a day to shine. It closed at a new all-time high while the other indexes had inside days. Volume was lower and traders focused mostly on buying the pullbacks in mid-cap growth stocks. The index closed with a +0.48% gain with a closing range of 78% and most action contained within the middle of the candle. The 43% green body is surrounded by even length upper and lower wicks.
-=x=-=x=-=x=-=x=-=x=-=x=-=x=-
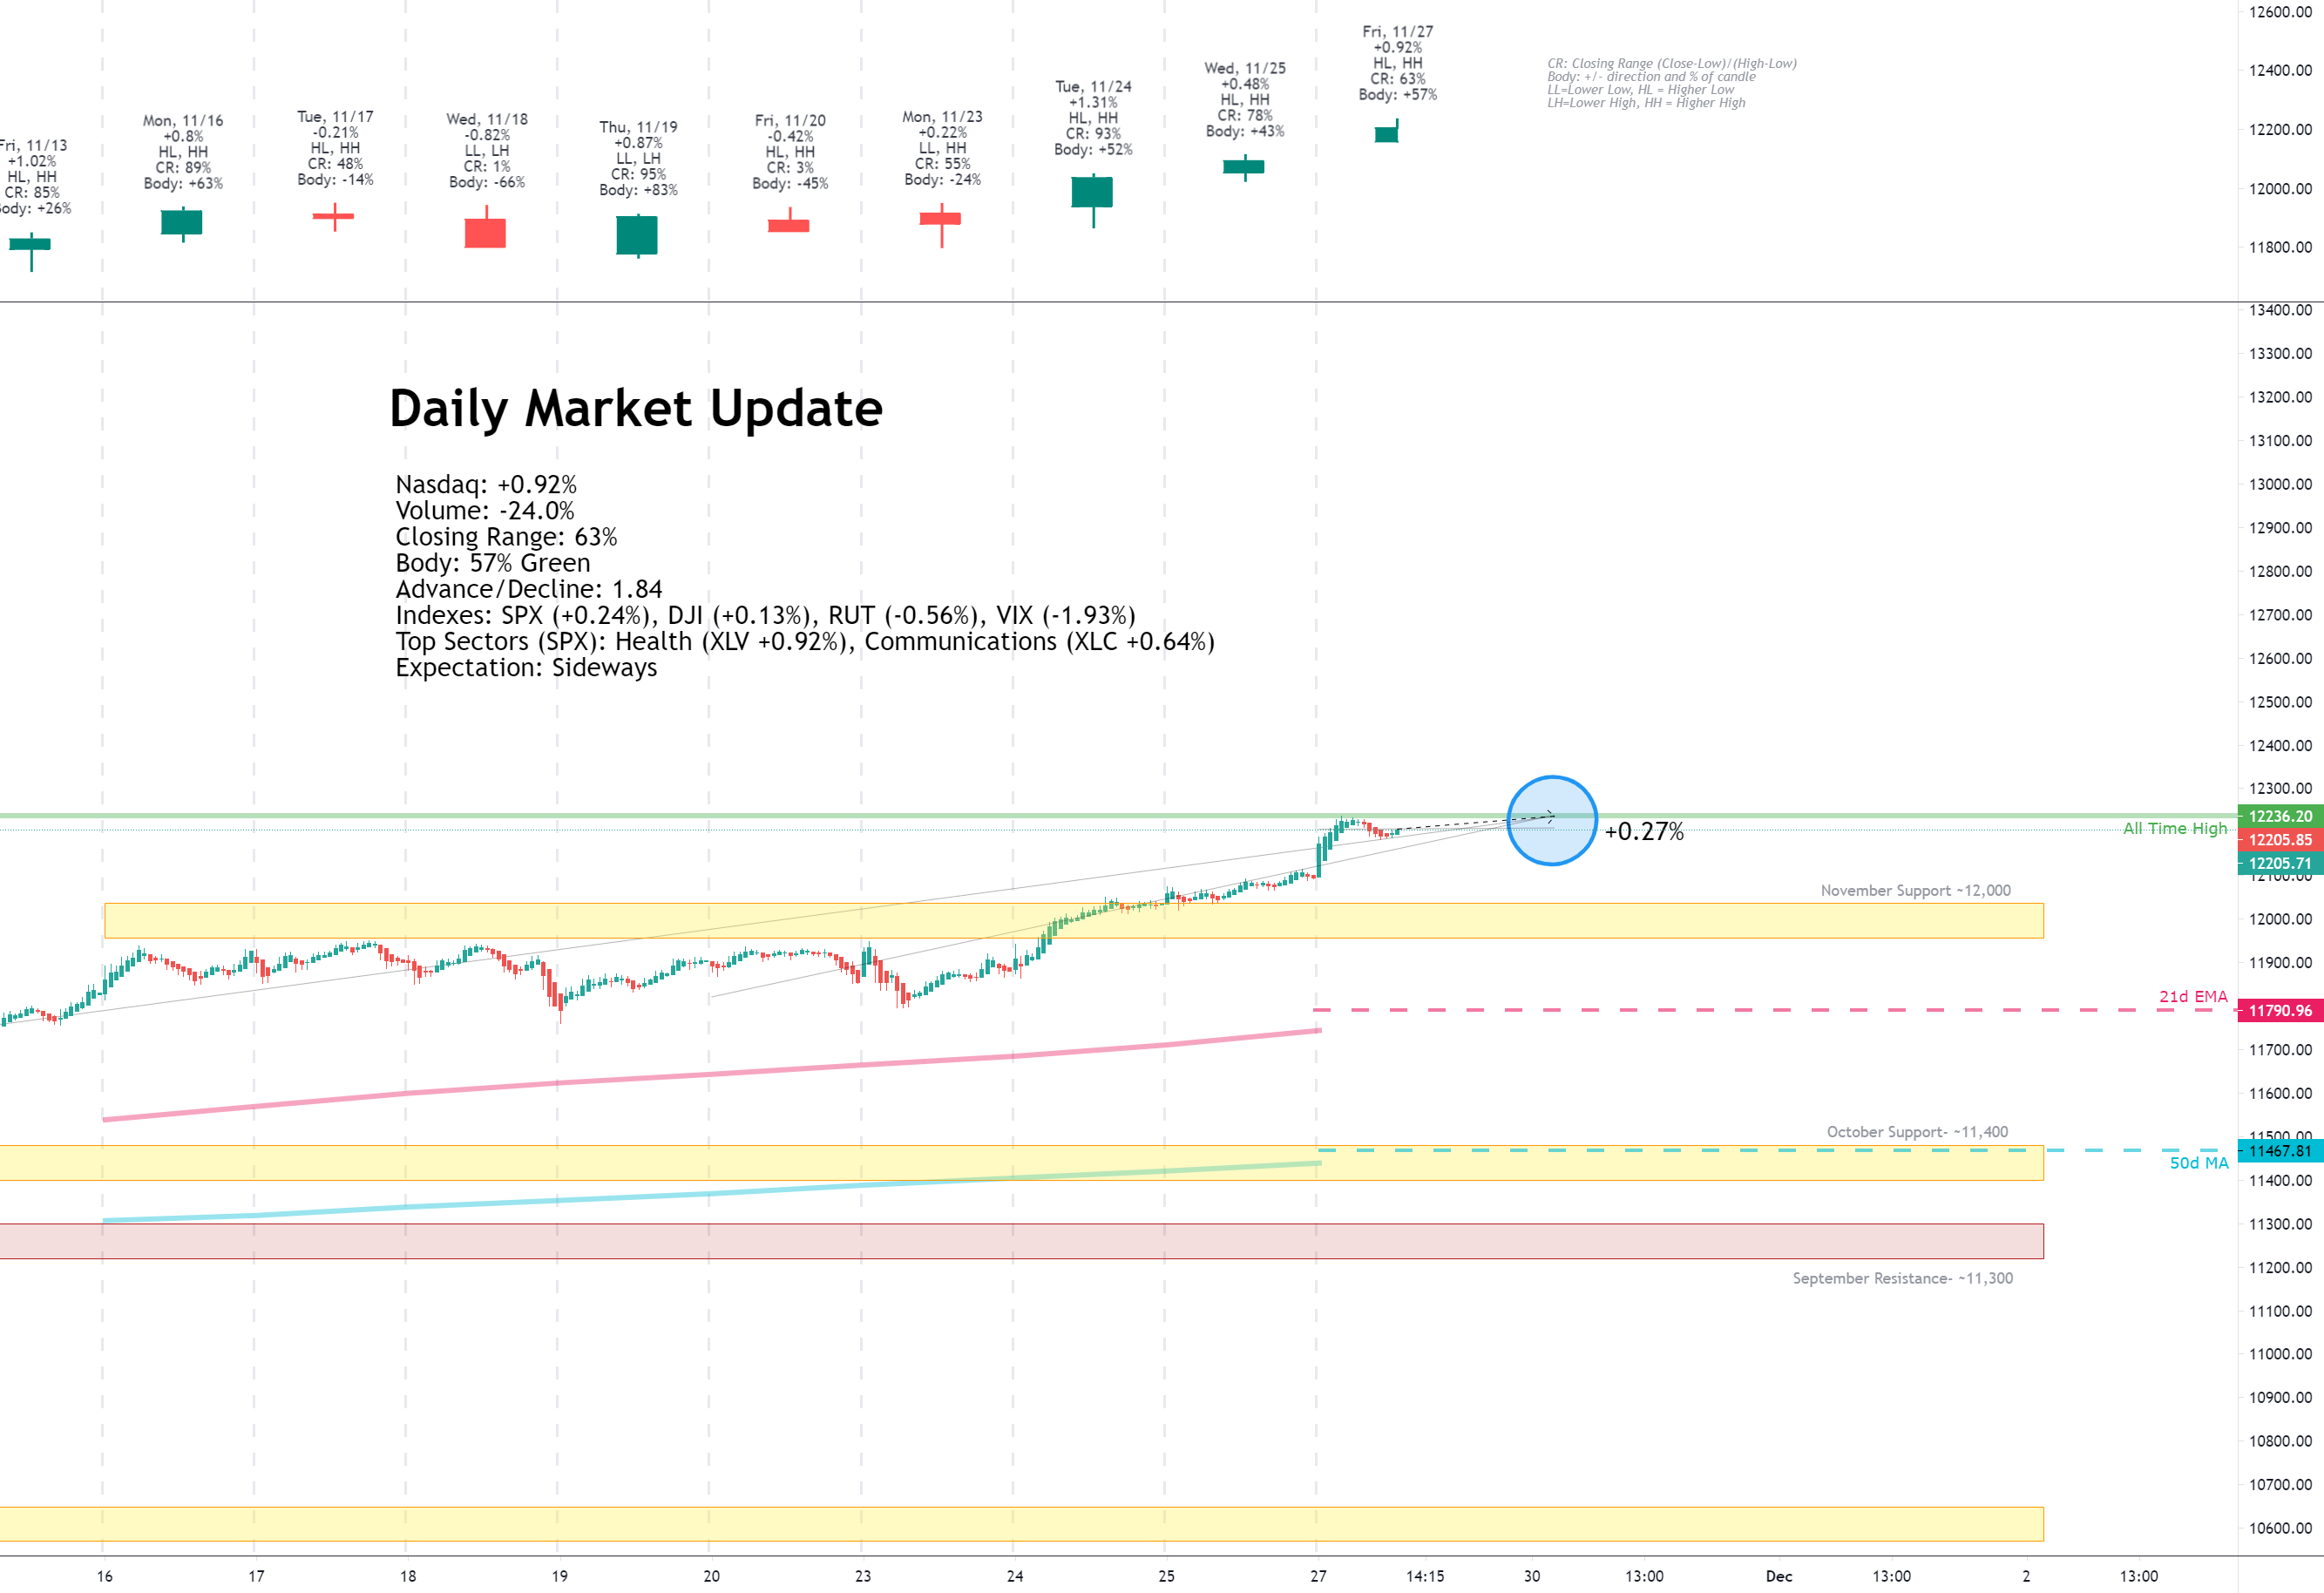
Friday, November 27, 2020
‘Cause you’re a natural, a beating heart of stone
Facts: +0.92% higher, Volume lower, Closing range: 63%, Body: 57%
Good: Did not revisit morning lows, high closing range.
Bad: Could not keep highs, after gap up opening
Highs/Lows: Higher high, Higher low
Candle: 43% upper wick on top of solid green body. No lower wick.
Advance/Decline: 1.84, almost two advancing stocks for each declining stock
Sectors: Health (XLV +0.92%) and Communications (XLC +0.64%) were top sectors. Energy (XLE -1.17%) was the worst preforming.
Expectation: Sideways
The short trading day after Thanksgiving brought a nice gain for the Nasdaq, but on lower volume. The index gapped up in the morning and had steady gains, until mid-morning brought some selling. It finally turned back to the positive just before close. The index finished up +0.92% with a closing range of 63% and a solid green body of 57%. There was no lower wick, but the 43% upper wick shows the selling that occurred after making a new all-time high.
-=x=-=x=-=x=-=x=-=x=-=x=-=x=-
The Meaning of Life (View on the Week)
The short week of trading ended with a +2.96% gain for the Nasdaq (IXIC), outperforming the S&P 500 (SPX +2.27) and the Dow Jones Industrial (DJI +2.21%) average. The Russell 2000 (+3.92%) is still outperforming everything as investors focus on small-caps. The major indexes set new all-time highs this week. The Nasdaq closed the week with a 92% closing range, having a positive gain every day of the week. Volume was lower than the previous week, but still higher than the 10 week moving average. That’s despite only 3.5 days of open markets.
The week began with a focus on the surprise number of travelers at airports over the weekend. That gave a boost to Travel, Transportation, and Leisure stocks as well the Energy sector. American Airlines (AAL) gained 20% in two days. Carnival Corp (CCL) gained 17% in the same period. Marriott (MAR) gained 10%. Exxon Mobile (XOM) gained 13.5%.
On Tuesday, the Consumer Confidence numbers came in less than expected but did not seem to phase the equity markets. It did impact the US Dollar which began a steady decline for the next several days. The declining value of the US Dollar was good news for the stocks of large multi-national companies. That resulted in the mega-caps having a great day and helping the Nasdaq to finally break above 12,000. Tuesday was not so friendly for mid-cap stocks, including many growth stocks. Money rotated out of mid-caps and into small, large, and mega cap stocks.
Wednesday brought more bad news with the Initial Jobless Claims climbed higher than expected. The US Dollar dropped even more, hitting lows not seen since April 2018. However, growth stocks recovered from the previous day losses and the Nasdaq recorded a new all-time high. The other major indexes fell back a bit on Wednesday, having inside days. There was some movement to the Utilities sector at the end of the day to prepare for the market holiday.
The markets were closed on Thursday and reopened Friday for a shortened trading day. As would be expected, volume in the market was lower. The Nasdaq closed at another all-time high.
Energy (XLE) finished another week of huge gains and topped the other sectors for the past three weeks. The sector is up over 40% in the last three weeks. It did pull back a bit on Wednesday and Friday after Exxon Mobile put out a more pessimistic view on future demand. Financials (XLF) also sticks out as a winner for the week, far above the rest of the sectors. The worst performing sectors were Real Estate (XLRE) and Utilities (XLU). Utilities briefly emerged as a leader for Wednesday afternoon as investors parked money in the safe haven sector for the holiday.
Technology (XLK) underperformed the S&P 500 index for a third week, which is odd in a week that the Nasdaq outperformed the S&P 500.
US Treasury Bond Yields finished the week higher than the previous week but did take a step back in Friday trading. The yield spreads for the US30Y-US20Y and US10Y-US02Y both tightened. The longer term trend is still showing investors are more interested in riskier assets than parking money in low yield bonds.
Investors did buy into Corporate Bonds this past week while short-term Treasury Bonds remained flat. The spread between these two widened, signaling optimism in the ability for businesses to pay back debts despite economic headwinds.
The put/call ratio (PCCE) ended the week at an alarming level of 0.505, showing overly bullish sentiment in the market. A contrarian indicator, when the put/call ratio is below 0.7, it signals overly bullish sentiment which typically proceeds a pullback in the market. The indicator was at 0.458 just before the September correction and it was at 0.489 just before the short October correction.
The U.S. Dollar (DXY) lost -0.62% and closed the week below a support area after disappointing Consumer Confidence numbers and higher than expected Initial Jobless Claims. The weaker dollar gave a boost to large multi-national companies who can benefit from stronger performance in exports as well as more value in revenues being repatriated from foreign currencies.
Silver (SLIVER) was down -6% for the week and Gold (GOLD) was down -4% for the week, impacted by the devalued dollar. Crude Oil was up +7.51% as demand continues to increase from summer lows. Timber (WOOD) is still in strong demand gaining another +2.64%. Soybean Futures is at its highest since 2016.
Microsoft (MSFT), Alphabet (GOOGL) and Amazon (AMZN) finished the week with gains. Apple (AAPL) finished the week with a loss. Microsoft, Alphabet and Amazon continue to move sideways since making new highs in August. Weekly volume is still higher on down weeks than it is on up weeks. Alphabet is acting very differently than the other three, with higher volume weeks on gains and lower volume weeks as it has moved sideways the past two weeks. This could be a consolidation before another move higher. I like to keep an eye on the behavior of these four because of their significant influence over the broader indexes.
What is the impact of a weakening dollar on these four mega-caps? For Microsoft and Google, it should give them a boost given how much of their business is in software and services that will not be impacted by increased costs in imports but will benefit from improved value in repatriated revenue. Amazon could be impacted by increased costs of foreign made products, but that may be offset by higher demand for domestic products. Apple seems to be the one that would be most negatively impacted by the weakening dollar, causing the costs of products manufactured overseas to increase in cost and reduce margins.
Slack (WORK) gained almost 40% on Wednesday when Salesforce (CRM) announced they are exploring an acquisition of the popular office messaging app. That would create significant competition for Microsoft and other competitors.
Delta (DAL) had a positive week after surprisingly high travel for Thanksgiving holidays. They also announced a deal with worker unions to reduce pay in exchange for job security through 2022.
Tesla (TSLA) continues to rip upward in anticipation of being added to the S&P 500 on December 21st. The company has moved up five positions in the list of largest public companies by market cap. It is now the eighth largest company.
After two days of significant gains, Exxon Mobil (XOM) pulled back after internal documents showed a pessimistic outlook for future oil demand and prices.
-=x=-=x=-=x=-=x=-=x=-=x=-=x=-
The Week Ahead
The week will begin with OPEC meetings that could have an impact on Crude Oil prices and the Energy sector.
Pending Home Sales data for October will be released on Monday. A disappointing result could put further downward pressure on the US Dollar.
Manufacturing data released on Tuesday will show how much purchasing is happening in over 400 industrial companies to meet future demand. Look at a positive/negative impact in XLI.
Finally, the week will end with more employment data. Expectations are for a lower Initial Jobless Claims which would be positive. But analysts expect payrolls data to decrease. A positive expectation breaker on these could give a boost to the US Dollar and signal better recovery than expected in the economy.
Growth companies including Zoom Video (ZM), Salesforce (CRM), Veeva Systems (VEEV), Crowdstrike (CRWD), ZScaler (ZS), Restoration Hardware (RH), Marvel (MRVL), DocuSign (DOCU) will announce earnings this week. Big Lots (BIG) announces earnings on Friday; look for possible signals in guidance after last week’s Black Friday.
-=x=-=x=-=x=-=x=-=x=-=x=-=x=-
The Bullish Side
The fed released minutes from their most recent meeting, showing they have no intention to end supportive measures of the markets. They will continue bond purchase programs, keeping bond yields low. That will keep money flowing to equities. They will also continue asset purchase programs, providing even more liquidity to equity markets. This remains the most bullish support for the market.
All the major indexes have now cleared resistance and set new all-time highs. Without further overhead supply, demand for equities could continue driving prices higher. The longer the index can stay above this week’s highs, the more support that will be created at the current trading level, providing a pausing point if prices were to come back down. The support would provide more confidence to investors.
Energy (XLE) continues to lead the sectors. This will not last forever but is a bullish sign for a recovering economy. Energy has been the leading sector coming out of most major corrections in the market. Eventually other themes will emerge among the sector list and new market leaders will be established. In the near term, the oil companies still lag improvements in oil prices and overall increased demand. There is more upside here in the short term as sectors recover from summer lows.
A vaccine to COVID could be released in early December. It is reported that major airlines are chartering flights to transport the vaccine as quickly as possible to frontline workers and medical staff. Once the vaccine is released, this could provide more upside momentum for markets already buoyed by stimulus.
-=x=-=x=-=x=-=x=-=x=-=x=-=x=-
The Bearish Side
The amount of optimism in the market right now is extremely high. The put/call ratio is nearing dangerous lows (meaning high bullish sentiment) that typically signal a correction is in order. The indicator was at 0.458 just before the September correction and it was at 0.489 just before the short October correction. It is on a downward trend at 0.505 closing this week. The CNN Fear & Greed index is at 92, the highest level since February of this year. Another contrarian index, the CNN number is usually at its highest right before corrections.
Consumer Confidence and Initial Jobless Claims data this week showed the impact of more lockdowns in the prolonged pandemic. This news could get worse this week as numbers of cases are expected to rise after the Thanksgiving holiday and hospitals become even more overwhelmed with patients. The anticipation of a vaccine could be a moment of “buy the rumor, sell the news”. When the vaccine is finally released, it could have the opposite impact after the market already priced in the eventual release over the past few weeks.
The Fed has signaled that changes in economic conditions, impacted by the pandemic, could be reason for monetary policy changes. Any reduction in support from the Fed could cause an oversized reaction from the market.
-=x=-=x=-=x=-=x=-=x=-=x=-=x=-
Key Nasdaq Levels to Watch
There are several key levels in the Nasdaq to keep an eye out for and respond accordingly. First on the positive side:
On the downside, there are several key levels to raise caution flags:
-=x=-=x=-=x=-=x=-=x=-=x=-=x=-
Wrap-up
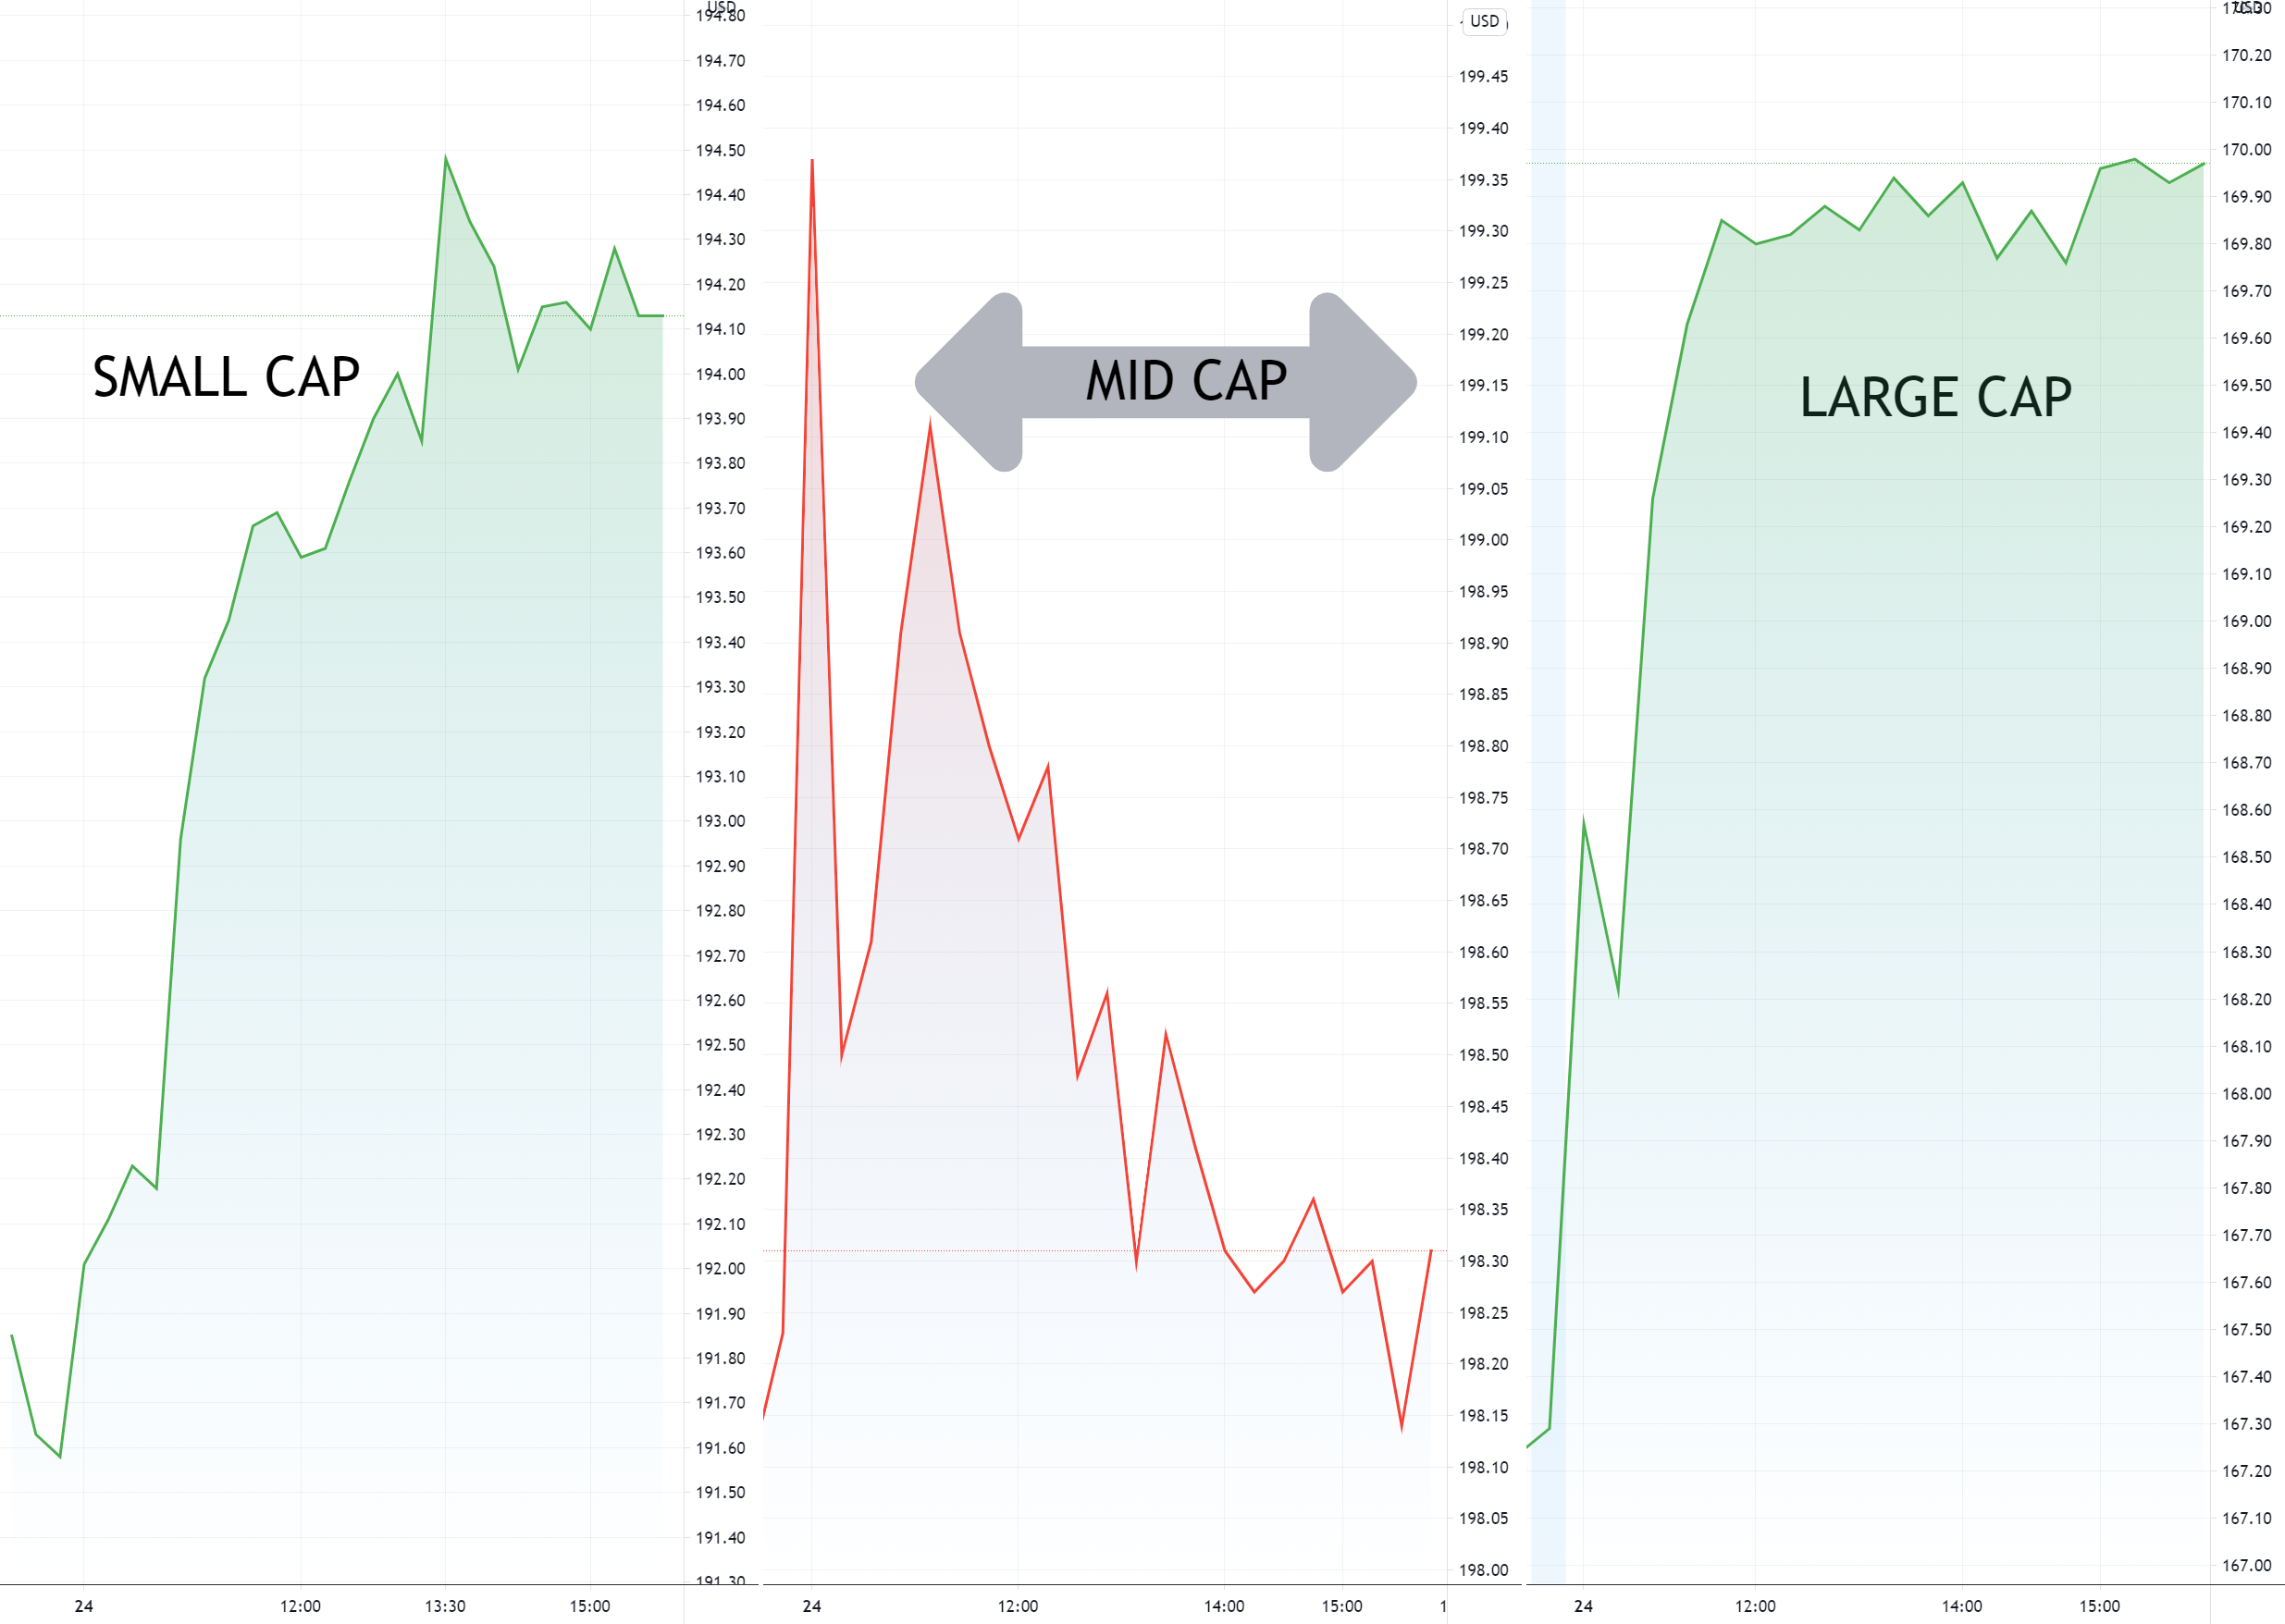
The market had a significant rotation again this past week. Instead of a rotation among sectors or growth vs value, it was a rotation from mid-cap stocks to small-caps and large-caps, including mega-caps. The rotation seemed to result from the weakening of the US Dollar, moving investors to larger multinationals. But investors also continued to move toward small-caps which should benefit the most from economic recovery. Mid-caps took on the damage as the money rotated away from them. As with most rotations, the pendulum swung too far and mid-caps recovered nicely on Wednesday and Friday.
Friday’s positive results are tempered by the lower volume and shorter trading day. Look for a stronger signal on Monday for market direction. Watch out for impact of “buy the rumor, sell the news” on both the vaccine as well as finalizing the election results. While staying invested to profit from market momentum, be sure to keep stop losses in play to protect from sudden changes.
Good luck, stay healthy and trade safe!
I am making some changes to the chart presentation and renaming the series to reflect the other data points I'm including. Still based out of the Nasdaq composite.
I do occasionally have some errors or typos and will correct them in my blog or in the comments on TradingView. I do not have an editor and do this in my free time.
If you find this helpful, please let me know in the comments. I am also more than happy to add new perspectives and data points if you have ideas.
The structure is the following:
- A recap of the daily updates that I do here on TradingView.
- The Meaning of Life, a view on the past week
- What's coming in the next week
- The Bullish View, The Bearish View
- Key index levels to watch out for
- Wrap-up
If you have been following my daily updates, you can skip down to the “The Meaning of Life”. If not, then this first part is a great play-by-play recap for the week. Click the original charts for more detail each day.
-=x=-=x=-=x=-=x=-=x=-=x=-=x=-
Monday, November 23, 2020
Now take it in but don't look down

Facts: +0.22% higher, Volume lower, Closing range: 55%, Body: 24%
Good: Body and close in upper half of range
Bad: Lower low after morning high
Highs/Lows: Higher high, Lower low
Candle: Body and close in upper half
Advance/Decline: 1.39, more advancing than declining stocks
Sectors: Energy (XLE +7.07%) was the top. Health (XLV -0.26%) and Real Estate (XLRE -0.32%) were at the bottom.
Expectation: Sideways
The Nasdaq continued its march sideways on Monday as the other indexes had gains and the Russell 2000 closed at another all-time high. Investors remain focused on small caps, energy, and industrials as a more positive outlook on the economy is supported by additional vaccine news to end the pandemic. The Nasdaq index closed up +0.22%, but still below 12,000, a resistance level it has been testing for over a week. Volume was just slightly lower than Friday. The outside day candlestick has a 24% negative body in the upper half of the range and a closing range of 55%. There were more advancing stocks than declining stocks as small caps in the index had gains while the larger caps weighed the index down.
-=x=-=x=-=x=-=x=-=x=-=x=-=x=-
Tuesday, November 24, 2020
It's time to begin, isn't it?

Facts: +1.31% higher, Volume higher, Closing range: 93%, Body: 52%
Good: Break through 12,000 on higher volume
Bad: Nothing
Highs/Lows: Higher high, Higher low
Candle: Thick green body in upper half over a long lower wick
Advance/Decline: 2.10, two advancing stock for every declining stock
Sectors: Energy (XLE +5.14%) and Financials (XLF +3.50%) were top. Real Estate (XLRE -0.05%) was the only losing sector.
Expectation: Higher
The Nasdaq finally blew through the 12,000 resistance level today while the other indexes set new highs. The Dow Jones Industrial closed above 30,000 for the first time in its long history. The buying was broad with two advancing stocks for every declining stocks and included some recovery of the mega-caps after so much recent focus on small-caps. The Nasdaq closed with a +1.31% gain on higher volume. The 52% green body in the upper half of the wick resulted in a 93% closing range after the index hit a morning low and never looked back.
-=x=-=x=-=x=-=x=-=x=-=x=-=x=-
Wednesday, November 25, 2020
You made me a believer, believer
Facts: +0.48% higher, Volume lower, Closing range: 78%, Body: 43%
Good: A new all-time high
Bad: Nothing
Highs/Lows: Higher high, Higher low
Candle: Short candle, with even upper and lower wicks
Advance/Decline: 0.98, about the same number of advancing and declining stocks
Sectors: Utilities (XLU +0.26%) and Real Estate (XLRE +0.24%) were the top sectors. Energy (XLE -2.33%) was the worst performing.
Expectation: Sideways
After a long period of underperforming the other major Indexes, the Nasdaq finally had a day to shine. It closed at a new all-time high while the other indexes had inside days. Volume was lower and traders focused mostly on buying the pullbacks in mid-cap growth stocks. The index closed with a +0.48% gain with a closing range of 78% and most action contained within the middle of the candle. The 43% green body is surrounded by even length upper and lower wicks.
-=x=-=x=-=x=-=x=-=x=-=x=-=x=-
Friday, November 27, 2020
‘Cause you’re a natural, a beating heart of stone
Facts: +0.92% higher, Volume lower, Closing range: 63%, Body: 57%
Good: Did not revisit morning lows, high closing range.
Bad: Could not keep highs, after gap up opening
Highs/Lows: Higher high, Higher low
Candle: 43% upper wick on top of solid green body. No lower wick.
Advance/Decline: 1.84, almost two advancing stocks for each declining stock
Sectors: Health (XLV +0.92%) and Communications (XLC +0.64%) were top sectors. Energy (XLE -1.17%) was the worst preforming.
Expectation: Sideways
The short trading day after Thanksgiving brought a nice gain for the Nasdaq, but on lower volume. The index gapped up in the morning and had steady gains, until mid-morning brought some selling. It finally turned back to the positive just before close. The index finished up +0.92% with a closing range of 63% and a solid green body of 57%. There was no lower wick, but the 43% upper wick shows the selling that occurred after making a new all-time high.
-=x=-=x=-=x=-=x=-=x=-=x=-=x=-
The Meaning of Life (View on the Week)
The short week of trading ended with a +2.96% gain for the Nasdaq (IXIC), outperforming the S&P 500 (SPX +2.27) and the Dow Jones Industrial (DJI +2.21%) average. The Russell 2000 (+3.92%) is still outperforming everything as investors focus on small-caps. The major indexes set new all-time highs this week. The Nasdaq closed the week with a 92% closing range, having a positive gain every day of the week. Volume was lower than the previous week, but still higher than the 10 week moving average. That’s despite only 3.5 days of open markets.
The week began with a focus on the surprise number of travelers at airports over the weekend. That gave a boost to Travel, Transportation, and Leisure stocks as well the Energy sector. American Airlines (AAL) gained 20% in two days. Carnival Corp (CCL) gained 17% in the same period. Marriott (MAR) gained 10%. Exxon Mobile (XOM) gained 13.5%.
On Tuesday, the Consumer Confidence numbers came in less than expected but did not seem to phase the equity markets. It did impact the US Dollar which began a steady decline for the next several days. The declining value of the US Dollar was good news for the stocks of large multi-national companies. That resulted in the mega-caps having a great day and helping the Nasdaq to finally break above 12,000. Tuesday was not so friendly for mid-cap stocks, including many growth stocks. Money rotated out of mid-caps and into small, large, and mega cap stocks.
Wednesday brought more bad news with the Initial Jobless Claims climbed higher than expected. The US Dollar dropped even more, hitting lows not seen since April 2018. However, growth stocks recovered from the previous day losses and the Nasdaq recorded a new all-time high. The other major indexes fell back a bit on Wednesday, having inside days. There was some movement to the Utilities sector at the end of the day to prepare for the market holiday.
The markets were closed on Thursday and reopened Friday for a shortened trading day. As would be expected, volume in the market was lower. The Nasdaq closed at another all-time high.

Energy (XLE) finished another week of huge gains and topped the other sectors for the past three weeks. The sector is up over 40% in the last three weeks. It did pull back a bit on Wednesday and Friday after Exxon Mobile put out a more pessimistic view on future demand. Financials (XLF) also sticks out as a winner for the week, far above the rest of the sectors. The worst performing sectors were Real Estate (XLRE) and Utilities (XLU). Utilities briefly emerged as a leader for Wednesday afternoon as investors parked money in the safe haven sector for the holiday.
Technology (XLK) underperformed the S&P 500 index for a third week, which is odd in a week that the Nasdaq outperformed the S&P 500.
US Treasury Bond Yields finished the week higher than the previous week but did take a step back in Friday trading. The yield spreads for the US30Y-US20Y and US10Y-US02Y both tightened. The longer term trend is still showing investors are more interested in riskier assets than parking money in low yield bonds.
Investors did buy into Corporate Bonds this past week while short-term Treasury Bonds remained flat. The spread between these two widened, signaling optimism in the ability for businesses to pay back debts despite economic headwinds.
The put/call ratio (PCCE) ended the week at an alarming level of 0.505, showing overly bullish sentiment in the market. A contrarian indicator, when the put/call ratio is below 0.7, it signals overly bullish sentiment which typically proceeds a pullback in the market. The indicator was at 0.458 just before the September correction and it was at 0.489 just before the short October correction.
The U.S. Dollar (DXY) lost -0.62% and closed the week below a support area after disappointing Consumer Confidence numbers and higher than expected Initial Jobless Claims. The weaker dollar gave a boost to large multi-national companies who can benefit from stronger performance in exports as well as more value in revenues being repatriated from foreign currencies.
Silver (SLIVER) was down -6% for the week and Gold (GOLD) was down -4% for the week, impacted by the devalued dollar. Crude Oil was up +7.51% as demand continues to increase from summer lows. Timber (WOOD) is still in strong demand gaining another +2.64%. Soybean Futures is at its highest since 2016.
Microsoft (MSFT), Alphabet (GOOGL) and Amazon (AMZN) finished the week with gains. Apple (AAPL) finished the week with a loss. Microsoft, Alphabet and Amazon continue to move sideways since making new highs in August. Weekly volume is still higher on down weeks than it is on up weeks. Alphabet is acting very differently than the other three, with higher volume weeks on gains and lower volume weeks as it has moved sideways the past two weeks. This could be a consolidation before another move higher. I like to keep an eye on the behavior of these four because of their significant influence over the broader indexes.
What is the impact of a weakening dollar on these four mega-caps? For Microsoft and Google, it should give them a boost given how much of their business is in software and services that will not be impacted by increased costs in imports but will benefit from improved value in repatriated revenue. Amazon could be impacted by increased costs of foreign made products, but that may be offset by higher demand for domestic products. Apple seems to be the one that would be most negatively impacted by the weakening dollar, causing the costs of products manufactured overseas to increase in cost and reduce margins.
Slack (WORK) gained almost 40% on Wednesday when Salesforce (CRM) announced they are exploring an acquisition of the popular office messaging app. That would create significant competition for Microsoft and other competitors.
Delta (DAL) had a positive week after surprisingly high travel for Thanksgiving holidays. They also announced a deal with worker unions to reduce pay in exchange for job security through 2022.
Tesla (TSLA) continues to rip upward in anticipation of being added to the S&P 500 on December 21st. The company has moved up five positions in the list of largest public companies by market cap. It is now the eighth largest company.
After two days of significant gains, Exxon Mobil (XOM) pulled back after internal documents showed a pessimistic outlook for future oil demand and prices.
-=x=-=x=-=x=-=x=-=x=-=x=-=x=-
The Week Ahead
The week will begin with OPEC meetings that could have an impact on Crude Oil prices and the Energy sector.
Pending Home Sales data for October will be released on Monday. A disappointing result could put further downward pressure on the US Dollar.
Manufacturing data released on Tuesday will show how much purchasing is happening in over 400 industrial companies to meet future demand. Look at a positive/negative impact in XLI.
Finally, the week will end with more employment data. Expectations are for a lower Initial Jobless Claims which would be positive. But analysts expect payrolls data to decrease. A positive expectation breaker on these could give a boost to the US Dollar and signal better recovery than expected in the economy.
Growth companies including Zoom Video (ZM), Salesforce (CRM), Veeva Systems (VEEV), Crowdstrike (CRWD), ZScaler (ZS), Restoration Hardware (RH), Marvel (MRVL), DocuSign (DOCU) will announce earnings this week. Big Lots (BIG) announces earnings on Friday; look for possible signals in guidance after last week’s Black Friday.
-=x=-=x=-=x=-=x=-=x=-=x=-=x=-
The Bullish Side
The fed released minutes from their most recent meeting, showing they have no intention to end supportive measures of the markets. They will continue bond purchase programs, keeping bond yields low. That will keep money flowing to equities. They will also continue asset purchase programs, providing even more liquidity to equity markets. This remains the most bullish support for the market.
All the major indexes have now cleared resistance and set new all-time highs. Without further overhead supply, demand for equities could continue driving prices higher. The longer the index can stay above this week’s highs, the more support that will be created at the current trading level, providing a pausing point if prices were to come back down. The support would provide more confidence to investors.
Energy (XLE) continues to lead the sectors. This will not last forever but is a bullish sign for a recovering economy. Energy has been the leading sector coming out of most major corrections in the market. Eventually other themes will emerge among the sector list and new market leaders will be established. In the near term, the oil companies still lag improvements in oil prices and overall increased demand. There is more upside here in the short term as sectors recover from summer lows.
A vaccine to COVID could be released in early December. It is reported that major airlines are chartering flights to transport the vaccine as quickly as possible to frontline workers and medical staff. Once the vaccine is released, this could provide more upside momentum for markets already buoyed by stimulus.
-=x=-=x=-=x=-=x=-=x=-=x=-=x=-
The Bearish Side
The amount of optimism in the market right now is extremely high. The put/call ratio is nearing dangerous lows (meaning high bullish sentiment) that typically signal a correction is in order. The indicator was at 0.458 just before the September correction and it was at 0.489 just before the short October correction. It is on a downward trend at 0.505 closing this week. The CNN Fear & Greed index is at 92, the highest level since February of this year. Another contrarian index, the CNN number is usually at its highest right before corrections.
Consumer Confidence and Initial Jobless Claims data this week showed the impact of more lockdowns in the prolonged pandemic. This news could get worse this week as numbers of cases are expected to rise after the Thanksgiving holiday and hospitals become even more overwhelmed with patients. The anticipation of a vaccine could be a moment of “buy the rumor, sell the news”. When the vaccine is finally released, it could have the opposite impact after the market already priced in the eventual release over the past few weeks.
The Fed has signaled that changes in economic conditions, impacted by the pandemic, could be reason for monetary policy changes. Any reduction in support from the Fed could cause an oversized reaction from the market.
-=x=-=x=-=x=-=x=-=x=-=x=-=x=-
Key Nasdaq Levels to Watch
There are several key levels in the Nasdaq to keep an eye out for and respond accordingly. First on the positive side:
- Look for the Nasdaq to keep near or above the all-time high set last week of 12,236.23.
- The next round-number resistance could come at 12,500 or 13,000. Round-number resistance is caused by traders tendency to put in sell orders at round numbers.
On the downside, there are several key levels to raise caution flags:
- Friday’s low of 12154.57 is above a gap that may need to be filled back to 12,114.77.
- November support area is at 12,000 and a round-number point. Staying above this area is critical to continue the upward trend.
- The 21d EMA is at 11790.66. The index has closed above this moving average line for 17 trading days.
- The 50d MA is at 11,467.81. This line is at the October support area and about 6% below Friday’s close.
- The low of Thursday, Nov 4 is at 11,394.21. There is a gap to fill below that line.
- September Support line is at 11,300. Dropping to this level would be a sure sign of correction.
-=x=-=x=-=x=-=x=-=x=-=x=-=x=-
Wrap-up
The market had a significant rotation again this past week. Instead of a rotation among sectors or growth vs value, it was a rotation from mid-cap stocks to small-caps and large-caps, including mega-caps. The rotation seemed to result from the weakening of the US Dollar, moving investors to larger multinationals. But investors also continued to move toward small-caps which should benefit the most from economic recovery. Mid-caps took on the damage as the money rotated away from them. As with most rotations, the pendulum swung too far and mid-caps recovered nicely on Wednesday and Friday.
Friday’s positive results are tempered by the lower volume and shorter trading day. Look for a stronger signal on Monday for market direction. Watch out for impact of “buy the rumor, sell the news” on both the vaccine as well as finalizing the election results. While staying invested to profit from market momentum, be sure to keep stop losses in play to protect from sudden changes.
Good luck, stay healthy and trade safe!