Date: October 16, 2025
Current Market Context:
As of October 16, 2025, Bitcoin trades at approximately $111,469 USD, reflecting a volatile yet upward trajectory influenced by institutional adoption and macroeconomic factors.
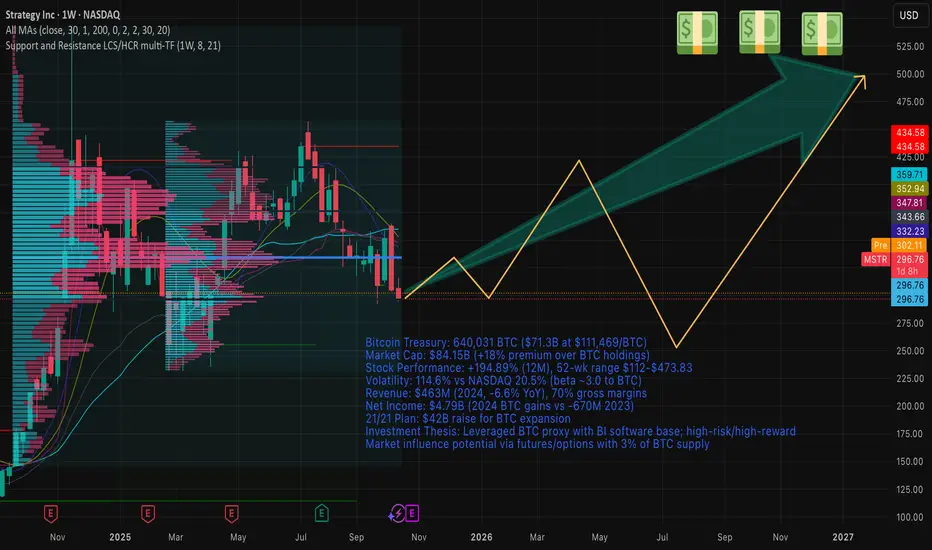
Strategy Inc., formerly MicroStrategy, holds 640,031 BTC, valued at $71.3 billion USD as of today.
The company's market capitalization stands at $84.15 billion USD, representing an 18% premium over its Bitcoin reserve value.
This premium accounts for operational assets, including fixed costs, employee salaries, and intellectual property, while underscoring the market's perception of MSTR as a leveraged Bitcoin proxy.
Notably, the company's substantial BTC holdings enable potential market influence through strategies involving futures and options, allowing for amplified exposure to cryptocurrency volatility.

1. Company Overview
Strategy Inc. (MSTR) is a leading provider of AI-powered enterprise analytics software and services, operating in the business intelligence (BI) and software sector. Founded in 1989 by Michael J. Saylor and Sanju Bansal in Wilmington, Delaware, the company initially focused on data mining and BI tools inspired by systems-dynamics theory from their MIT studies.
It secured its first major client, McDonald's, with a $10 million contract in 1992, driving 100% annual revenue growth from 1990 to 1996. By 1994, the firm relocated to Tysons Corner, Virginia, expanding to 50 employees.
The company went public in 1998 and evolved into a pioneer in BI platforms, offering products like MicroStrategy ONE for non-technical insights and HyperIntelligence for contextual overlays. In August 2020, under Saylor's leadership, Strategy adopted Bitcoin as its primary treasury reserve asset, purchasing 21,454 BTC for $250 million—a move that transformed it into the world's largest corporate Bitcoin holder.
This pivot positioned MSTR as a "Bitcoin spot leveraged ETF" proxy, blending software revenue with cryptocurrency exposure.
In February 2025, it rebranded from MicroStrategy to Strategy Inc. to emphasize its dual focus on analytics and Bitcoin innovation. Today, it serves industries including finance, healthcare, retail, and government, with a global presence across North America, EMEA, LATAM, and APAC.
Strategic Objectives and Corporate Vision
Strategy's vision is to empower organizations with AI-driven analytics while leveraging Bitcoin as a superior store of value against inflation and currency devaluation. Core objectives include:
- Expanding market share in BI through innovative technologies like cloud-native platforms and partnerships.
- Executing the "21/21 Plan": Raising $21 billion in equity and $21 billion in fixed-income instruments over three years to acquire more BTC, enhancing treasury value.
- Balancing software growth (e.g., via Strategy Mosaic for data governance) with Bitcoin strategy for long-term value creation.
Saylor, the Executive Chairman, focuses on Bitcoin acquisitions, while CEO Phong Le oversees operations. The company holds 340 patents, emphasizing innovation in BI and blockchain applications.
2. Financial Analysis
Consolidated Balance Sheet: Last Three Years
Strategy's financials reflect modest BI revenue growth overshadowed by Bitcoin impairments and gains. Data is in USD millions, sourced from annual reports.
| Metric | 2024 | 2023 | 2022 |
|--------------------|---------|---------|---------|
| Total Revenue | 463.0 | 496.0 | 496.0 |
| Cost of Revenue | 138.9 | 148.0 | 152.0 |
| Gross Profit | 324.1 | 348.0 | 344.0 |
| Operating Expenses | -6,660 | 450.0 | 500.0 |
| Operating Income | 6,660 | -102.0 | -156.0 |
| Net Income | 4,790 | -670.8 | -1,470 |
| Gross Margin (%) | 70.1 | 70.2 | 69.4 |
| Net Margin (%) | 1,036.6 | -135.3 | -296.4 |
Volatility stems from Bitcoin fair-value adjustments: 2024 gains drove net income surge, while prior years saw impairments. Revenue declined 6.6% YoY in 2024 due to subscription shifts, but gross margins remain robust at ~70%.
Cash Flow Analysis
Cash flows highlight Bitcoin-driven investing outflows, offset by financing inflows. Data in USD millions.
| Category | 2024 | 2023 | 2022 |
|-------------------------|-------- |---------|---------|
| Operating Cash Flow | 50.1 | 65.0 | 45.0 |
| Investing Cash Flow | -35,630 | -2,100 | -500.0 |
| Financing Cash Flow | 35,500 | 2,050 | 450.0 |
| Net Change in Cash | -80 | 15.0 | -5.0 |
| Free Cash Flow Growth (%) | -1,069 | N/A | N/A |
Operating cash flow remains positive but modest (~$50M in 2024), supporting software operations. Investing activities reflect massive BTC purchases ($35.6B in 2024 via debt/equity raises), while financing provides liquidity through convertible notes and ATM offerings. This structure amplifies BTC exposure but increases dilution risk.
Key Performance Indicators
Financial ratios reveal efficiency in equity utilization but asset strain from BTC leverage.
| Ratio | 2024 | 2023 | 2022 | Interpretation |
|--------------- --|----------|----------|--------|----------------|
| ROE (%) | 18.01 | -25.0 | -40.0 | Strong recovery via BTC gains; measures profitability per equity dollar. |
| ROA (%) | 12.75 | -5.0 | -8.0 | Improved asset efficiency; net income/total assets. |
| ROI (%) | 12.75 | -4.5 | -7.5 | Aligns with ROA; return on invested capital in BTC/software. |
| Debt/Equity | 0.16 | 0.25 | 0.30 | Low leverage; supports BTC strategy without excessive risk. |
| Interest Coverage | 5.2 | 1.5 | 0.8 | Adequate coverage post-2024 gains; EBIT/interest expense. |
ROE surged in 2024 due to unrealized BTC appreciation, calculated as Net Income / Average Shareholders' Equity. ROA = Net Income / Total Assets, highlighting BTC's role in boosting returns despite flat software assets.
Debt Analysis
Total debt stands at $8.21 billion (2024), primarily convertible notes for BTC buys. Debt/Equity ratio of 0.16 indicates conservative leverage, with current ratio at 0.68 signaling short-term liquidity pressure from BTC focus. Interest coverage improved to 5.2x in 2024, mitigating default risk amid rising rates. Strategies include ATM equity sales to repay debt.
3. Market Analysis
Stock Performance: Last 12 Months
MSTR delivered 43.55% returns over the past 12 months (October 2024–October 2025), far outpacing benchmarks. 52-week high: $473.83 (November 2024); low: $112.00 (October 2024). Current price: ~$296.76, with YTD loss of -1.12%.
Volatility and Benchmark Comparison
Annualized volatility: 114.6% (MSTR) vs. 20.5% (NASDAQ) and 15.2% (S&P 500), driven by BTC correlation (beta ~3.0 to BTC). MSTR outperformed S&P 500 (+71% vs. +16%) and NASDAQ over 12 months, but with 7x the volatility.
Sharpe ratio: 1.82 (MSTR) vs. 0.92 (S&P 500), indicating superior risk-adjusted returns.
Competitors and Market Position
In Business Intelligence software, Strategy holds ~1.19% market share, trailing Microsoft Power BI (19.85%) and Tableau (16.11%).
Key competitors: Tableau (Salesforce), Qlik, IBM Cognos, Oracle BI, and Power BI. Strengths include scalability and mobile BI; weaknesses are higher complexity vs. user-friendly rivals.
As a BTC holder, it leads corporates (e.g., vs. Tesla's ~11,000 BTC), positioning MSTR as a unique hybrid: BI challenger with crypto dominance (~3% of BTC supply).
4. Future Outlook
Growth Forecasts: 2025–2028
Analysts project 5–10% annual BI revenue growth to $550M by 2028, driven by AI integrations. BTC holdings could reach 1M+ via 21/21 Plan, implying 20–50% stock upside if BTC hits $150K (base case: $400–$600/share by 2028). EPS growth: 1557% in 2025, stabilizing at 15% CAGR. Overall revenue: $500M–$600M by 2028, with net income tied to BTC (projected $10B+ if holdings appreciate 30% annually).
Expansion Plans, Acquisitions, and Initiatives
- 21/21 Plan: $42B raise for BTC buys; recent $2B preferred stock offering targets Q1 2026.
- Acquisitions: Potential in blockchain/BI (e.g., mobile analytics firms); no major 2025 deals announced.
- Initiatives: Launch of Bitcoin-linked securities; expansion into APAC BI markets; AI enhancements like Strategy One for predictive analytics.
Potential Risks and Mitigation
- Risks: BTC volatility (80% drawdown potential); dilution from equity raises; regulatory scrutiny on crypto holdings; BI competition eroding 1–2% share annually.
- Mitigation: Diversified revenue (BTC as 90% value driver but software as stabilizer); debt refinancing via ATM sales; hedging via futures/options with its BTC hoard for market influence.
Scenario analysis: Base (BTC +20%/yr) yields 25% IRR; bear (BTC -30%) limits downside to 15% via operational cash.
5. Conclusion
Overall Assessment and Investment Potential
Strategy Inc. exemplifies a high-conviction, transformative play: a BI stalwart amplified by Bitcoin's asymmetric upside. With $84.15B market cap trading at an 18% premium to its $71.3B BTC holdings—factoring in ~$500M annual fixed costs, salaries for 1,530 employees, and BI IP—the firm offers leveraged exposure without direct crypto custody risks. Historical 1,620% returns since 2020 validate Saylor's vision, outperforming S&P 500 by 22x. Potential is strong for 2025–2028 if BTC adoption accelerates, with ROE/ROA signaling efficient capital deployment.
Investor Recommendations
Buy/Hold for Growth-Oriented Portfolios: Target $400–$500 by end-2026 (20–50% upside) on BTC momentum; allocate 5–10% for high-risk tolerance.
Strengths: BTC treasury (market influence via derivatives); resilient 70% margins; innovation (340 patents).
Weaknesses: Revenue stagnation (-3.2% CAGR); volatility (114% vs. 20% benchmarks); dilution risk (74% YTD BTC yield via shares).
Conservative investors: Monitor Q4 2025 earnings (Oct 30) for BTC yield updates; diversify with S&P 500 ETFs.
This is not financial advice—consult professionals.
Current Market Context:
As of October 16, 2025, Bitcoin trades at approximately $111,469 USD, reflecting a volatile yet upward trajectory influenced by institutional adoption and macroeconomic factors.
Strategy Inc., formerly MicroStrategy, holds 640,031 BTC, valued at $71.3 billion USD as of today.
The company's market capitalization stands at $84.15 billion USD, representing an 18% premium over its Bitcoin reserve value.
This premium accounts for operational assets, including fixed costs, employee salaries, and intellectual property, while underscoring the market's perception of MSTR as a leveraged Bitcoin proxy.
Notably, the company's substantial BTC holdings enable potential market influence through strategies involving futures and options, allowing for amplified exposure to cryptocurrency volatility.
1. Company Overview
Strategy Inc. (MSTR) is a leading provider of AI-powered enterprise analytics software and services, operating in the business intelligence (BI) and software sector. Founded in 1989 by Michael J. Saylor and Sanju Bansal in Wilmington, Delaware, the company initially focused on data mining and BI tools inspired by systems-dynamics theory from their MIT studies.
It secured its first major client, McDonald's, with a $10 million contract in 1992, driving 100% annual revenue growth from 1990 to 1996. By 1994, the firm relocated to Tysons Corner, Virginia, expanding to 50 employees.
The company went public in 1998 and evolved into a pioneer in BI platforms, offering products like MicroStrategy ONE for non-technical insights and HyperIntelligence for contextual overlays. In August 2020, under Saylor's leadership, Strategy adopted Bitcoin as its primary treasury reserve asset, purchasing 21,454 BTC for $250 million—a move that transformed it into the world's largest corporate Bitcoin holder.
This pivot positioned MSTR as a "Bitcoin spot leveraged ETF" proxy, blending software revenue with cryptocurrency exposure.
In February 2025, it rebranded from MicroStrategy to Strategy Inc. to emphasize its dual focus on analytics and Bitcoin innovation. Today, it serves industries including finance, healthcare, retail, and government, with a global presence across North America, EMEA, LATAM, and APAC.
Strategic Objectives and Corporate Vision
Strategy's vision is to empower organizations with AI-driven analytics while leveraging Bitcoin as a superior store of value against inflation and currency devaluation. Core objectives include:
- Expanding market share in BI through innovative technologies like cloud-native platforms and partnerships.
- Executing the "21/21 Plan": Raising $21 billion in equity and $21 billion in fixed-income instruments over three years to acquire more BTC, enhancing treasury value.
- Balancing software growth (e.g., via Strategy Mosaic for data governance) with Bitcoin strategy for long-term value creation.
Saylor, the Executive Chairman, focuses on Bitcoin acquisitions, while CEO Phong Le oversees operations. The company holds 340 patents, emphasizing innovation in BI and blockchain applications.
2. Financial Analysis
Consolidated Balance Sheet: Last Three Years
Strategy's financials reflect modest BI revenue growth overshadowed by Bitcoin impairments and gains. Data is in USD millions, sourced from annual reports.
| Metric | 2024 | 2023 | 2022 |
|--------------------|---------|---------|---------|
| Total Revenue | 463.0 | 496.0 | 496.0 |
| Cost of Revenue | 138.9 | 148.0 | 152.0 |
| Gross Profit | 324.1 | 348.0 | 344.0 |
| Operating Expenses | -6,660 | 450.0 | 500.0 |
| Operating Income | 6,660 | -102.0 | -156.0 |
| Net Income | 4,790 | -670.8 | -1,470 |
| Gross Margin (%) | 70.1 | 70.2 | 69.4 |
| Net Margin (%) | 1,036.6 | -135.3 | -296.4 |
Volatility stems from Bitcoin fair-value adjustments: 2024 gains drove net income surge, while prior years saw impairments. Revenue declined 6.6% YoY in 2024 due to subscription shifts, but gross margins remain robust at ~70%.
Cash Flow Analysis
Cash flows highlight Bitcoin-driven investing outflows, offset by financing inflows. Data in USD millions.
| Category | 2024 | 2023 | 2022 |
|-------------------------|-------- |---------|---------|
| Operating Cash Flow | 50.1 | 65.0 | 45.0 |
| Investing Cash Flow | -35,630 | -2,100 | -500.0 |
| Financing Cash Flow | 35,500 | 2,050 | 450.0 |
| Net Change in Cash | -80 | 15.0 | -5.0 |
| Free Cash Flow Growth (%) | -1,069 | N/A | N/A |
Operating cash flow remains positive but modest (~$50M in 2024), supporting software operations. Investing activities reflect massive BTC purchases ($35.6B in 2024 via debt/equity raises), while financing provides liquidity through convertible notes and ATM offerings. This structure amplifies BTC exposure but increases dilution risk.
Key Performance Indicators
Financial ratios reveal efficiency in equity utilization but asset strain from BTC leverage.
| Ratio | 2024 | 2023 | 2022 | Interpretation |
|--------------- --|----------|----------|--------|----------------|
| ROE (%) | 18.01 | -25.0 | -40.0 | Strong recovery via BTC gains; measures profitability per equity dollar. |
| ROA (%) | 12.75 | -5.0 | -8.0 | Improved asset efficiency; net income/total assets. |
| ROI (%) | 12.75 | -4.5 | -7.5 | Aligns with ROA; return on invested capital in BTC/software. |
| Debt/Equity | 0.16 | 0.25 | 0.30 | Low leverage; supports BTC strategy without excessive risk. |
| Interest Coverage | 5.2 | 1.5 | 0.8 | Adequate coverage post-2024 gains; EBIT/interest expense. |
ROE surged in 2024 due to unrealized BTC appreciation, calculated as Net Income / Average Shareholders' Equity. ROA = Net Income / Total Assets, highlighting BTC's role in boosting returns despite flat software assets.
Debt Analysis
Total debt stands at $8.21 billion (2024), primarily convertible notes for BTC buys. Debt/Equity ratio of 0.16 indicates conservative leverage, with current ratio at 0.68 signaling short-term liquidity pressure from BTC focus. Interest coverage improved to 5.2x in 2024, mitigating default risk amid rising rates. Strategies include ATM equity sales to repay debt.
3. Market Analysis
Stock Performance: Last 12 Months
MSTR delivered 43.55% returns over the past 12 months (October 2024–October 2025), far outpacing benchmarks. 52-week high: $473.83 (November 2024); low: $112.00 (October 2024). Current price: ~$296.76, with YTD loss of -1.12%.
Volatility and Benchmark Comparison
Annualized volatility: 114.6% (MSTR) vs. 20.5% (NASDAQ) and 15.2% (S&P 500), driven by BTC correlation (beta ~3.0 to BTC). MSTR outperformed S&P 500 (+71% vs. +16%) and NASDAQ over 12 months, but with 7x the volatility.
Sharpe ratio: 1.82 (MSTR) vs. 0.92 (S&P 500), indicating superior risk-adjusted returns.
Competitors and Market Position
In Business Intelligence software, Strategy holds ~1.19% market share, trailing Microsoft Power BI (19.85%) and Tableau (16.11%).
Key competitors: Tableau (Salesforce), Qlik, IBM Cognos, Oracle BI, and Power BI. Strengths include scalability and mobile BI; weaknesses are higher complexity vs. user-friendly rivals.
As a BTC holder, it leads corporates (e.g., vs. Tesla's ~11,000 BTC), positioning MSTR as a unique hybrid: BI challenger with crypto dominance (~3% of BTC supply).
4. Future Outlook
Growth Forecasts: 2025–2028
Analysts project 5–10% annual BI revenue growth to $550M by 2028, driven by AI integrations. BTC holdings could reach 1M+ via 21/21 Plan, implying 20–50% stock upside if BTC hits $150K (base case: $400–$600/share by 2028). EPS growth: 1557% in 2025, stabilizing at 15% CAGR. Overall revenue: $500M–$600M by 2028, with net income tied to BTC (projected $10B+ if holdings appreciate 30% annually).
Expansion Plans, Acquisitions, and Initiatives
- 21/21 Plan: $42B raise for BTC buys; recent $2B preferred stock offering targets Q1 2026.
- Acquisitions: Potential in blockchain/BI (e.g., mobile analytics firms); no major 2025 deals announced.
- Initiatives: Launch of Bitcoin-linked securities; expansion into APAC BI markets; AI enhancements like Strategy One for predictive analytics.
Potential Risks and Mitigation
- Risks: BTC volatility (80% drawdown potential); dilution from equity raises; regulatory scrutiny on crypto holdings; BI competition eroding 1–2% share annually.
- Mitigation: Diversified revenue (BTC as 90% value driver but software as stabilizer); debt refinancing via ATM sales; hedging via futures/options with its BTC hoard for market influence.
Scenario analysis: Base (BTC +20%/yr) yields 25% IRR; bear (BTC -30%) limits downside to 15% via operational cash.
5. Conclusion
Overall Assessment and Investment Potential
Strategy Inc. exemplifies a high-conviction, transformative play: a BI stalwart amplified by Bitcoin's asymmetric upside. With $84.15B market cap trading at an 18% premium to its $71.3B BTC holdings—factoring in ~$500M annual fixed costs, salaries for 1,530 employees, and BI IP—the firm offers leveraged exposure without direct crypto custody risks. Historical 1,620% returns since 2020 validate Saylor's vision, outperforming S&P 500 by 22x. Potential is strong for 2025–2028 if BTC adoption accelerates, with ROE/ROA signaling efficient capital deployment.
Investor Recommendations
Buy/Hold for Growth-Oriented Portfolios: Target $400–$500 by end-2026 (20–50% upside) on BTC momentum; allocate 5–10% for high-risk tolerance.
Strengths: BTC treasury (market influence via derivatives); resilient 70% margins; innovation (340 patents).
Weaknesses: Revenue stagnation (-3.2% CAGR); volatility (114% vs. 20% benchmarks); dilution risk (74% YTD BTC yield via shares).
Conservative investors: Monitor Q4 2025 earnings (Oct 30) for BTC yield updates; diversify with S&P 500 ETFs.
This is not financial advice—consult professionals.
Related publications
Disclaimer
The information and publications are not meant to be, and do not constitute, financial, investment, trading, or other types of advice or recommendations supplied or endorsed by TradingView. Read more in the Terms of Use.
Related publications
Disclaimer
The information and publications are not meant to be, and do not constitute, financial, investment, trading, or other types of advice or recommendations supplied or endorsed by TradingView. Read more in the Terms of Use.