🚀 NASDAQ100 / US100 Index – Thief Money Heist Plan 🎭
📌 Plan: Bullish Swing / Scalping Setup
Dear Ladies & Gentlemen (Thief OG’s), here’s the heist-style breakdown for US100 🔑:
🏴☠️ Entry Style (Thief Layering Strategy)
Using layered limit orders for flexibility & precision:
• 23200.0
• 23250.0
• 23300.0
• 23350.0
(You may increase limit layers based on your strategy & risk appetite)
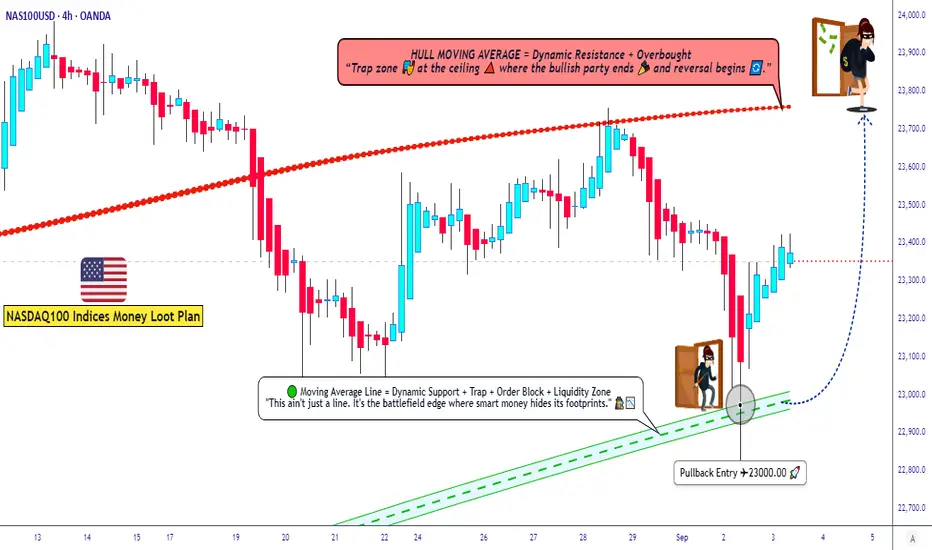
📉 Moving Average Pullback Entry Plan
• Buy entries on pullbacks to the Fibo level 382 Triangular Moving average zone.
• Look for bullish candles confirming the bounce from these MAs.
• This offers better risk-to-reward by catching momentum on retracements instead of chasing highs.
❓ Why This Works?
• Moving averages often act as dynamic support/resistance in trending markets.
• Institutional traders & algos track them heavily, making them high-probability zones.
• Combining with layering entries = higher flexibility + reduced risk of mistimed single entry.
🛡️ Stop Loss (Protect the Vault)
• Thief SL: @23000.0
• Reminder: Adjust your SL based on your own strategy & risk tolerance.
🎯 Target (Escape Zone)
• Overbought + Trap Zone ahead!
• Escape target: @23750.0
• Note: Don’t rely only on my TP — secure profits at your own pace and risk.
📊 US100 Index CFD Real-Time Data Sep 03
📈 Daily Change: +133.47 (+0.57%)
📅 Monthly Performance: +0.76%
📆 Yearly Performance: +23.48%
😰😊 Fear & Greed Index
📊 Current Reading: 53/100 (Neutral)
🧐 Interpretation: Market sentiment is balanced, showing neither extreme fear nor greed. Investors are cautious but not panicked.
🧠 Retail vs. Institutional Sentiment
👥 Retail Traders: Moderately bullish (55% Long, 45% Short)
🏦 Institutional Traders: Slightly cautious (50% Long, 50% Short)
🔑 Key Drivers: Mixed signals from manufacturing data and upcoming labor market reports.
📉📈 Fundamental & Macro Score
📊 Macro Score: 6/10
Manufacturing PMI (48.7) still in contraction but improving.
Labor market data (JOLTS) awaited for clarity.
⚡ Volatility Score: 5/10 (Moderate)
VIX near average levels, indicating stable expectations.
💧 Liquidity Score: 7/10
Strong volume and breadth in large-cap tech stocks.
🐂🐻 Overall Market Outlook
✅ Bullish (Long): 60%
Supported by strong yearly gains and resilience in big tech.
⚠️ Bearish (Short): 40%
Concerns over manufacturing contraction and inflation pressures.
💡 Key Takeaways
📈 US100 is trending mildly positive today (+0.57%).
😐 Sentiment is neutral—no extreme fear or greed.
📊 Macro data hints at cautious optimism but watch for upcoming labor reports.
🐂 Overall bias leans slightly bullish for long-term holders.
📊 Related Pairs to Watch
 SPX500
 DJI
DJI
 VIX
VIX
 NDX
NDX
 USDOLLAR
✨ “If you find value in my analysis, a 👍 and 🚀 boost is much appreciated — it helps me share more setups with the community!”
#NASDAQ100 #US100 #NDX #SPX500 #DJI #TradingView #SwingTrade #ScalpTrading #LayeringStrategy #MarketAnalysis
📌 Plan: Bullish Swing / Scalping Setup
Dear Ladies & Gentlemen (Thief OG’s), here’s the heist-style breakdown for US100 🔑:
🏴☠️ Entry Style (Thief Layering Strategy)
Using layered limit orders for flexibility & precision:
• 23200.0
• 23250.0
• 23300.0
• 23350.0
(You may increase limit layers based on your strategy & risk appetite)
📉 Moving Average Pullback Entry Plan
• Buy entries on pullbacks to the Fibo level 382 Triangular Moving average zone.
• Look for bullish candles confirming the bounce from these MAs.
• This offers better risk-to-reward by catching momentum on retracements instead of chasing highs.
❓ Why This Works?
• Moving averages often act as dynamic support/resistance in trending markets.
• Institutional traders & algos track them heavily, making them high-probability zones.
• Combining with layering entries = higher flexibility + reduced risk of mistimed single entry.
🛡️ Stop Loss (Protect the Vault)
• Thief SL: @23000.0
• Reminder: Adjust your SL based on your own strategy & risk tolerance.
🎯 Target (Escape Zone)
• Overbought + Trap Zone ahead!
• Escape target: @23750.0
• Note: Don’t rely only on my TP — secure profits at your own pace and risk.
📊 US100 Index CFD Real-Time Data Sep 03
📈 Daily Change: +133.47 (+0.57%)
📅 Monthly Performance: +0.76%
📆 Yearly Performance: +23.48%
😰😊 Fear & Greed Index
📊 Current Reading: 53/100 (Neutral)
🧐 Interpretation: Market sentiment is balanced, showing neither extreme fear nor greed. Investors are cautious but not panicked.
🧠 Retail vs. Institutional Sentiment
👥 Retail Traders: Moderately bullish (55% Long, 45% Short)
🏦 Institutional Traders: Slightly cautious (50% Long, 50% Short)
🔑 Key Drivers: Mixed signals from manufacturing data and upcoming labor market reports.
📉📈 Fundamental & Macro Score
📊 Macro Score: 6/10
Manufacturing PMI (48.7) still in contraction but improving.
Labor market data (JOLTS) awaited for clarity.
⚡ Volatility Score: 5/10 (Moderate)
VIX near average levels, indicating stable expectations.
💧 Liquidity Score: 7/10
Strong volume and breadth in large-cap tech stocks.
🐂🐻 Overall Market Outlook
✅ Bullish (Long): 60%
Supported by strong yearly gains and resilience in big tech.
⚠️ Bearish (Short): 40%
Concerns over manufacturing contraction and inflation pressures.
💡 Key Takeaways
📈 US100 is trending mildly positive today (+0.57%).
😐 Sentiment is neutral—no extreme fear or greed.
📊 Macro data hints at cautious optimism but watch for upcoming labor reports.
🐂 Overall bias leans slightly bullish for long-term holders.
📊 Related Pairs to Watch
✨ “If you find value in my analysis, a 👍 and 🚀 boost is much appreciated — it helps me share more setups with the community!”
#NASDAQ100 #US100 #NDX #SPX500 #DJI #TradingView #SwingTrade #ScalpTrading #LayeringStrategy #MarketAnalysis
Trade active
Trade closed: target reached
📈 US100 INDEX CFD Live SnapshotQuick Take: Tech-driven US100 holds steady amid balanced macro signals, with a slight pullback from recent peaks. Real data breakdown ahead – crisp, no extras. 🚀
💹 Live Market Pulse
Current Level: 24,992.00
Daily Move: Down 118.00 points (-0.47%)
Explanation: Index reflects Nasdaq 100 futures close from prior session, trading flat to soft in early hours on profit-taking in semis. Average volume points to consolidation, not reversal – ideal for CFD scalps on any intraday bounce. As a trader, pair this with VIX for entry cues; spot price syncs tight for leveraged plays.
🔍 Fundamental & Macro Score Points
These key economic pillars drive US100 direction. Scored simply: 🟢 Strong (growth booster), 🟡 Neutral (even keel), 🔴 Weak (drag). Pulled from fresh releases only.
Interest Rates: Fed Funds at 4.00%-4.25% (post-Sep adjustment). 🟢 Strong. Lower target range cuts corporate debt costs, sparking capex in tech giants – direct lift for index leaders like the Magnificent 7.
Inflation Rates: CPI at 2.9% (Aug YoY). 🟡 Neutral. Mild uptick from July but anchored near Fed's 2% goal, allowing steady policy without shocks. Keeps input prices tame for US100's consumer-facing names.
GDP Rates: 3.8% growth (Q2 final; Q3 estimate steady). 🟢 Strong. Solid expansion fuels tech demand via robust jobs and spending – AI/cloud sectors ride this wave for sustained rallies.
Trader Tip: Easing rates plus GDP muscle scream opportunity, but eye CPI's next print for any hawkish twist. Stack these for multi-timeframe bias.
🌦️ Seasonal Tendencies
October Historical Edge: Average +2.5% gain – second-strongest month for US100 since 1990.
Explanation: Backtested data highlights fall strength from holiday build-up and earnings cycles. Patterns hold in 70%+ of years; use as tailwind confirmation, not standalone trigger. As a trader, overlay with volume for high-conviction longs. 🍂📈
🏦 Bank Orders (Institutional Flow)
Latest CFTC Snapshot: Net long positioning in Nasdaq futures from managed money (as of Sep 23 data).
Explanation: Institutions hold 51.3% long vs. 61.3% short overall, but non-comms tilt bullish with reduced spreads. Signals pro accumulation ahead of Q4 – "smart money" often precedes retail moves.
😊 Trader Sentiment Outlook
Retail Traders: 65% Long / 35% Short (bullish lean from broker flows).
Institutional Traders: 70% Long / 30% Short (firm pro edge).
Explanation: Retail dips in with optimism on tech rebounds; instos amplify via futures. Overall pulse: Mild greed without froth – tracks via options ratios. Pro note: Watch for 80% retail extremes to counter-trade; here, alignment favors upside.
😱 Fear & Greed Index
Current Reading: 54 (Neutral)
Explanation: Even split across volatility, momentum, and breadth metrics – no overheated chase, no flight to safety. Blends VIX dips with steady breadth for balanced read. Neutral leaves doors open; trade the edges.
🐂🐻 Overall Market Outlook Score
Bull (Long) – 7/10 Confidence
Explanation: Seasonal lift and macro greens trump minor dips; rate cuts + GDP keep momentum alive into year-end. Bear watch: Inflation creep or flow reversals, but prints say hold the line. Trader's edge: Real data like this sharpens setups – risk smart! 💪
💰 Money-Making Analysis
• Forex💹
• Indices📈
• Crypto ₿
• Commodities⚡
• Stocks🏦
• Fundamental + Macro📊
• Sentiment🔎
👉 Ask what analysis you need & get it FREE!
Join Discord for signals + data & grab the Master Plan: discord.gg/ZQS3y7FhVr
• Forex💹
• Indices📈
• Crypto ₿
• Commodities⚡
• Stocks🏦
• Fundamental + Macro📊
• Sentiment🔎
👉 Ask what analysis you need & get it FREE!
Join Discord for signals + data & grab the Master Plan: discord.gg/ZQS3y7FhVr
Related publications
Disclaimer
The information and publications are not meant to be, and do not constitute, financial, investment, trading, or other types of advice or recommendations supplied or endorsed by TradingView. Read more in the Terms of Use.