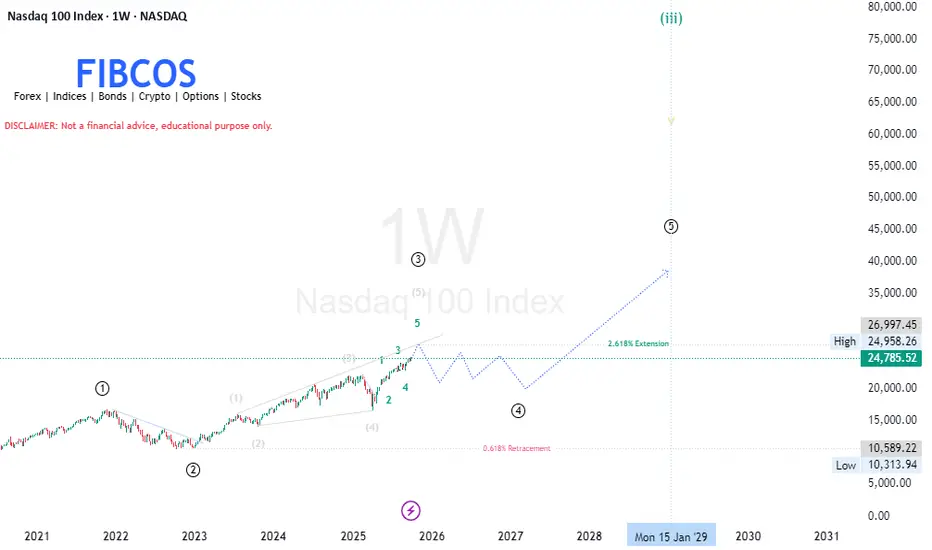
The index (NASDAQ) continues its macro impulsive structure, now expanding through Wave (3) — targeting the 2.618 Fibonacci extension near 26,997(27K).
Smart Money is driving this leg with clear bullish order flow, creating multiple Fair Value Gaps and Breaks of Structure along the way.
After this expansion, we expect a Wave (4) correction between 22,000–17,500, where institutional demand zones await for re-accumulation before the next macro bullish leg (Wave 5) toward 35,000–38,000.
📊 Confluence Highlights:
Wave (3) → 2.618 extension (target zone: 26.9K–27K)
Wave (4) → 0.382–0.618 retracement (zone: 22K–18K)
Wave (5) → 1.618 projection (target zone: 35K–38K)
🧠 Elliott Wave Theory Interpretation
① Wave (1) — The Initial Expansion (2020–2021)
Early bullish impulse following pandemic recovery.
Represents Smart Money accumulation followed by a breakout.
Retail participation remains limited; institutional footprints dominate.
② Wave (2) — Corrective Pullback (2022–2023)
Sharp decline toward the 0.618 Fibonacci retracement zone.
This phase was a liquidity grab — Smart Money re-entering after shaking out weak hands.
Price formed a higher low, maintaining long-term bullish structure.
③ Wave (3) — The Power Leg (2023–2026)
The strongest and most extended wave — aligned perfectly with the 2.618 Fibonacci extension (~26,997 zone).
Confirms institutional markup phase, where:
Retail short sellers are trapped.
Fair Value Gaps (FVGs) are created during impulsive moves.
Continuous Break of Structure (BOS) validates bullish order flow.
Smaller degree sub-waves (1–5) visible inside, confirming internal impulse rhythm.
④ Wave (4) — The Upcoming Correction (2026–2027)
Expected macro re-accumulation zone, likely between 22,000 – 17,500.
Market may enter a sideways complex correction (W–X–Y)/(W-X-Y-X-Z) pattern.
This is the Smart Money re-accumulation phase — liquidity collection before the next macro expansion.
Demand zones: previous unmitigated order blocks around 20,000–18,000 area.
⑤ Wave (5) — The Final Expansion (2028–2029)
After consolidation, the index may aim for new all-time highs toward 35,000–38,000 range.
This represents a distribution phase, where Smart Money offloads positions near cycle tops.
Expect divergence in momentum indicators, hinting at the end of the 5-wave structure.
---
💡 Smart Money Concept (SMC) Confluence
Concept | Observation | Implication
Liquidity Sweep - Below 2022–2023 lows (Smart Money accumulation confirmation)
Order Blocks - 22,000–18,000 zone {Institutional demand zone for Wave (4)}
Fair Value Gaps (FVGs) During Wave (3) impulsive rise {Will likely get mitigated during Wave (4)}
Break of Structure (BOS) Continuous bullish BOS confirms institutional intent
Premium/Discount Zones Current price at premium (above equilibrium) Ideal region for institutional profit-taking
🧭 Smart Money Flow:
Accumulation → Expansion → Re-accumulation → Final Distribution
---
📐 Fibonacci Confluence Levels
Wave (3) → 2.618× extension of Wave (1–2) → ~26,997 (expected macro resistance).
Wave (4) → retracement likely between 0.382–0.618 → 22,000–17,500 zone.
Wave (5) → projected 1.618× of Wave (1–3) → 35,000–38,000.
---
🧭 Market Outlook Summary
Timeframe | Bias | Expectation
Short-Term (2025–2026) 📈 Bullish Continuation toward 26,900–27,000
Medium-Term (2026–2027) ⚠ Corrective Re-accumulation phase, smart money reloads
Long-Term (2028–2029) 🚀 Bullish Wave (5) macro expansion toward 35K–38K
---
🔖 FIBCOS Summary
> NASDAQ 100 Weekly Chart (Elliott + SMC)
Currently expanding through a powerful Wave (3) toward the 2.618 Fibonacci extension (~27K).
After completion, a macro correction (Wave 4) is expected, providing the next Smart Money accumulation zone between 22K–18K before the final Wave 5 expansion toward new highs beyond 35K.
📘 Disclaimer: Not financial advice. Educational purpose only.
#FIBCOS #NASDAQ100 #ElliottWave #SmartMoneyConcept #MarketAnalysis #MarketCycle #Fibonacci
Disclaimer
The information and publications are not meant to be, and do not constitute, financial, investment, trading, or other types of advice or recommendations supplied or endorsed by TradingView. Read more in the Terms of Use.
Disclaimer
The information and publications are not meant to be, and do not constitute, financial, investment, trading, or other types of advice or recommendations supplied or endorsed by TradingView. Read more in the Terms of Use.