buy at zone - swingENTRY
- line marked is potential reversal zone ( PRZ)
- entry is strictly inside the zone
- look for buying confirmation in smaller time frame ( 15 minutes preferred )
EXIT
1. target
- mark fib retracement from C to latest swing low
- TGT 1 - 0.236
- TGT 2 - 0.382
-
Next report date
—
Report period
—
EPS estimate
—
Revenue estimate
—
−11.31INR
−738.50 MINR
5.35 BINR
14.73 M
About SHALIM PAINTS LTD
Sector
Industry
Headquarters
Gurugram
Website
Employees (FY)
670
Founded
1902
ISIN
INE849C01026
FIGI
BBG000CZGJD5
Shalimar Paints Ltd. engages in the manufacturing, selling, and distribution of paints, coatings, varnishes, enamels and lacquers. It offers its products under the Shalimar brand and is classified into the following: Master, No. 1 Silk, Superlac Advance, Superlac Stay Clean, and Signature. The company was founded on December 16, 1902 and is headquartered in Gurugram, India.

buy at zone - swing pickENTRY
- line marked is potential reversal zone ( PRZ)
- entry is strictly inside the zone
- look for buying confirmation in smaller time frame ( 15 minutes preferred )
EXIT
1. target
- mark fib retracement from C to latest swing low
- TGT 1 - 0.236
- TGT 2 - 0.382
-


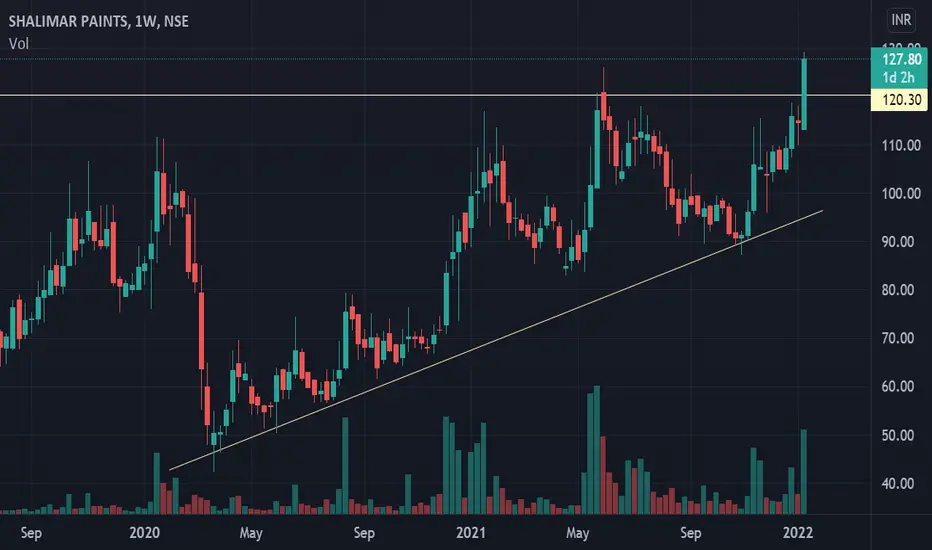
Triangle Pattern Breakout(Weekly TF) - SHALIMARPAINTSPlease look into the chart for a detailed understanding.
Consider these for short-term & swing trades with 4% profit (In my observation, I found that most of the stocks reached 3% to 4% on weekly basis)
Please consider these ideas for educational purposes.
Consider the above lines as upcoming res

💥Shalimar Paints💥- Nice Breakout💥Shalimar Paints💥- Nice Breakout
Capital to be deployed- 20k
Investing Price -175-180
Breakout Price -171
Stoploss-151
Targets-219-252-350
RT for max reach.
#shalimarpaints #StocksToBuy #stocks #StocksToTrade #StocksInFocus #stockstowatch #StocksInNews

SHALIMAR PAINTS NSE BullishView above 150. CMP 158.5SHALIMAR PAINTS NSE is Bullish if 150 holds. Near 52 weeks High. Fresh Breakout. Positive Trend.
Disclaimer: Educational Purpose only. Not Buy/Sell Reco. Sebi unregistered.

Buy SHALPAINTSSafe Buy Shalimar Paints Above 133. One can even buy around 130 level.
There is a Small Resistance around 150-152 levels. However, journey towards 165 looks smooth in coming days.
T1: 163
T2: 189
Add more around 120-122 levels (on retracement)
SL: 109
Nice break with volume. Crossing resistance

SHALPAINTS NSE Shalimar Paints BULLISHVIEW BOVE 120 CMP 127.5SHALPAINTS NSE Shalimar Paints is bullish if 120 holds. New 52 Week High. Positive Trend. Fresh Breakout.
**** Educational purpose only. Not Buy/Sell Recommendations.
Shalimar paints seems bullishShalimar paints
may breakout H&S level
psychological level of 120 to be cross first

Breakout of channelShalimar has BO'd from channel and is moving up with good volumes...importantly it has also taken SUPPORT of 200 EMA. Targets marked..broader markets are sliding or consolidating so trade cautiously..this is an idea, not a recommendation. Shalimar is up 7% today

See all ideas
Frequently Asked Questions
The current price of SHALPAINTS is 141.28 INR — it has increased by 0.87% in the past 24 hours. Watch SHALIM PAINTS LTD stock price performance more closely on the chart.
Depending on the exchange, the stock ticker may vary. For instance, on NSE exchange SHALIM PAINTS LTD stocks are traded under the ticker SHALPAINTS.
SHALPAINTS stock has fallen by −2.57% compared to the previous week, the month change is a 4.27% rise, over the last year SHALIM PAINTS LTD has showed a −8.94% decrease.
SHALPAINTS reached its all-time high on May 17, 2017 with the price of 230.42 INR, and its all-time low was 19.72 INR and was reached on Nov 20, 2008. View more price dynamics on SHALPAINTS chart.
See other stocks reaching their highest and lowest prices.
See other stocks reaching their highest and lowest prices.
SHALPAINTS stock is 2.81% volatile and has beta coefficient of 0.40. Track SHALIM PAINTS LTD stock price on the chart and check out the list of the most volatile stocks — is SHALIM PAINTS LTD there?
Today SHALIM PAINTS LTD has the market capitalization of 11.74 B, it has decreased by −0.93% over the last week.
Yes, you can track SHALIM PAINTS LTD financials in yearly and quarterly reports right on TradingView.
SHALIM PAINTS LTD is going to release the next earnings report on Nov 12, 2024. Keep track of upcoming events with our Earnings Calendar.
SHALPAINTS net income for the last quarter is −270.40 M INR, while the quarter before that showed −264.20 M INR of net income which accounts for −2.35% change. Track more SHALIM PAINTS LTD financial stats to get the full picture.
No, SHALPAINTS doesn't pay any dividends to its shareholders. But don't worry, we've prepared a list of high-dividend stocks for you.
As of Sep 21, 2024, the company has 670.00 employees. See our rating of the largest employees — is SHALIM PAINTS LTD on this list?
EBITDA measures a company's operating performance, its growth signifies an improvement in the efficiency of a company. SHALIM PAINTS LTD EBITDA is −707.20 M INR, and current EBITDA margin is −10.14%. See more stats in SHALIM PAINTS LTD financial statements.
Like other stocks, SHALPAINTS shares are traded on stock exchanges, e.g. Nasdaq, Nyse, Euronext, and the easiest way to buy them is through an online stock broker. To do this, you need to open an account and follow a broker's procedures, then start trading. You can trade SHALIM PAINTS LTD stock right from TradingView charts — choose your broker and connect to your account.
Investing in stocks requires a comprehensive research: you should carefully study all the available data, e.g. company's financials, related news, and its technical analysis. So SHALIM PAINTS LTD technincal analysis shows the sell today, and its 1 week rating is sell. Since market conditions are prone to changes, it's worth looking a bit further into the future — according to the 1 month rating SHALIM PAINTS LTD stock shows the neutral signal. See more of SHALIM PAINTS LTD technicals for a more comprehensive analysis.
If you're still not sure, try looking for inspiration in our curated watchlists.
If you're still not sure, try looking for inspiration in our curated watchlists.