NASDAQ Correction for few days then buy the dip
Nasdaq (NDX) has gone a long way since we called for a rebound on the 1D MA200:

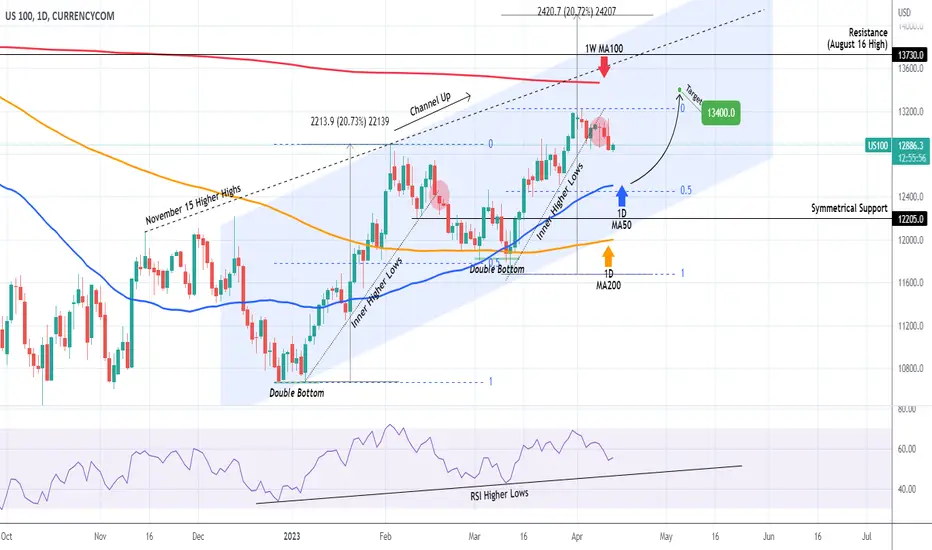
The recent rally within this Channel Up pattern that started in December (its second Bullish Wave), came to an end after it broke the Inner Higher Lows trend-line in similar fashion as the first wave did on February 17. That pulled-back to the 0.5 Fibonacci retracement level before rebounding to a Higher High.
The current 0.5 Fib is on 12460, a little under the March 28 Low and the 1D MA50 (blue trend-line), which has been basically supporting since mid-January. If the RSI bounces off its Higher Lows trend-line, then the bottom may come earlier. In any case, we will buy this pull-back and target 13400, a potential contact with the 1W MA100 (red trend-line), which rejected the August 16 High.
The best level to buy during this run is on the Higher Lows trend-line of the RSI. A similar Higher Lows trend-line during the January bullish leg (note that both sequences started on a Double Bottom), gave 5 clear buy entries.
-------------------------------------------------------------------------------
** Please LIKE 👍, FOLLOW ✅, SHARE 🙌 and COMMENT ✍ if you enjoy this idea! Also share your ideas and charts in the comments section below! **
-------------------------------------------------------------------------------
💸💸💸💸💸💸
👇 👇 👇 👇 👇 👇
👑Best Signals (Forex/Crypto+70% accuracy) & Account Management (+20% profit/month on 10k accounts)
💰Free Channel t.me/tradingshotglobal
🤵Contact info@tradingshot.com t.me/tradingshot
🔥New service: next X100 crypto GEMS!
💰Free Channel t.me/tradingshotglobal
🤵Contact info@tradingshot.com t.me/tradingshot
🔥New service: next X100 crypto GEMS!
Disclaimer
The information and publications are not meant to be, and do not constitute, financial, investment, trading, or other types of advice or recommendations supplied or endorsed by TradingView. Read more in the Terms of Use.