Long
DOW JONES most likely topped at least short-term
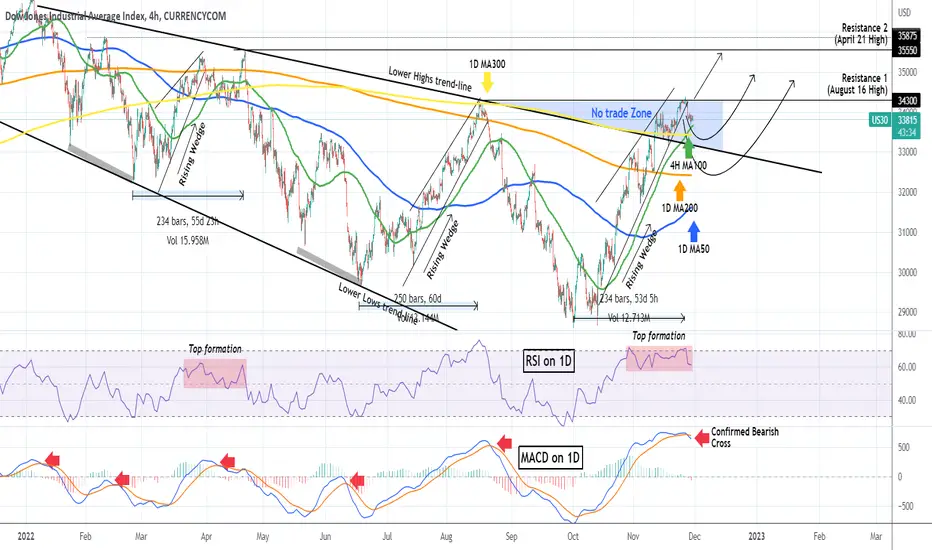
It has been almost 6 weeks since Dow Jones (DJI) broke above the top (Lower Highs trend-line) of the Bearish Megaphone pattern that it has been trading in since the start of the year and the beginning of the 2022 correction. At the same time it broke above the 1D MA300 (yellow trend-line), which as we've mentioned numerous times was the barrier for a long-term bullish trend restoration:

As the price was basically rejected on the 34300 Resistance 1 (August 16 High), we can argue that the October - November rally has come to an end, with the price breaking below the Rising Wedge, while also the MACD on the 1D time-frame completed a Bearish Cross (red arrows). Unlike the previous counter trend rallies within the Bearish Megaphone, this time we may have the luxury to expect only a short-term pull-back, and not a new long-term selling sequence to a new market low.
As you see, we were correct for calling the area within the 34300 Resistance and the top (Lower Highs trend-line) of the former Bearish Megaphone, a 'No trade Zone'. A potential Support (and bounce point) can be that Lower Highs trend-line itself and if broken, the 1D MA50 (blue trend-line), which is traditionally the first Support during long-term uptrends. All this of course, assuming that the 4H MA100 (green trend-line), which is supporting now, breaks. If not, we can see one last attempt to break and close above Resistance 1 (34300) and target Resistance 2 (35550).
On a side note, see how the 1D RSI has been printing a Top formation similar to late March - early April. Also the November 25 top came exactly 234 days after the October 02 Low, which is symmetrical to February - April.
-------------------------------------------------------------------------------
** Please LIKE 👍, SUBSCRIBE ✅, SHARE 🙌 and COMMENT ✍ if you enjoy this idea! Also share your ideas and charts in the comments section below! This is best way to keep it relevant, support me, keep the content here free and allow the idea to reach as many people as possible. **
-------------------------------------------------------------------------------
You may also TELL ME 🙋♀️🙋♂️ in the comments section which symbol you want me to analyze next and on which time-frame. The one with the most posts will be published tomorrow! 👏🎁
-------------------------------------------------------------------------------
💸💸💸💸💸💸
👇 👇 👇 👇 👇 👇
👑Best Signals (Forex/Crypto+70% accuracy) & Account Management (+20% profit/month on 10k accounts)
💰Free Channel t.me/tradingshotglobal
🤵Contact info@tradingshot.com t.me/tradingshot
🔥New service: next X100 crypto GEMS!
💰Free Channel t.me/tradingshotglobal
🤵Contact info@tradingshot.com t.me/tradingshot
🔥New service: next X100 crypto GEMS!
Disclaimer
The information and publications are not meant to be, and do not constitute, financial, investment, trading, or other types of advice or recommendations supplied or endorsed by TradingView. Read more in the Terms of Use.