USDCAD, Consolidating In The Range, Possible Triangle Formation!

Hello, Traders Investors And Community, welcome to this analysis where we are looking at the recent events, current price-structure, and what we can expect from USDCAD the next hours and days. As USDCAD fell below its important consolidation and established a downtrend which moved below the fundamental EMA structure it is now recovering and showing some up moves the last times but there are some important and significant signals and signs I detected which will affect the price of USDCAD sustainable therefore we are looking at the 4-hour timeframe.
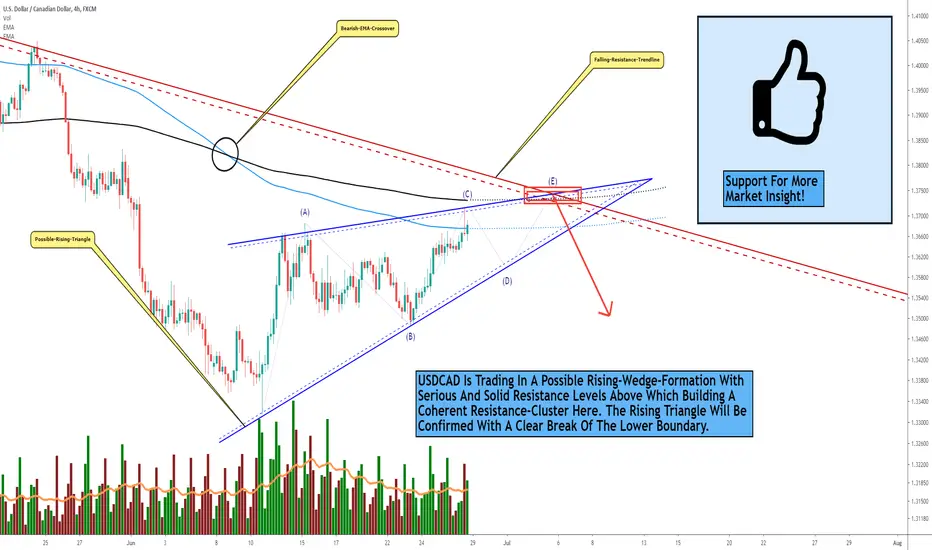
As you can watch in my chart USDCAD is moving in a steady but weak volatile uptrend since it marked its lows at 1.334, for now, this uptrend is building a narrower range the more USDCAD advances in price, this range is building an overall possible ascending-triangle-formation here which you can see marked with the blue trend-lines in my chart where the lower and upper boundary already touched several times, such a formation is normally a formation which is confirming bearish to the downside when confirmed properly which will happen when the lower boundary crossed to the downside.
Furthermore, USDCAD has important resistance clusters in the structure which is firstly the 200-EMA marked in blue in my chart, secondly, the 500-EMA marked in black and the falling resistance line which is marked in red, taking all these factors in consideration USDCAD has serious resistance levels in the structure which will be highly likely confirmed when touched in this level, also we have the wave-count which is finished when the final wave E ends at the bearish resistance-cluster and turns bearish to the downside which will confirm not only the wave count but also the wedge.
When the bearish scenario sets in as expected and with the proper volatility it can be traded on the short-side with either an aggressive entry or a conservative entry. The aggressive approach will be right immediately when USDCAD shows bearish signs in the resistance cluster and the conservative approach will be when the lower boundary finally confirmed to the downside, although both entries are possible the conservative approach will be smarter and traders into this direction should decide on individual risk-preferences.
In this manner, thank you for watching, support for more market insight, have a great day and all the best my friends! ;)
It is the job of the market to turn the base material of our consciousness into gold.
Information provided is only educational and should not be used to take action in the markets.
Note
ANALYSIS UPDATE: USDCAD pulled back within the wedge resistance to form the bearish breakout below the lower boundary of the wedge.Since the bearish completion has shown up USDCAD continued with massive bearish momentum continuations.
►✅JOIN THE BEST+ TOP TELEGRAM TRADING CHANNEL: t.me/VincePrinceForexGoldStocks
►🚀Write To Join the Elite VIP Signal Channels: @Vince_Prince
►🔥JOIN BYBIT TOP EXCHANGE►🎁 UP TO $30,000 BONUS NOW: partner.bybit.com/b/VinceByBit
►🚀Write To Join the Elite VIP Signal Channels: @Vince_Prince
►🔥JOIN BYBIT TOP EXCHANGE►🎁 UP TO $30,000 BONUS NOW: partner.bybit.com/b/VinceByBit
Disclaimer
The information and publications are not meant to be, and do not constitute, financial, investment, trading, or other types of advice or recommendations supplied or endorsed by TradingView. Read more in the Terms of Use.