$USD vs. $CHF - Bearing Down Of #Franc | $USDCHF #SNB #forex
Friends,
A GREAT RESPONSIVE PAIR FOR THE MODEL:
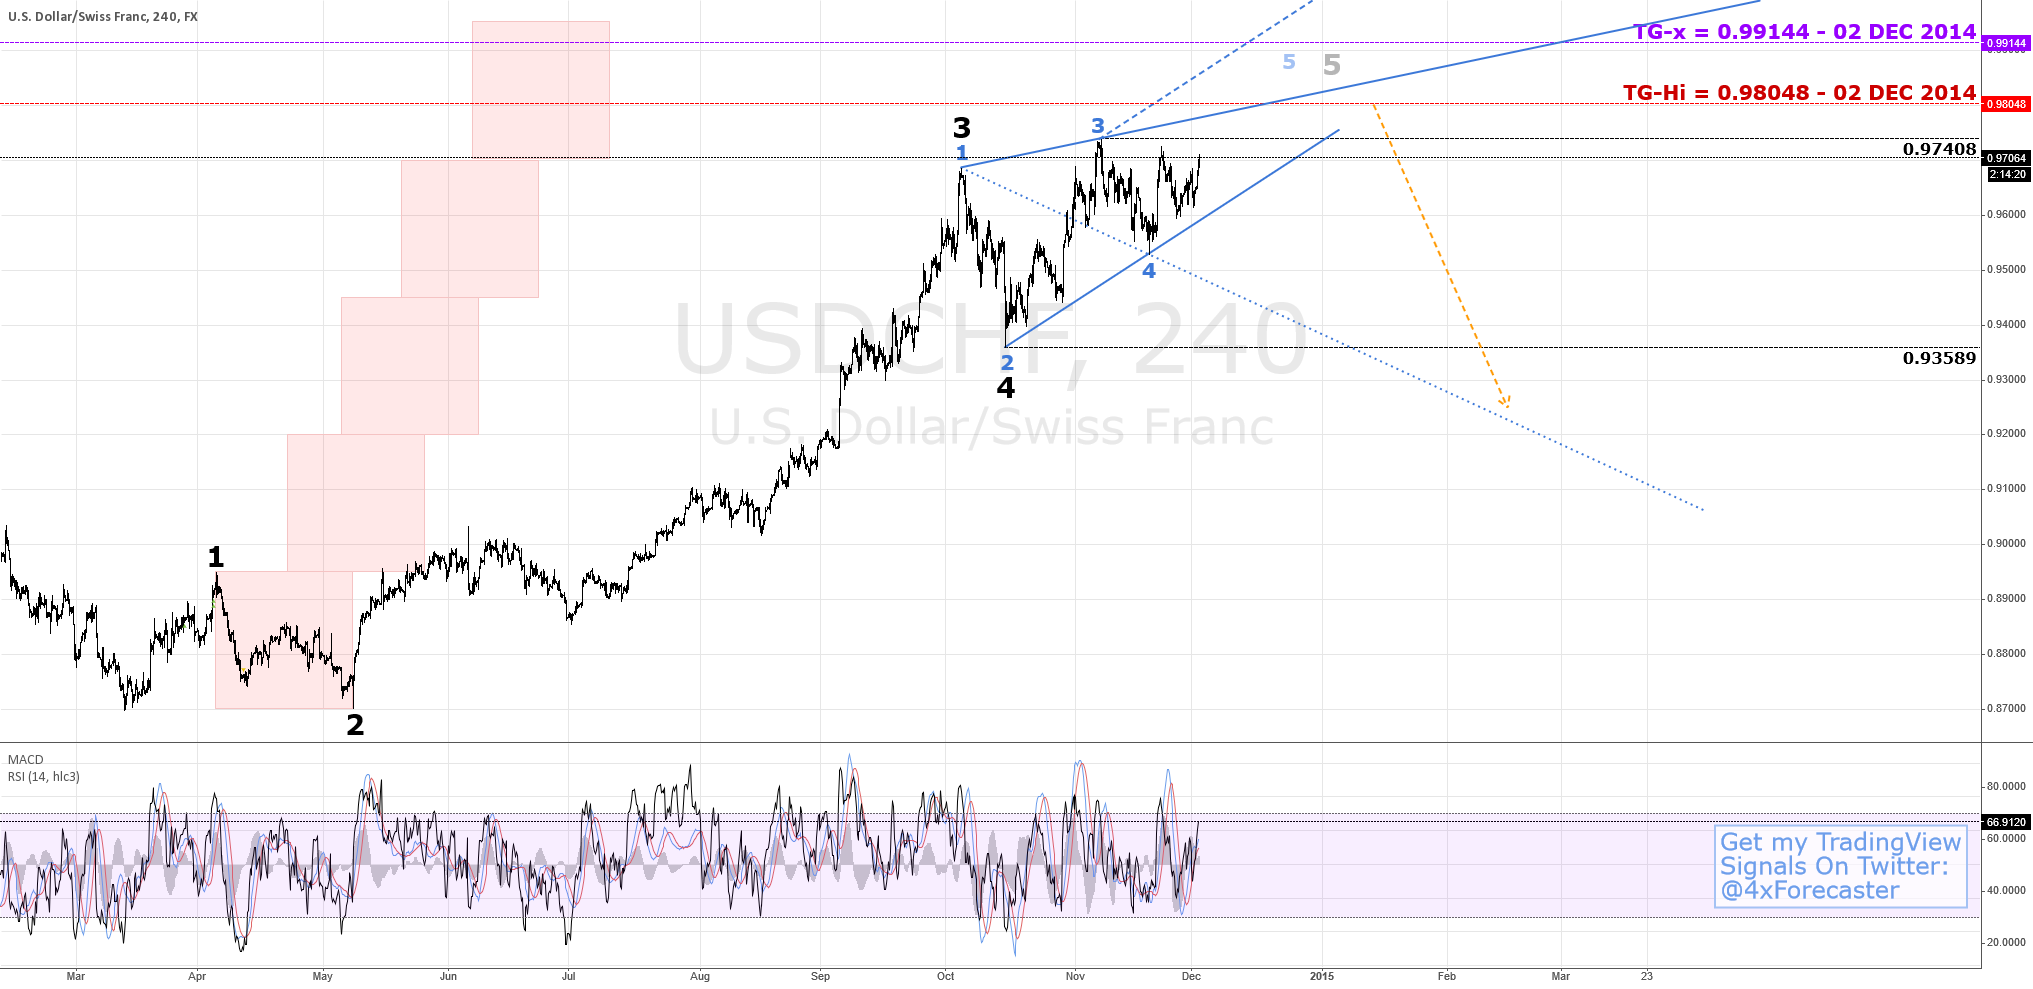
This $USDCHF pair has been quite consistent in its response to the Predictive/Forecastng Model. First, last December 2014, the Model was able to predict the dramatic crash of this pair (See 02 DEC 2014 analysis/chart here:
 ), hitting first the forecast bullish targets up to 0.99144, and then calling for a reversal, wherein price hit all abysmal targets on its way down to 090275.
Following that tumble, the Predictive/Forecasting Model signaled a significant rallying into loftier targets, which also got hit one after the other from 0.90357 back up to 0.99346 (See 21 JAN 2015 analysis/chart here:
).
NEW PREDICTIVE/FORECASTING MODEL SIGNAL:
Today, same Predictive/Forecasting Model remains bearish on the pair with the following two targets which were already announced this past 29 APR 2015, namely:
1 - TG-Lo = 0.90073 - 29 APR 2015
and
2 - TG-Lox = 0.87312 - 29 APR 2015
There is a significant interim support that I would add here at 0.89065, which may guard price from reaching the lower-probability qualitative "TG-Lox". That level should represent a bullish entrenchment, defined at:
- Bullish Entrenchment = 0.89065.
The significance of this level is simply on the basis that it may likely interdict price from reaching its lowest forecast at TG-Lox, and that bulls may use that level as a springboard for a reversal.
MARKET GEOMETRY:
The nascent background geometry is a Wolfe Wave with its 5 points still in gestation. For instance, Point-4 remains improbable at this point, since the Tunneling feature borrowed from the "Geo" remains unclear. The Geo can also lend its "Geo Anchor" idea at the GREEN asterix to suggest a possible point of repose for the Wolfe Wave's 1-4 Line, which remains speculative at this point.
For the time being, 0.95421 acts as a significant resistance for the geometry, suggesting that if Point-4 was to find a final residence, it would do so below 0.95421, and likely along the 1-4 Line speculatively drawn in the chart.
OVERALL:
The Predictive/Forecasting Model stands alone and independent of the geometries ascribed in the chart. Only the Wolfe Wave and the "Geo" have demonstrated significant adherence to the Model's forecasts, so they are drawn here for visual guidance, standing in the background, whereas the Predictive/Forecasting Model are the principle targets at the foreground of the analysis.
At this time, the Model remains bearish, and targets defined this past April, 29th, 2015 remain ever closer and still in force.
Best,
David Alcindor
Predictive Analysis & Forecasting
Durango, Colorado - USA
-----
Twitter:
@4xForecaster
LinkedIn:
David Alcindor
-----
.
A GREAT RESPONSIVE PAIR FOR THE MODEL:
This $USDCHF pair has been quite consistent in its response to the Predictive/Forecastng Model. First, last December 2014, the Model was able to predict the dramatic crash of this pair (See 02 DEC 2014 analysis/chart here:
Following that tumble, the Predictive/Forecasting Model signaled a significant rallying into loftier targets, which also got hit one after the other from 0.90357 back up to 0.99346 (See 21 JAN 2015 analysis/chart here:

NEW PREDICTIVE/FORECASTING MODEL SIGNAL:
Today, same Predictive/Forecasting Model remains bearish on the pair with the following two targets which were already announced this past 29 APR 2015, namely:
1 - TG-Lo = 0.90073 - 29 APR 2015
and
2 - TG-Lox = 0.87312 - 29 APR 2015
There is a significant interim support that I would add here at 0.89065, which may guard price from reaching the lower-probability qualitative "TG-Lox". That level should represent a bullish entrenchment, defined at:
- Bullish Entrenchment = 0.89065.
The significance of this level is simply on the basis that it may likely interdict price from reaching its lowest forecast at TG-Lox, and that bulls may use that level as a springboard for a reversal.
MARKET GEOMETRY:
The nascent background geometry is a Wolfe Wave with its 5 points still in gestation. For instance, Point-4 remains improbable at this point, since the Tunneling feature borrowed from the "Geo" remains unclear. The Geo can also lend its "Geo Anchor" idea at the GREEN asterix to suggest a possible point of repose for the Wolfe Wave's 1-4 Line, which remains speculative at this point.
For the time being, 0.95421 acts as a significant resistance for the geometry, suggesting that if Point-4 was to find a final residence, it would do so below 0.95421, and likely along the 1-4 Line speculatively drawn in the chart.
OVERALL:
The Predictive/Forecasting Model stands alone and independent of the geometries ascribed in the chart. Only the Wolfe Wave and the "Geo" have demonstrated significant adherence to the Model's forecasts, so they are drawn here for visual guidance, standing in the background, whereas the Predictive/Forecasting Model are the principle targets at the foreground of the analysis.
At this time, the Model remains bearish, and targets defined this past April, 29th, 2015 remain ever closer and still in force.
Best,
David Alcindor
Predictive Analysis & Forecasting
Durango, Colorado - USA
-----
Twitter:
@4xForecaster
LinkedIn:
David Alcindor
-----
.
Comment:
27 OCT 2015 - Chart Update:
Price continues to rise towards combined B-D Lines:
David Alcindor
Price continues to rise towards combined B-D Lines:
David Alcindor
Comment:
07 NOV 2015 - Chart Update / Tech-Note:
I realize that I posted a bullish target this past November 29th in the "Predictive Analysis & Forecasting" chatroom (Here is the link to the room: www.tradingview.com/chat/ ... And here is the link to that comment where the bullish target was defined: www.tradingview.com/...c-a08d-1fd43b8eda6b/ )
Following is chart at time of announcement, as well as today's updated chart:
$USDCHF - 29 OCT 2015:
$USDCHF - 07 NOV 2015:
At this point, I would look for a 1-3 Line validation as a technical hint towards further downside, towards the targets defined back in April.
INVALIDATION of the target would be best defined by a price rallying in excess of 1.618 of Points 1 and 2 height, or simply be defining an adverse excursion in excess of a 5-second (5'') level, which is defined as the parallel of the 2-4 Line projecting off of Point-1, just as the 5' was defined by that same parallel off of Point-3.
Best,
David Alcindor
Comment:
08 NOV 2015 - Chart Update / Tech-Note:
I am adding the WL value at 1.01075 (see chart below) - This is the Predictive/Forecasting Model's level that signals moving the analysis to a 4-fold timeframe (e.g.: a 15-min chart with a WL violation suggests to move the analysis to M15 x 4 = 1-hour timeframe ... Correspondingly, H1 x 4 = H4, and H4 x 4 - DAILY, and daily x 4 = weekly, and finally weekly x 4 = Monthly).
In this case, I would look for any indicator/signal for reversal as well - Feel free to chart anything that you deem supportive of a continuation to the upside or a retracement/reversal.
Thank you for your readership. It is much appreciated.
Best,
David Alcindor
Comment:
08 NOV 2015 - EDUCATIONAL TRADE IDEA
I have an entry at the WL minus spread and a few fronted pips.
Stop Loss as shown in the chart:
Good luck!
David Alcindor
I have an entry at the WL minus spread and a few fronted pips.
Stop Loss as shown in the chart:
Good luck!
David Alcindor
Comment:
ADDENDUM - Here is what you should guard against ...:
So, if price is not moving your way, it might be due to the influence of an inner geometry.
David Alcindor
So, if price is not moving your way, it might be due to the influence of an inner geometry.
David Alcindor
Comment:
08 NV 2015 - Educational Trade - UPDATE: A Step-By-Step Assessment Of A Potential Reversal:
For those interested in minutia and smaller frames, here is a potential way to calibrate the (much) larger entry in the DAILY chart using a fine granular M15 frame:
1 - ASSESS THE FIELD:
First, let's take a look at the field at the M15 level:
2 - THROW SOME FIBS FOR PROBABLE PRICE EXTENTS:
Next, let's throw a Fibonacci extension of 1.414 and 1.618 - This will give us two important values:
a -- 1.414-FE = 1.00828 - This is the value at which an aggressive counter-trend market is likely to reverse. A precautionary short entry at this level is not a bad proposition. Ever.
b -- 1.618-FE = 1.00905 - This would represent a conservative stop-loss if price were to Break-Across, Close-Across ("BACA") this handle.
3 - DO YOU SEE A GEOMETRY?
Next, let's look for a potential geometry ... But do you see one? If not, try to connect highs together, then lows together. Here is what I get:
4 - DEFINE A PROBABLE GEOMETRIC AMPLITUDE:
Next, using my prop model (you can use very basic structural analysis here too), I define a possible extent in the decline of current price action - Here is what I get as a probable floor:
Note that the most important thing here is not to have a "smart tool", but a cautious attitude towards your trade. My "Model" gives me guidelines, but what we are looking for is a safe entry.
5 - DEFINE A SAFE ENTRY:
In these geometries, the safest entry is done at the price level of Point-C (assuming a A-B-C-D-E point-definition of the geometry) - Here is where the estimated (conservative entry would occur, given the speculative price path (dashed line):
6 - DEFINING AN EXIT:
Here, this is pretty simple. We discussed several times before the significance of the 1.414-FE level. In an aggressive counter-trend market, this may often be the level at which institutional players might travel to fetch stop-loss positions, while leaving bag holders at the 1.618-FE level. So, if you long a position and you near a 1.414-FE level, this is where you get off the boat. No question asked.:
7 - DEFINING A RE-ENTRY:
In the case of this chart, you could either re-enter immediately at the level you exited your long position. For the more cautionary player who sees a potential short position at the DAILY chart (and this is really most of use, since we started at a much higher timeframe, and here we are simply musing about the possibility of a very short-lived trade, we might also consider the following short entry (Your SL remains at the 1-618-FE value):
OVERALL:
This is a purely educational demonstration of how I enter a trade using the simplest elements in the field. My Model offers a high-probability guideline, but RSI, trendline and simple geometries often suffice for the most profitable or consistent trades.
Looking for risky entries or a random chance to profit should never be a recourse or remedy to frustration. Sometime, doing nothing is already sufficient activity to neither profit, nor losing.
In my view, I'd much rather learn from a loss than profit by chance. The accumulated lessons will only reinforce your mind's eye for otherwise unseen opportunities.
Best,
David Alcindor
Durango, Colorado - USA
For those interested in minutia and smaller frames, here is a potential way to calibrate the (much) larger entry in the DAILY chart using a fine granular M15 frame:
1 - ASSESS THE FIELD:
First, let's take a look at the field at the M15 level:
2 - THROW SOME FIBS FOR PROBABLE PRICE EXTENTS:
Next, let's throw a Fibonacci extension of 1.414 and 1.618 - This will give us two important values:
b -- 1.618-FE = 1.00905 - This would represent a conservative stop-loss if price were to Break-Across, Close-Across ("BACA") this handle.
3 - DO YOU SEE A GEOMETRY?
Next, let's look for a potential geometry ... But do you see one? If not, try to connect highs together, then lows together. Here is what I get:
4 - DEFINE A PROBABLE GEOMETRIC AMPLITUDE:
Next, using my prop model (you can use very basic structural analysis here too), I define a possible extent in the decline of current price action - Here is what I get as a probable floor:
Note that the most important thing here is not to have a "smart tool", but a cautious attitude towards your trade. My "Model" gives me guidelines, but what we are looking for is a safe entry.
5 - DEFINE A SAFE ENTRY:
In these geometries, the safest entry is done at the price level of Point-C (assuming a A-B-C-D-E point-definition of the geometry) - Here is where the estimated (conservative entry would occur, given the speculative price path (dashed line):
6 - DEFINING AN EXIT:
Here, this is pretty simple. We discussed several times before the significance of the 1.414-FE level. In an aggressive counter-trend market, this may often be the level at which institutional players might travel to fetch stop-loss positions, while leaving bag holders at the 1.618-FE level. So, if you long a position and you near a 1.414-FE level, this is where you get off the boat. No question asked.:
7 - DEFINING A RE-ENTRY:
In the case of this chart, you could either re-enter immediately at the level you exited your long position. For the more cautionary player who sees a potential short position at the DAILY chart (and this is really most of use, since we started at a much higher timeframe, and here we are simply musing about the possibility of a very short-lived trade, we might also consider the following short entry (Your SL remains at the 1-618-FE value):
OVERALL:
This is a purely educational demonstration of how I enter a trade using the simplest elements in the field. My Model offers a high-probability guideline, but RSI, trendline and simple geometries often suffice for the most profitable or consistent trades.
Looking for risky entries or a random chance to profit should never be a recourse or remedy to frustration. Sometime, doing nothing is already sufficient activity to neither profit, nor losing.
In my view, I'd much rather learn from a loss than profit by chance. The accumulated lessons will only reinforce your mind's eye for otherwise unseen opportunities.
Best,
David Alcindor
Durango, Colorado - USA
Comment:
09 NOV 2015 - Educational Trade - UPDATE:
So, here we are, catching price right at the time and place per 15-minute chart forecast:
Expecting some pull-back at this point.
David Alcindor
So, here we are, catching price right at the time and place per 15-minute chart forecast:
Expecting some pull-back at this point.
David Alcindor
Comment:
16 NOV 2015 - Chart Update / Tech-Note:
Price is fighting against gravity ... WW/Geo completed 5-point outline ... Not a great Geo, so unsure of probable decline from here:
David Alcindor
Price is fighting against gravity ... WW/Geo completed 5-point outline ... Not a great Geo, so unsure of probable decline from here:
David Alcindor
Comment:
16 NOV 2015 - Chart Update / Tech-Note:
Price moved right up to the Watch Line (not a target) ... :
David Alcindor
Price moved right up to the Watch Line (not a target) ... :
David Alcindor
Comment:
17 NOV 2015 - Chart Update / Tech-Note:
As price BACA > WL, this triggers a higher-frame analysis. Typically, this should occur at 4 times the level at which a WL crossing occurs. Instead, I decided to return to the original 4-hour chart, to maintain a larger appreciation of price action ... Here is what we are dealing with at this time:
1 - Price exceeded slightly two internal reciprocal ab = cd symmetries
2 - Price rallied into the 1.414 to 1.618-FE range
3 - A 5-point geometry completed with above two events.
I would look for price exiting out of the FE range to consider a short, whereas a BACA > 1.618-FE should be considered as possible SL.
An alternate SL I like to define is a 1.414 of 1.414-FE level.
David Alcindor
Comment:
... ADDENDUM ... Here is what a 1.414 of 1.414-FE would look like:
David Alcindor
David Alcindor
Comment:
29 FEB 2016 - Chart Update / Tech-Note:
Watch for this discreet WW completion (RED) as we continue to anticipate further decline:
Invalidation should occur above most recent structural top.
Best,
David Alcindor
Watch for this discreet WW completion (RED) as we continue to anticipate further decline:
Invalidation should occur above most recent structural top.
Best,
David Alcindor
Watch for this interplay between a BLUE contracting geometry and a BLACK expanding geometry:
There is a good chance that, based on the completion of the BLACK geometry at Point-E, price would rise and meet resistance of the BLUE upper border - This geometry would remain a triangle, with retained 3-3-3-3-3 internals, but would convert from an Elliott Wave Contracting Triangle to an Elliott Wave Barrier Triangle (where Point-(D) comes into horizontal alignment with Point-(B) . )
Worth keeping a close watch.
Best,
David Alcindor