The SAFEST Entry Technique - 18 Period Moving Average MethodA great deal of viewers have contacted me asking how I "time" the market. In other words, once I've identified a market as "set up" (via COT strategy or Valuation Strategy), how do I get into a trade.
This video is the first in a series that will outline the entry techniques that I use.
18 PERIOD MOVING AVERAGE ENTRY METHOD:
By far, this method is the safest change of trend confirmation that you will find. There are other entry techniques that will get you into the market sooner, sure. But those other entry techniques come with greater risk, and could be called "bottom picking" to some degree.
The 18 Period MA Entry Method is simple.
STEP 1: Plot the 18 period SMA on your chart based on the closing price.
STEP 2: For LONGS , you need to see two full range candles form ABOVE the MA. From there, mark out the highest high of those 2 candles. When price trades up into that high, the trend has officially changed to bullish. For SHORTS , you need to see to full range candles form BELOW the MA. From there, mark out the lowest low of those 2 candles. When price trades down into that low, the trend has officially changed to bearish.
CAVEAT: We do not count inside bars (bars that form within the range of the previous candle). If you see inside bars, skip them and continue your 2 bar count.
STEP 3: Enter at market when high/low is breached. Risk management is something I will review in another video, but generally, I add/subtract 120%-150% of the 3 bar ATR.
CLARIFICATION: To be clear, this entry technique should not be traded blindly. You need to have a REASON to take the trade (for example, COT strategy suggests a market is setup for a trade, or the Valuation/Ducks in a Barrel setup suggests a market is setup for a trade).
CREDIT: I credit Larry Williams, Tom DeMark, Brian Schad & Jake Bernstein for their influence in these ideas.
If you have any questions about this entry technique, feel free to shoot me a message.
Good Luck & Good Trading.
Entry

Weekly Analysis Part 1- Daily/ Weekly Intraday US30, Gold, Forex
- Trendlines/ Circles
- RSI floors: 2nd, 3rd buy
- Time Cicles

TYPES OF MARKET ENTRY TECHNIQUESWhen it comes to looking at entries on zones. There are two types of entries that you can use both of their own pros and cons.
Risk /Aggressive/ SET 'n' FORGET entry
Confirmation /Conservative entry
RISK/AGGRESIVE/SET 'N' FORGET ENTRY
the risk entry is aggressive in this case your are placing your buyer limit order on a zone, looking for price to tap into it take you into the trade and continue in your overall trade direction, but it doesn’t provide as much confirmation it does allow for an aggressive entry and provides quick entry when you are not able to be on the screens or if confirmation is simply not available. you practically identify POI on the HTF and using the LTF to refine that POI, set a limit on the refined zone for your entry
An example would be using a H4 POI and filtering the point of interest down to a 15 minute setting a limit order on that 15 minute ZONE.
ADVANTAGE
it provides trades that will can give a high risk reward.
is best used when the point of interest in the overall trade idea is with the prevailing trend
is also best used when approaching a trade aggressively
it also is useful when price is correctly moving back to an overall point of interest.
DISADVANTAGE
you get minimal Confirmation for entry, so the chance of being stopped increased Overall.
CONFIRMATION /CONSERVATIVE ENTRY
confirmation entry provides a little bit more confirmation and little more conservative compared to the risk entry. Your entry poi is in the higher TF, you refined using the lower entry
You picked desired a point of interest, dropped down to a lower timeframe and wait for a break of structure in favor of that point of interest and enter off a newly created ZONE.
ADVANTAGE
it provides additional confirmation prior to taking an entry
you are seeing a change of structure or change of trend in favor of the trade prior to actually taking the trade
it also provide a higher risk reward as the point of interest is refined and execute using a LTF which allows u have a high risk reward.
is best used when the range between a higher time frame poi and lower TF refinement is quite large.
Is also best use when price is rapidly moving back to a point of interest.
it’s best to use when there are multiple point of interest to consider that way your truly waiting for the market to show its hand prior to taking an entry
DISADVANTAGE
you may miss trades that simply do not touch the newly created ZONE on the Lower timeframe
you might not get a break of structure that forms another zone u can enter
the trade might just touch the POI and continue moving.
***
POI: point of interest, where u plan to likely take the trade
HTF: Higher Time Frame
LTF: Lower Time Frame

2022 Entry Model ExampleThis is a video journal and example of one of the most profitable and easy to execute ICT entry models. Not only are the entry criteria objective but so are the targets. You can look for previous highs or lows as your target or fib retracements, DR levels, whatever works for you.

How to do accurate entries using the 50% fib levelThis strategy will require you to be able to distinguish between the impulsive move and the retracement since we only apply the fib retracement tool to the impulsive move.
What you do is just lay your fib from the body to the body (not the wicks) then identify the 50% retracement level.
Now if you're an aggressive trader you can set a pending order or just execute an instant entry once price reaches your 50% retracement level.
On the other hand if you're a less aggressive trader, you will make a decision based on what price action will reveal at the 50% retracement level. I'll leave it to you to decide what kind of trader you are.

Confirmation entry 101Hello traders
- In this example, we will talk about confirmation entry.
- What is confirmation entry?
- Confirmation entry is shown in the picture above, and in this situation, we chose a safer order block for our entry.
- Below, we will break down the entire PA in detail and explain this example better.
1) We see that the momentum is present, the price has left an imbalance, and we have a nice candle close.
2) The price creates liquidity and returns to the retest, but in the end the price does not reach our order block, and here we have a missed entry.
3) The price impulsively broke through the low again, leaving the imbalance behind, and we see a nice candle close.
4) This second impulse can easily be a fakeout, so it is safer to wait for entry on the first order block
5) The price makes more liquidity that needs to be picked up
6) In the end, the price has taken out all the other traders who had open positions here, and our confirmation entry comes from where the price impulsively continues bearish.
-When you trade, you have to learn to read the PA in small details in order to better understand the PA and the language of the market.
- If this example helped you to better understand PA and confirmation entry, leave a like, and if you have any questions, you can ask below in the comments.

5 Market entry Orders Easily ExplainedBack in the old days, to action a trade you only had two easy options.
Buy or sell…
Fast-forward into the present day, and today you get slapped with five different options to choose from when you get into a trade.
Right now, I’m going to simplify these five trading entry orders in way that you’ll never forget.
Entry Order #1: Market Order
The first entry order is the easiest to understand.
This is where you’ll buy or sell at the most current market price.
When you choose a market order, it is the quickest, most effective and easiest way to enter into your ‘long’ or ‘short’ trade at the current bid (buy) or offer (sell).
Entry Order #2: BUY Limit
When you place a ‘Buy Limit Order’, you’ll place your long trade entry price BELOW where the current price is trading at.
Once the market price drops on or below the Buy Limit Order price, you will be automatically entered into your ‘long’ trade.
EXAMPLE: BUY Limit
If BHP Billiton’s share price is currently trading at R305 per share and you would like to buy (go long) at R300 per share, you’ll choose the Buy Limit Order.
You’ll then wait for the market price to drop to your chosen order price or below it where you’ll then be automatically entered into your ‘long’ trade.
Entry Order #3: SELL Limit
When you place a ‘Sell Limit Order’, you’ll place your short trade entry price ABOVE where the current price is trading at.
Once the market price hits this entry point or above it, you will be automatically entered into your ‘short’ trade.
EXAMPLE: SELL Limit
If BHP Billiton’s share price is currently trading at R300 per share and you would like to sell (go short) at R305 per share, you’ll choose the Sell Limit Order.
You’ll then wait for the market price to rise to or above your chosen order price, where you’ll then be automatically entered into your ‘short’ trade.
Entry Order #4: BUY Stop
When you place a ‘Buy Stop Order’, you’ll place your long trade entry price ABOVE where the current price is trading at.
Once the market price hits this entry point or above it, you will be automatically entered into your ‘long’ trade.
EXAMPLE: BUY Stop
If BHP Billiton’s share price is currently trading at R300 per share and you would like to buy (go long) at R305 per share, you’ll choose the Buy Stop Order.
You’ll then wait for the market price to rise to or above your chosen order price, where you’ll then be automatically entered into your ‘long’ trade.
Entry Order #5: SELL Stop
When you place a ‘Sell Stop Order’, you’ll place your short trade entry price BELOW where the current price is trading at.
Once the market price drops on or below the Sell Stop Order price, you will be automatically entered into your ‘short’ trade.
EXAMPLE: SELL Stop
If BHP Billiton’s share price is currently trading at R305 per share and you would like to sell (go short) at R300 per share, you’ll choose the Sell Stop Order.
You’ll then wait for the market price to drop to your chosen order price or below it where you’ll then be automatically entered into your ‘short’ trade.
I hope this helps with knowing how to place an entry order for next time!
Trade well, live free...
Timon
MATI Trader

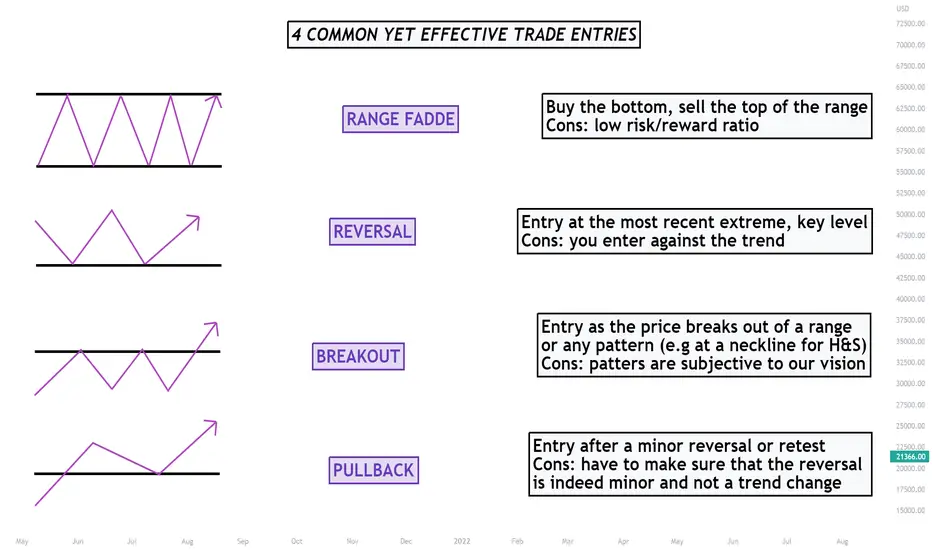
4 COMMON YET EFFECTIVE TRADE ENTRIESHappy Chewsday, traders! Some of you reached out and asked for more educational articles and we’re here to deliver. Relatively simple but important topic of entries is going to be lightly covered today. The image above should be pretty self-explanatory, but to cover it in more details: There are 4 main entry types.
- Range fadde is when we buy the bottoms and sell the tops of the range. Usually the box/rectangle isn’t large, so the risk-reward ratio is just not there for many traders. However, you can definitely put the stop loss a few pips out of the range and maximize the ratio.
- Reversal is an entry at the most recent extreme, key level. Quite popular approach, but personally, it usually goes against our fight club rule #1: “never fight the trend, he’s your friend”. We do; however, look out for multi-day/week key levels in our ideas as well.
- Breakout is an entry as the price breaks out of a range or any pattern. Very reliable option for beginners that are obsessed with finding repetitive reoccurrences in the market. For example, you can sell at the neckline of head and shoulders pattern and successfully profit from that. It is important to keep in mind that, the more complicated patterns you “notice”, the less people use them, thus, devaluing the importance of it.
- Pullback is an entry after a minor reversal or retest. Statistically speaking, this is one of the most frequent entries utilized by us. It’s simple and you still follow the trend. Draw your key points, look for proper Fibonacci levels and make sure it’s not a complete trend reversal. Of course, you’ll miss out on a few pips this way, but this might change your long-term profit statement.
What’s your favorite entry type?
How To : Chart Formations Critical Second Top & Bottom Entry Hi Traders and Investors
This video is a follow up from my previous posting dealing with shifts of momentum.
This time we are looking to add an additional synergy - the second touch in a chart formation - which can be found in Double Tops, Double Bottoms and head shoulder formations. Correctly using the second touch on the chart formations has allowed me to avoid many mistakes in my evaluating my trades and I hope that it will help you in evaluating your trades.
When you look at the Double Top and Double Bottom chart formations, you will notice that high frequency trading and algorithms trading will often create the formation of a second top to the same level as the first top or slightly higher by taking stops pilling at the first top . At this point, you want to wait for the synergies to come into play and use your tools to look for a shift in momentum on the 2nd top touch see video.
Waiting for the shift in momentum to occurs after the second touch, is a critical piece of of information that will prevent you from taking trades that are likely to be stopped out on the first test.
Hope it helps have a great week end
Marc

Bearish Entry ExampleThis kind of price action happens all the time, you just have to spot it while it's happening so that you can plan your trade and execute. I have put this together to give you an idea of the type of things I look for in the hope that it can help you too.
Once price action has made a clear impulse to the upsides and taking out previous structure that's our first sign that the buyers are stepping in. Once we see some corrective price action we can place our fib from the high to low, mark out previous structure and identify the pattern that price is making to build a picture of where price is most likely to reverse giving us the best possible entry.

The Problem with Breakeven TradesThe issue with breakeven trading is that when enough people are joining the market at the same place, be it a demand area or an order block.
Many traders like to secure their positions immediately.
This, however, creates liquidity.
Whenever a large group of people move stop losses to the same area, expect that area to be a target for the banks.
In this example, we can see buy orders being activated at an order block, a sudden push to make buyers secure their position, followed by a stop hunt of risk-free trades before continuing to the upside.
Do you ever get caught in situations like this?

When to enter? Does it even matter?With value investing everyone knows: Buy when there is blood in the street, when a good company has a P/E ratio of maybe under 10.
But with currencies, other than the advice "50% to 61.8% fib" and a whole lot of troll "buy every bottom sell every top with the magic indicator or magic drawing on the chart" there is no common knowledge.
We can look at this recent example where the price dropped, went sideways, and then dropped hard.
We could keep looking at winning examples when selling or buying at the top of these bands or ~61.8% retracement
The only way to know how good they are is by backtesting a large number and writing down the stats.
But are there other ways to enter?
Rather than write an entire novel with chapters I will simply go through a list of screenshots
Some say it doesn't matter where you enter...
It does and it doesn't, depends what you mean by that.
First
Second
Third
Fourth
Fifth
Sixth
Seventh
Eight
Ninth
Final
This is all simplified to make my point, or points I guess.
So you can't just say "entry doesn't matter". People that tried trading, failed, got into "holy grail" safe good boy passive S&P in the last 70 years averaged bla bla bla wake me up, they're the ones saying this. Oh so it does not matter if they buy a stock at a P/E of 8 or 280?
Of course it matters!!! Entry matters!
BUT where you enter EXACTLY does not matter. I'm not sure how to put it, but go through the examples and you see what I mean. Sometimes it matters, but even if you miss it there are other ones, and these entries are going to be at least a small area "of opportunity" anyway. Well it's more complicated than a "yes" or "no". There are plenty of ifs. And plenty of ways to approach this.
Look, Warren Buffett bought too early or later and sold too early all the time. And? Most famous investor in the world. Is there an optimal super entry that gives better results than anything else? Statistically there has to be one, so yes. If we spend ages making stats and we find it do we know it will remain this particular one? Probably not... Can we find it without it just being hindsight bias? Probably not... Would having the mighty perfect entry (I didn't say find every exact bottom, that's not actually possible) make a big difference to our results? Lol you might go from 20% returns to 20.5%. Probably even less.
The endless search for the holy entry newbs seem to all be obsessed with... Fool game. It's same as with video games, Starcraft, Lol, Dota, W3. Or chess... Newbs go "I will farm for 40 minutes full eco ignore military, full Nasus q, full catch his pawns, I'll be a monster and they'll see", 15 minutes later "Ok tough guy just wait late game you will feel sorry", 5 minutes later "Victory!" or "GG easy noob", 1 minute later "Report Nasus useless afk trash ebay account". Haha I laugh every time.
They really make all the same type of newbie "late game" and "magnet logic" mistakes, 80% of retail FX goes into "day trading" because "hey I figured out I'll get more trades and therefore grow my account faster duh", "Hey you can't lose if you don't sell", "Hey I have this brilliant martingale average down", "Hey wassup wassup wassup I found a trick", "hey if I go for lots and lots of little wins, take my profit fast I'll win small but very often and scale", "hey if I run conservative robots that only return 1% but I run 500 of them...", "hey if I add all these conditions". What a circus.
Miss the good old days. Can't humiliate noobs with trading their account is secret, they open their mouths when they get lucky then vanish, and it's not a 1 v 1 or 3 v 3 or whatever it's a 1 v whole market. Even if we cooperate and share ideas it's still a 10 v 10 million or idk. There is however the "bull vs bear" thing. But the Bitcoin bulls from 2018 from 15k to 3k almost all left (losers) and the few ones that stayed pretend they won (or they're too dumb to figure out they were on the wrong side of the market). S&P 500 bear tears are pretty delicious at the moment by the way.
You both can say entry matters and entry doesn't matter and be mostly right. Don't waste too much time trying to perfect it. Calculating max risk, probabilities of drawdown, when to exit, when to hold, when to add, how to trail, correlations, those are at least as important as the entry. What I can say is entering very early, far from the stop, out of fear of missing out is bad, and entering very late for a giant risk to reward is greedy and bad. Around 50% retracement is often a good compromise. Stats will help choosing areas and price action (stats such as: over the past 10 years on breakouts would it work out to enter in the big red candle? How about on the previous low? How about 61% fib when the price reacts near the previous low? Etc).
Entry doesn't go alone, for example when you average in a sideways within a trend well you'll want to move your stop each time you add according to your average price. That's a whole other subject. Coming up with a whole strategy even simple and even once you sort of understand the markets and have the basics of price action is still clearly going to take a couple hundred hours at best... Just writing this took me a little over 2 hours, and I rushed it, and I obviously don't start from scratch I researched all of this. Just writing an intro like this about entries and stops and targets and trends and pullbacks and breakouts and timeframes and risk and all the other stuff, not even with stats, that alone probably would take 100 hours by itself. How long it takes to convince yourself to hold winners and cut losers and quit a gambler mentality however = infinite time, just quit now you'll save time (thousands of hours!), investing is not for you.
Oh and finally, an entry "signal" is a joke. You don't go from 0 to 100 "wow this would be a great buy because of this entry", that's beyond ridiculous. You are supposed to be watching something before getting in and waiting on certain conditions to enter (pullback after breakout), never heard of anyone that had "entry signals". When George Soros went short the GBP it was "because of the entry" but he had a whole theory. The "entry" wasn't a magical signal it's simply he was close to the floor, well ceiling, and had a big RR with big odds! And he explains how "I was selling weeks before", he actually "dollar cost averaged" as I explained. He didn't wait for a certain magical point, he wasn't greedy waiting for a 1 pip stop.

FLAG PATTERNS - Hi
(1) as you see when a bullish pattern wants to be a bearish pattern , after breaking support line , we can see a bullish flag or bullish triangle .
(2) as you see when a bearish pattern wants to be a bullish pattern after breaking resistance line we can see
bearish triangle or a bearish flag pattern .
so these patterns will help you to understand market better .

US Indices Backtesting and Charting Session On Price Action Hello everyone:
As promised I will periodically make these backtesting/chart work videos on different markets, pairs and timeframes.
This is for me to present the importance of backtesting in trading consistency.
Not only it will help traders to not have emotional decisions such as FOMO or fear of losing, it will give traders confidence at identifying trade opportunities and execute them when the time comes.
The more we do backtesting, the easier we spot an entry, setting a SL/TP, and remove any emotional decisions.
Today I want to go into the US Indices, specifically the SPY, NASDAQ, DOW. I will pick a few market crashed examples and dig deeper into them.
Few educational videos below on the topic of backtesting, and why it will help you in your trading journey.
How & Why I backtest:
Prevent Blowing an account by backtesting:
Backtesting & Chartwork on USDCAD:
Any questions, comments, or feedback please let me know :)
Thank you
Jojo

Entry Strategies using Support & Resistance ZonesBrief video tutorial discussing entry strategies using support and resistance zones. How I produce support & Resistance zones can be learnt from the live stream recording HERE
With any trading indicator, it is vitally important to have a sensible entry strategy with entry, stop loss and enough risk to reward to the next support or resistance zone. It is also as important not to fudge your entry and stop to give a decent risk to reward. Frame your charts first with Support & resistance zone, put on your stop and your entry. Then the last thing to do is put on your risk to reward. I cover this in this video and show you how to use the Fibonacci extension tool to work out your risk to reward

GBPJPY *UPDATE* ANALYSIS ENTRYYesterday analysis playing out nicely. We have now entered as planned on 137.200 with a 20pip stop loss. The plan is to hold the trade for full 4 days for R:R of 1:8. Please check out my analysis yesterday for this.

How to use the Oscar OscillatorOSCAR Oscillator by GenZai
Green line is the Oscar Rough
Red line is the Oscar
By default based on the 8 last candles and smoothed using RMA
Purple line is the Slow Oscar
By default based on the 16 last candles and smoothed using WMA
HOW TO USE
Exit signaling
This indicator can be used as an exit indicator when line cross each other.
Entry signaling
When the green line crosses up, it indicates a long entry
When the red line crosses up, it indicates a short entry
Overbought/Oversold
When the indicator crosses the dashed grey lines it indicates Overbought Oversold
Slow Oscar Add-on
This is an Add-on to the orignal Oscar indicator
Can be hidden if you want the original experience of the Oscar indicator.
Can be used as a confirmation indicator by looking at the direction of the slope to verify is your are trending long or trending short.
Can be used as a baseline to confirm signals given by Oscar
Can be used to tweak your signals and test different settings.
Stock or Forex?
The program was originally written for stocks, but works equally well with the Forex market.
How this indicator is calculated ?
This is the formula we use to calculate the Oscar:
let A = the highest high of the last eight days (including today)
let B = the lowest low of the past eight days (including today)
let C = today's closing price
let X = yesterday's oscillator figure (Oscar)
Today's "rough" oscillator equals (C-B) divided by (A-B) times 100.
Next we "smooth" our rough number (let's call it Y) like this:
Final oscillator number = ((X divided by 3) times 2), plus (Y divided by 3).
SETTINGS:
You can choose between different smoothing options:
RMA: Moving average used in RSI. It is the Adjusted exponential moving averages (also known as Wilder's exponential moving average)
SMA : Simple moving average
EMA : Exponential moving average
WMA : Weighted moving average
The Script can be found here:

WHAT TOPICS WOULD YOU LIKE ME TO COVER?Hi Guys - all my followers and non followers..
I am getting back to releasing weekly episode/episodes of the ' Art of trading Psychology' in the aim of helping traders get in the 'zone' when trading. Mastering trading psychology is by far one of the hardest aspects in trading yet it is also the one that will drive you to you success as a trader if mastered.
I would truly love to cater this podcast to you guys and in order to do so, i need to understand what it is you're struggling with and what you would like to cover i.e
- finding taking profit hard?
- being consistent
- scared to take a trade or uneasy when you're in a trade?
- Losing too much?
Anything you think of, drop it in the comments below or message me!!


200 EMA - best use for entries!I don't use indicators, they're not my style, they lag, they repaint; and in my opinion they don't work.
The 200 EMA on DAILY can be useful because of how slow it is. We can use it to filter the direction of which way we trade.
Price ABOVE 200 ema = ONLY BUY
Price BELOW 200 ema = ONLY SELL
Then drop timeframes for your entries via your strategy whatever that may be. If your strategy says go long but price is below EMA, don't take the trade etc...
Ignore the EMA on other timeframes lower than the daily. You want a slow daily direction indicator.
Don't blindly trade this, wait until price is clearly past the EMA and maintaining a good distance from it.
Use it as a guideline if you struggle working out fundamentals to help you filter a direction to trade.
NOT TO REPLACE FUNDAMENTAL ANALYSIS!!!

High Probability Entry using Shoulders and Price ActionWhat we term as a 'shoulder' (Lower High/Higher Low) is a prime entry setup with statistically high probability. The important thing to note is that it is used in conjunction with price action to correctly identity when traders are being 'caught off-guard' on the wrong side of the action and forced to close. We like to term it the 'sweaty palm' feeling when you begin to realize that you are wrong and have to start to look for the exits and minimize losses. In the example on the German DAX index, there were some great opportunities to sell (off the shoulders when sellers stepped in at lower levels and buyers were forced to bail) with a defined risk profile that paid out handsomely...if you are able yo define the key zones and when traders will be put under pressure. Hope this helps and Happy Trading....TradeSetup.

How do YOU trade harmonics?? So guys, there a tons of way to trade harmonic patterns.... in the end most of them fail so how do people trade them successfully...
I myself decided to look into different approaches to trading harmonics. I have looked at tons of charts on different timeframes and i found an approach I was not able to find online anywhere for some reason... (wonder why)
I have never seen a trading strategy that could provide you with this amount of RRR. The risk per trade is absolutely minimum, while the return is maximum.
The process is quite simple, and im sure this is what most of the real traders out there are doing, and probably charging thousands and thousands of dollars for teaching this to people. But its all good!
First you must find a harmonic pattern. This should be easy with all the software out there. (some guy said you take the ''art'' out of trading by doing this, please don't be that guy)
For this approach, price will have to see a retracement greater then 50% of CD in the harmonic pattern.
if price retraces down to the 61.8% this will follow with a pullback to 23.6%. Afterwards price will come down at touch the 23.6%, (sometimes a few pips above or below) to trigger all the pending orders. Price will fight its way up to touch the 127.2% extension, while finding support at fibonacci retracements greater then the initial 23.6% ( it will not go under this level! )
If price retraces down to the 78.6%, it is considered strong and the move is expected to turn at 161.8%
In some cases the move will go much higher, extending up to 4.618% (!!?)
Same approach for bearish situation.
Now the price does not always retrace to those exact levels, but when it does you can be 100% sure that it will happen.
With this approach you will have signals, confirmations and entry points based on pure data!
If you happen to find this approach useful, give the post a like and comment below with your ideas.
God bless

How to Trade Using Volume ProperlyWeakness = Up moves on decreasing volume & Down moves on increasing volume
Strength = Up moves on increasing volume & Down moves on decreasing volume
I usually try to take a look at the general background and get a feel on how weak or strong the currency pair is. When I have determined strength or weakness I will try to mark up confluent zones where sellers (if short) and buyers (if long) are going to jump in.
When price reaches my confluent level, I will look at the 5M chart to pinpoint entry.
Example will be given below, however, not on this chart as this is to old for me to find 5M data but I will give an example that is close enough.
I have not marked any green areas (strength) on this chart after our short entry point.
